I never expected that the first brutal "bloodbath" in the market would come on January 1, 2024, and the market is wailing!
In this silent battle, the market makers are still using the classic tactic of raising prices to sell off, and many users may not know the ins and outs of it. Let me give you a detailed analysis.
1. TRB is a Strong Market Maker Coin
First of all, it is important to recognize that TRB is a coin controlled by strong market makers!
So how do you identify such a strong market maker coin? The best way is through on-chain data, because market makers will not keep a large amount of coins on the exchange, they must be on-chain.
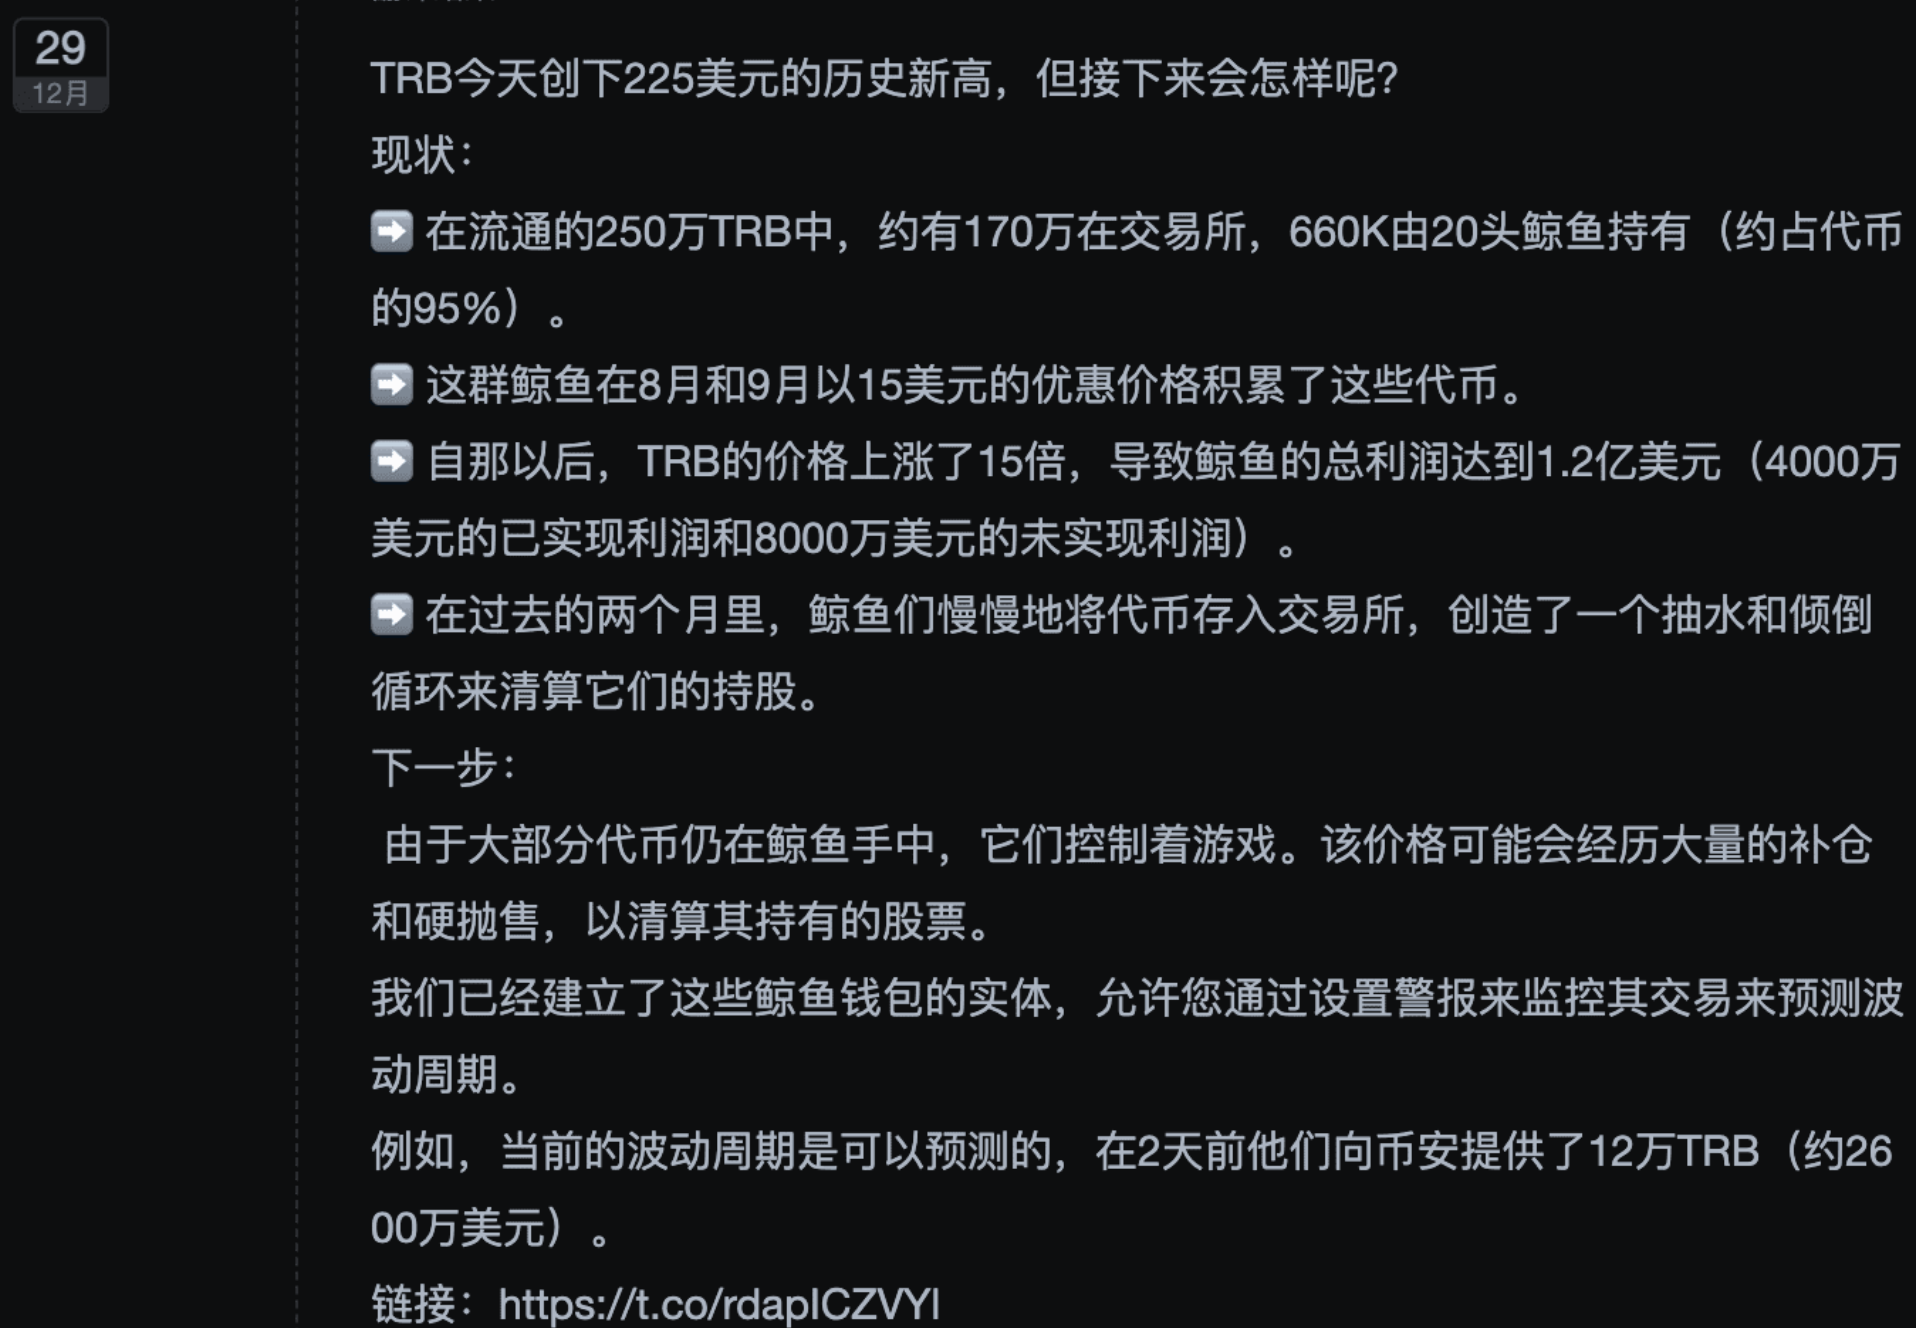
On December 29th, spot on chain posted a tweet, stating that about 95% of TRB is in the hands of market makers. The claim is that 20 whale addresses hold it, but we can assume that the chips are highly concentrated.
Now, guess, compared to BTC's 21 million coins, how many TRB coins are there in total?
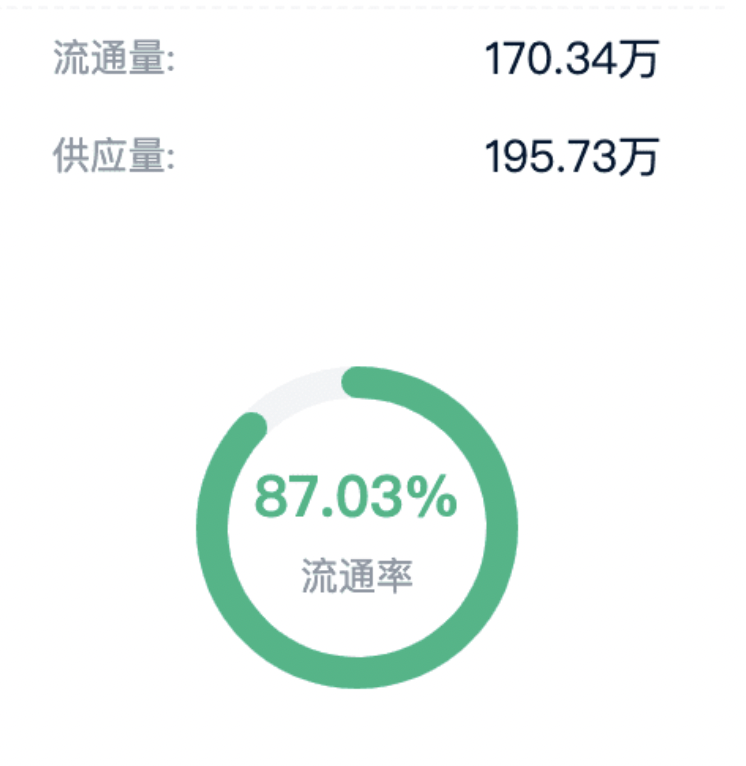
The answer is that the supply is only 1.95 million coins!
With 21 million BTC, it can be raised to $40,000, and TRB can be raised to $1,000. Logically, if $1,000 doesn't work, then $500 should be okay!!! (Last night on OKX, TRB had already risen to $700)
But just knowing that this is a strong market maker coin is not enough, why?
Because we don't know how the market maker will operate, whether to raise or drop, it all depends on the market maker's intentions, which is very difficult to follow.
So we need to use the next tool.
2. Market Sentiment
How do we analyze market sentiment?
Here, I provide 3 indicators: ① Position Size; ② LSUR; ③ Funding Rate.
(1) Position Size
How to analyze the position size?
This is the trend of position size before the explosive rise:
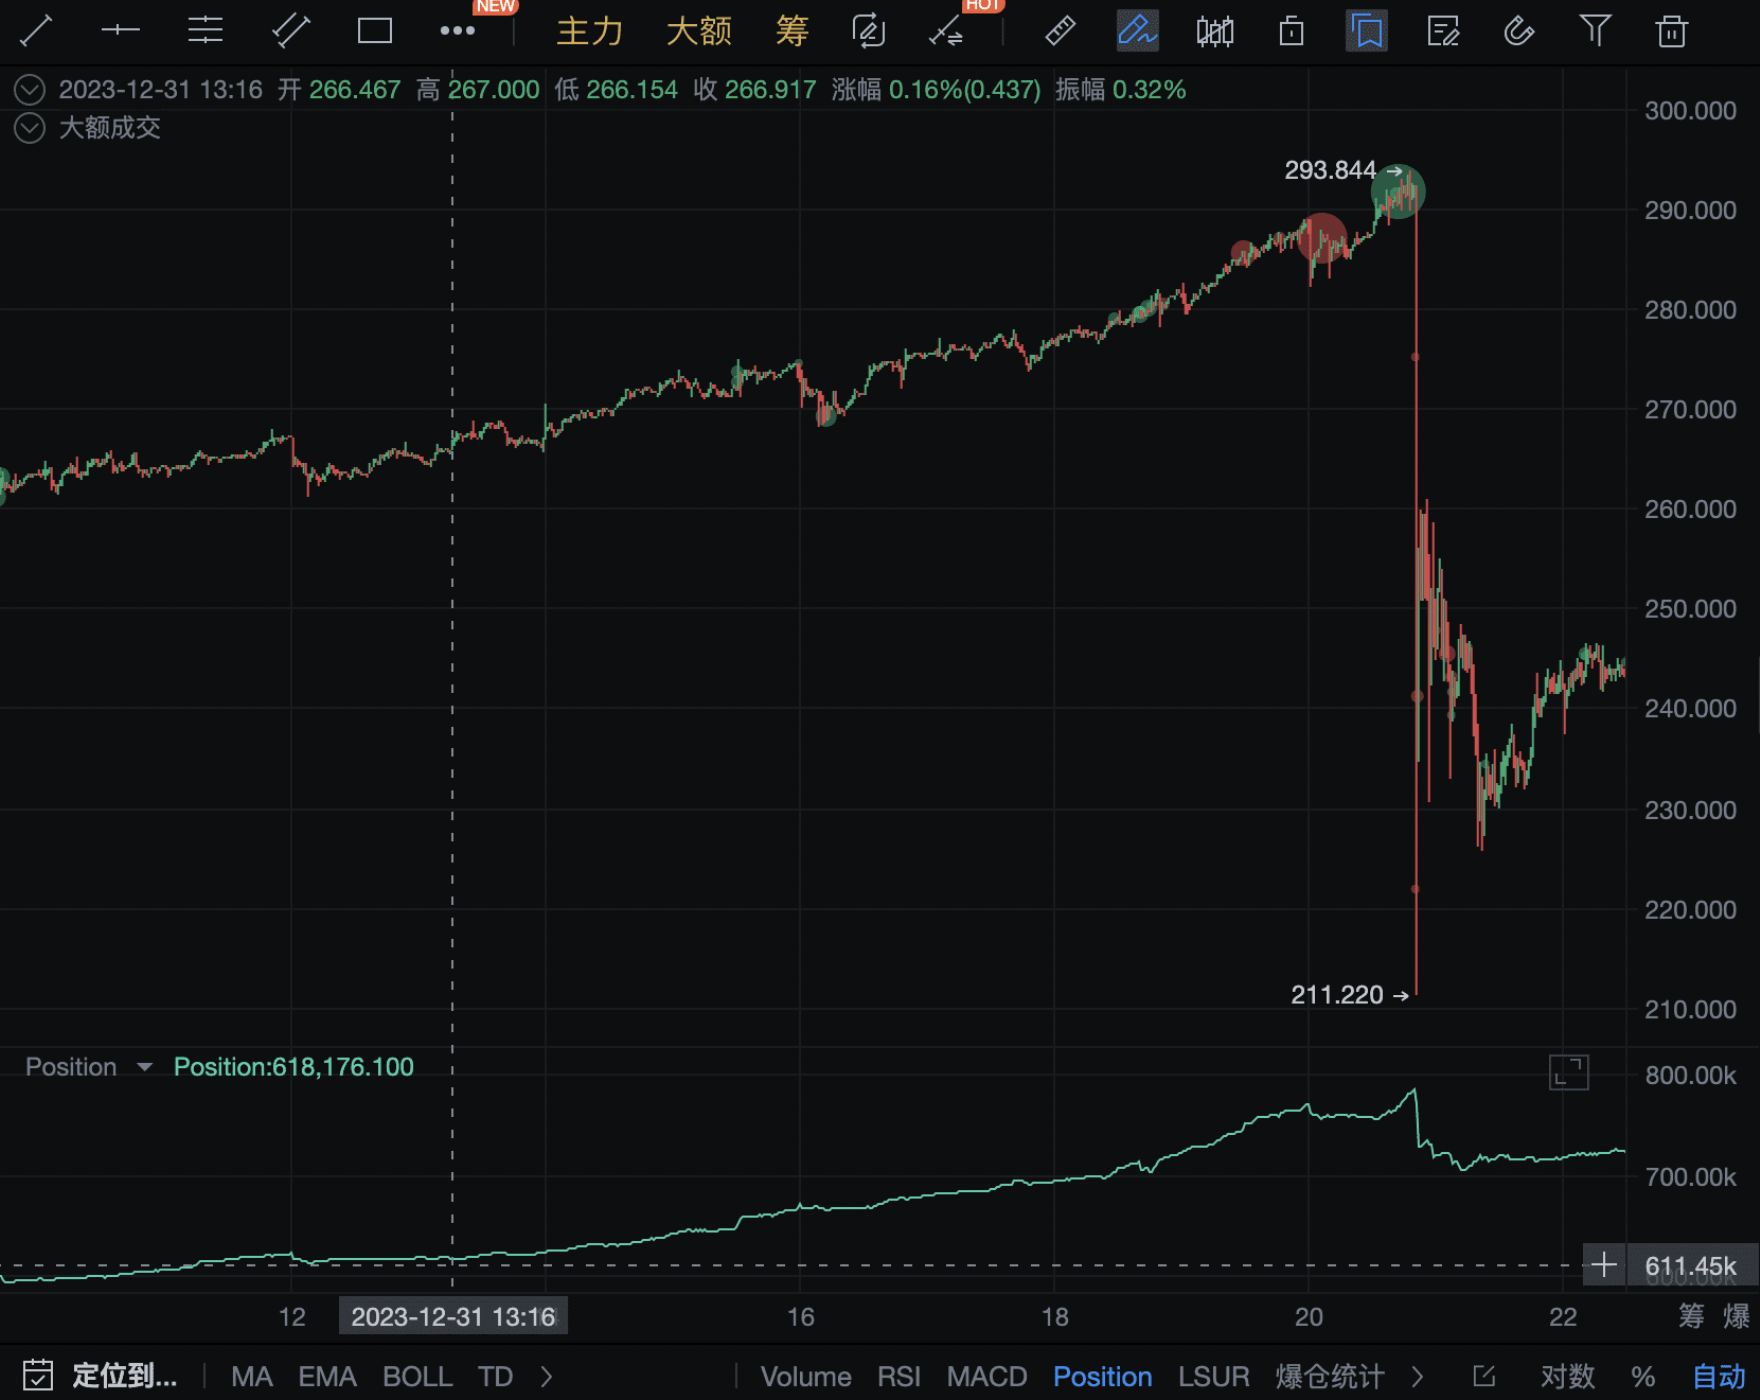
As the price rises, the position size increases, the trend is very good, indicating that large funds are going long.
So, how should we distinguish whether it is the market maker or retail investors going long?
This requires combining the second indicator—LSUR.
(2) LSUR
LSUR is a very practical indicator, LSUR >1 means retail investors are going long, LSUR <1 means retail investors are going short.
The following chart shows that during the TRB rally, LSUR rose in sync, indicating that retail investors were going long.
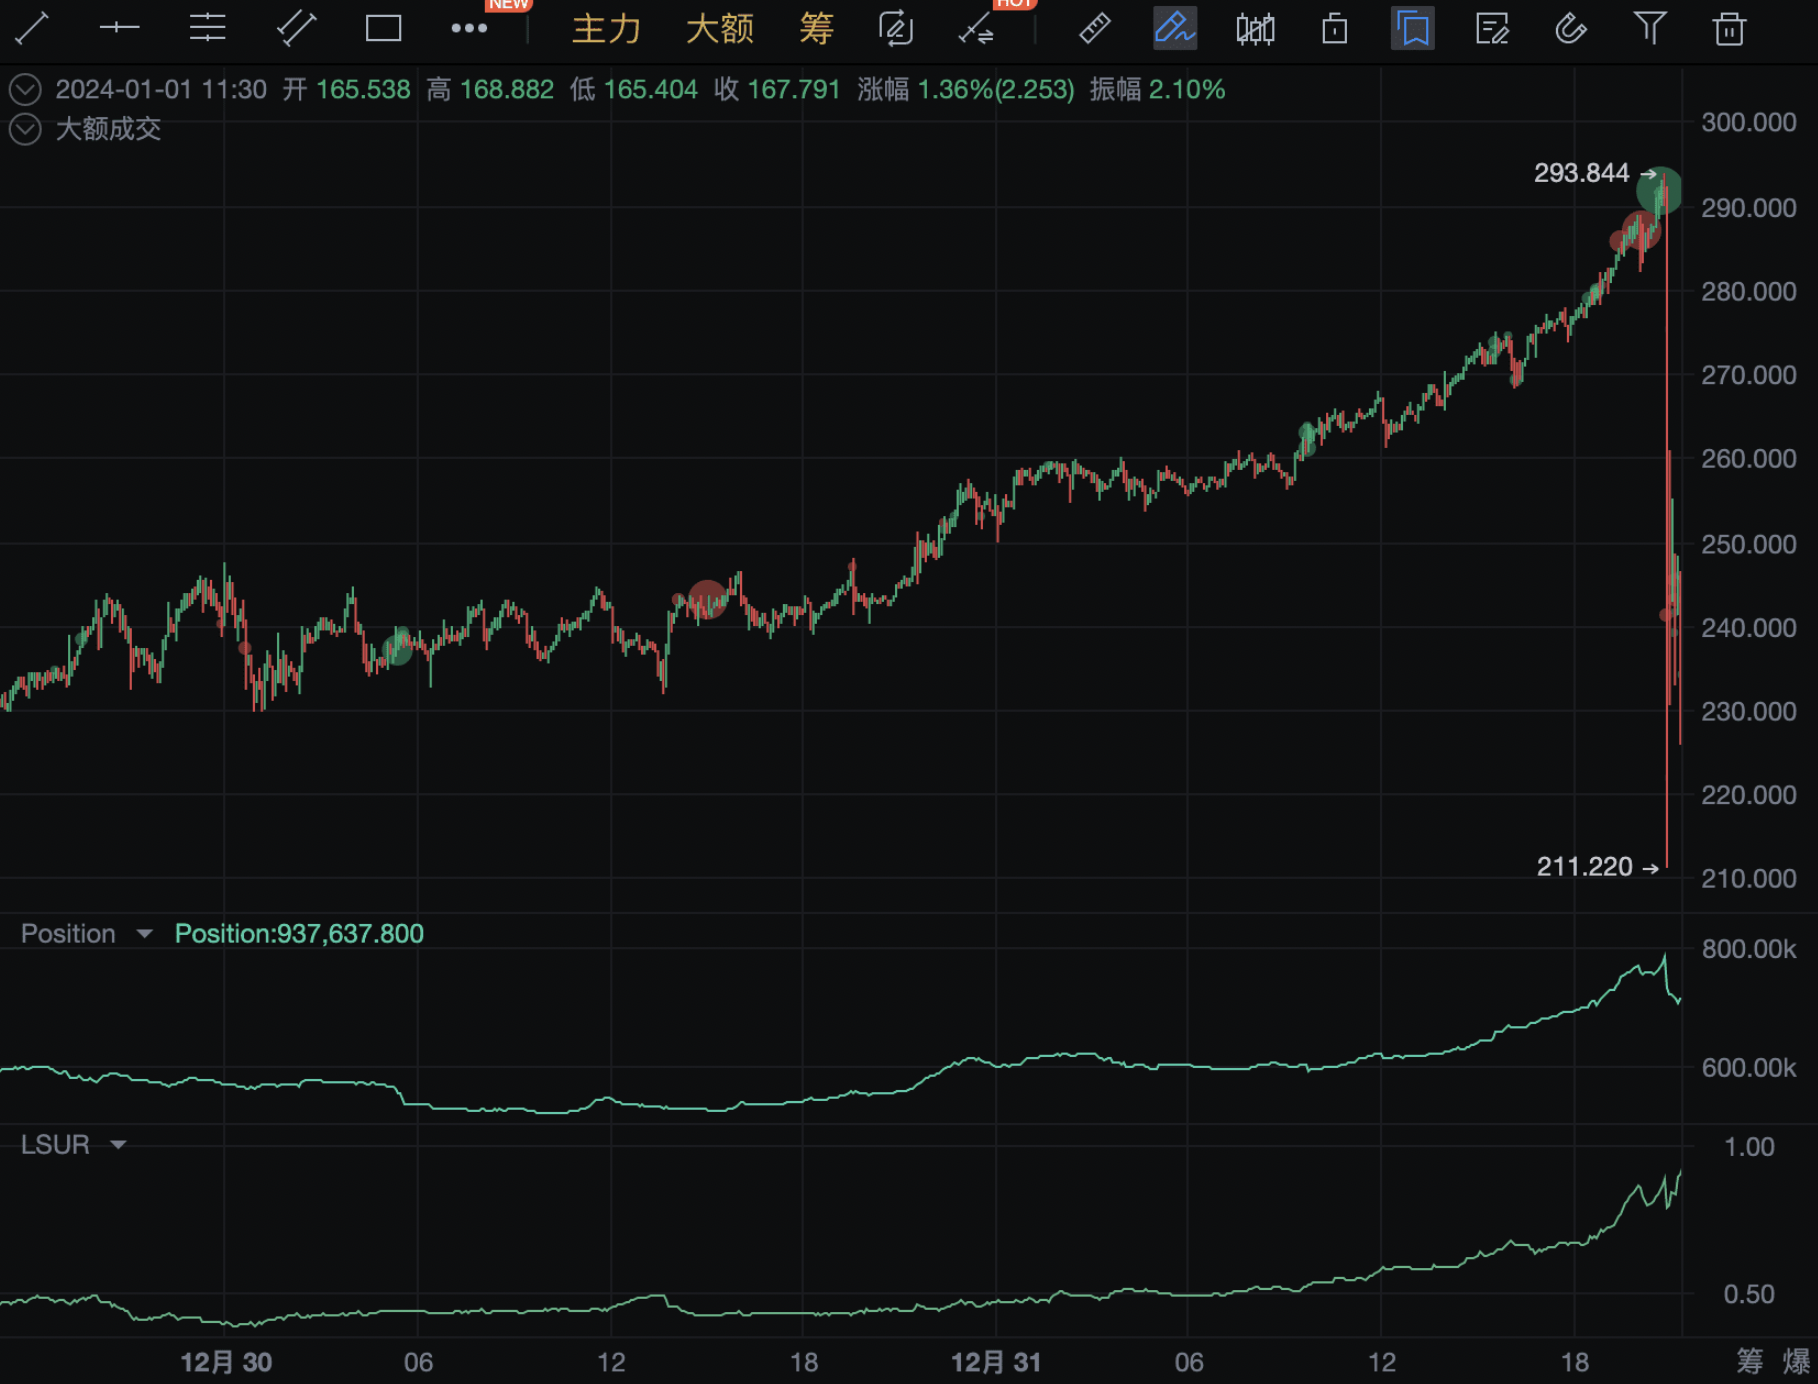
So, if you were the market maker for TRB at this time, what would you do?
Yes, you would wash the market, and the extent of the market wash depends on your conscience!
Then the first classic scene of last night appeared, with a sharp drop of 30% in just a few minutes!
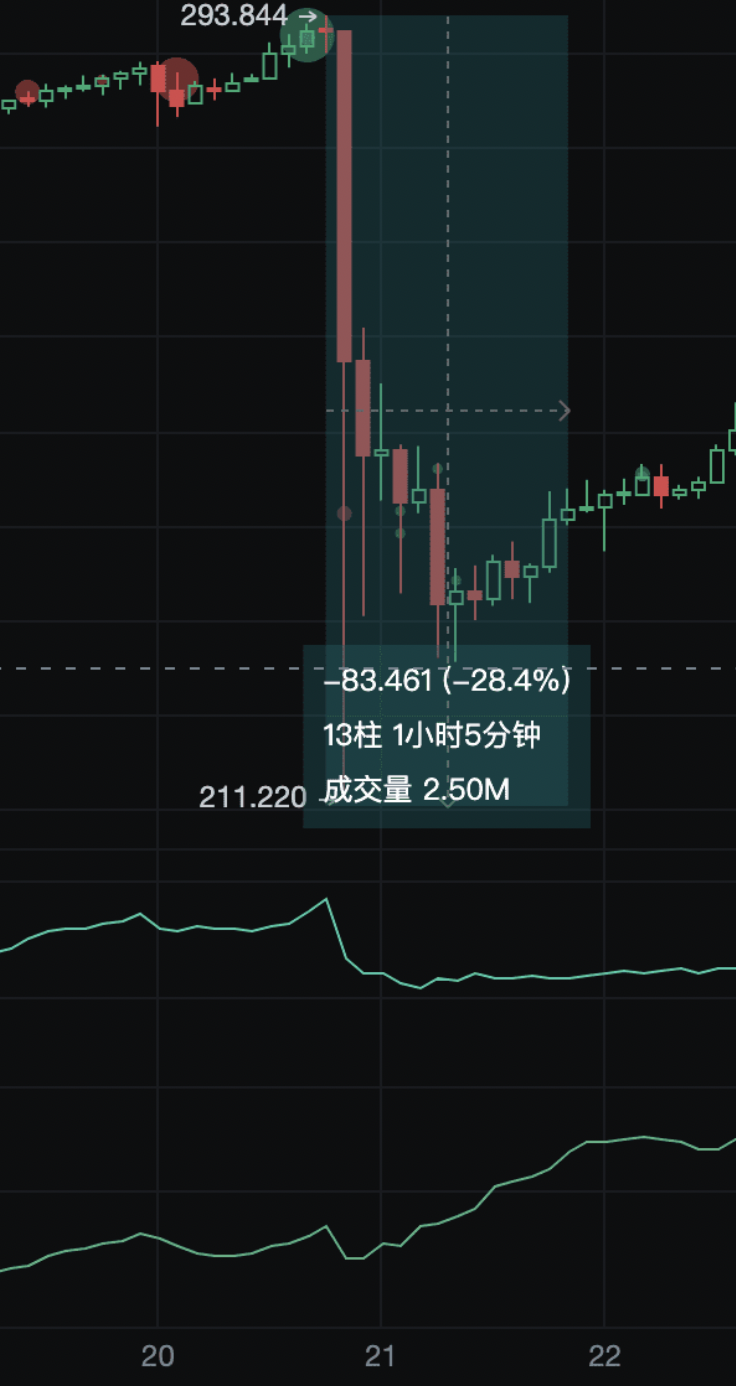
This market wash was very brutal! A 30% drop, equivalent to 3x leverage, meaning that even if you went long 3x, it wouldn't work!
Why 3x?
Because a long time ago, the leverage area of OKCoin was default 3x, and later everyone used 3x leverage for arbitrage, feeling that 3x was very safe.
After the market maker finished washing the market at this time, how much was liquidated? You can see how much the position size has decreased, it's not bad overall, estimated to have liquidated $30 million.
And after TRB's sharp 30% drop, what happened?
That's right, all major media outlets were reporting that TRB had plummeted 30%, and it was all over the headlines, with very high discussion!
What does this mean? It means that TRB has caught everyone's attention, many people may not have even looked at TRB before, or knew what TRB was, but with this publicity, many users now know, and then everyone starts trading!
It's important to note that the attention of traders is a very important aspect, because without popularity, it's impossible to sell off even if the price rises, and when popularity comes, the next move can officially begin!
Here we still use the LSUR indicator, why? Because this indicator is really too useful, it's very accurate for judging the general direction of the market maker and retail investors!
Market makers and retail investors are opposites, when retail investors are more, market makers can eat well. We can see how retail investors view TRB.
After the sharp drop in TRB, everyone thought it would rebound, so it must be going long. After last night's drop, retail investors began to show clear signs of going long, because the LSUR indicator showed a clear rise.
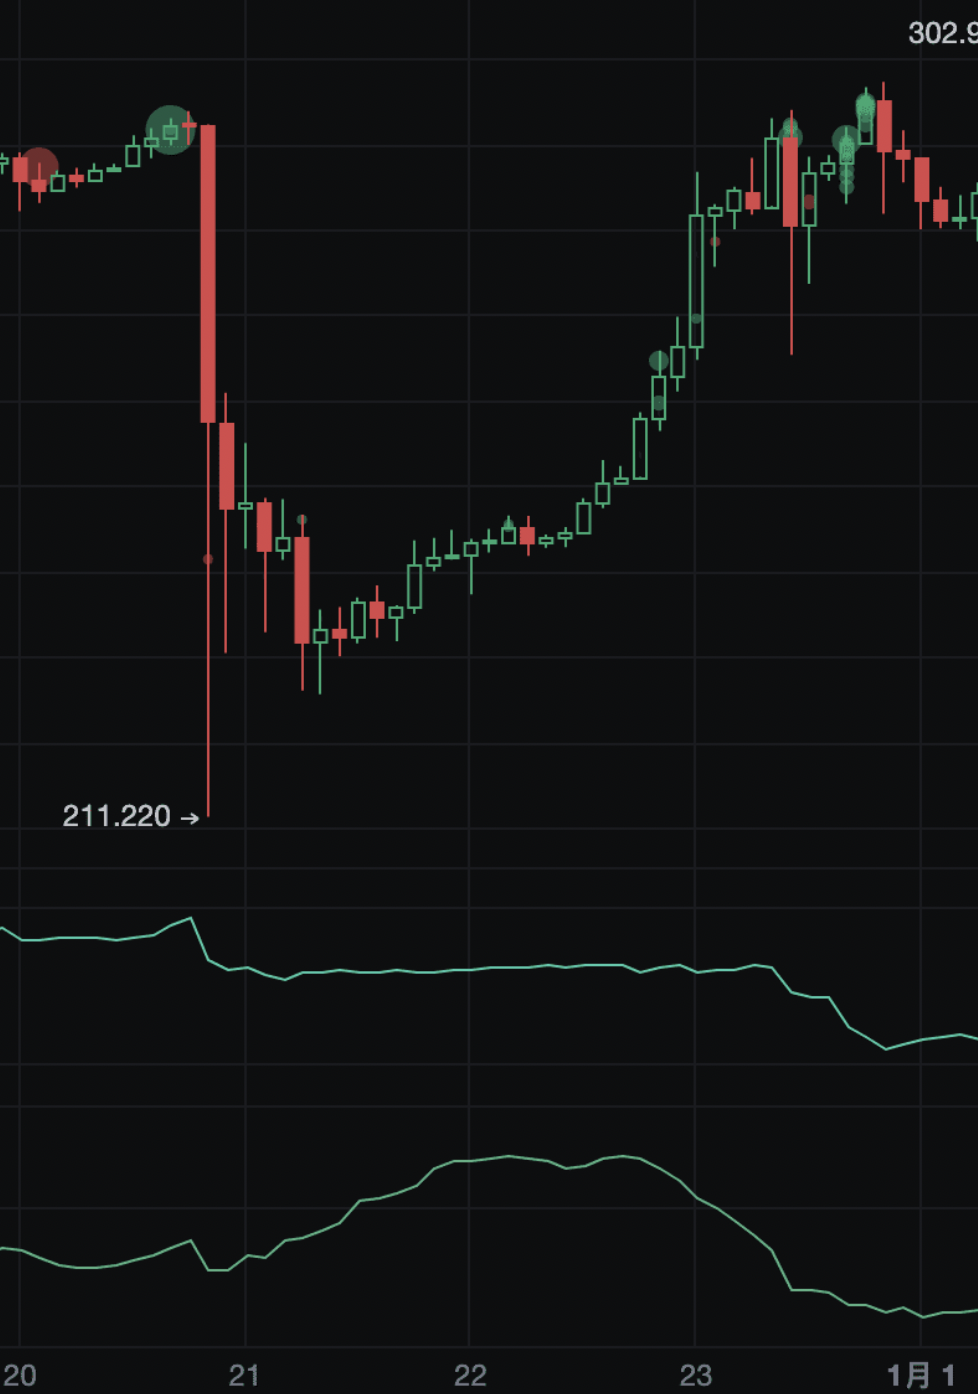
Our thoughts and LSUR data support this judgment, so there is an expectation of an increase in TRB.
What's next?
At this point, we need to use our main large order indicator!
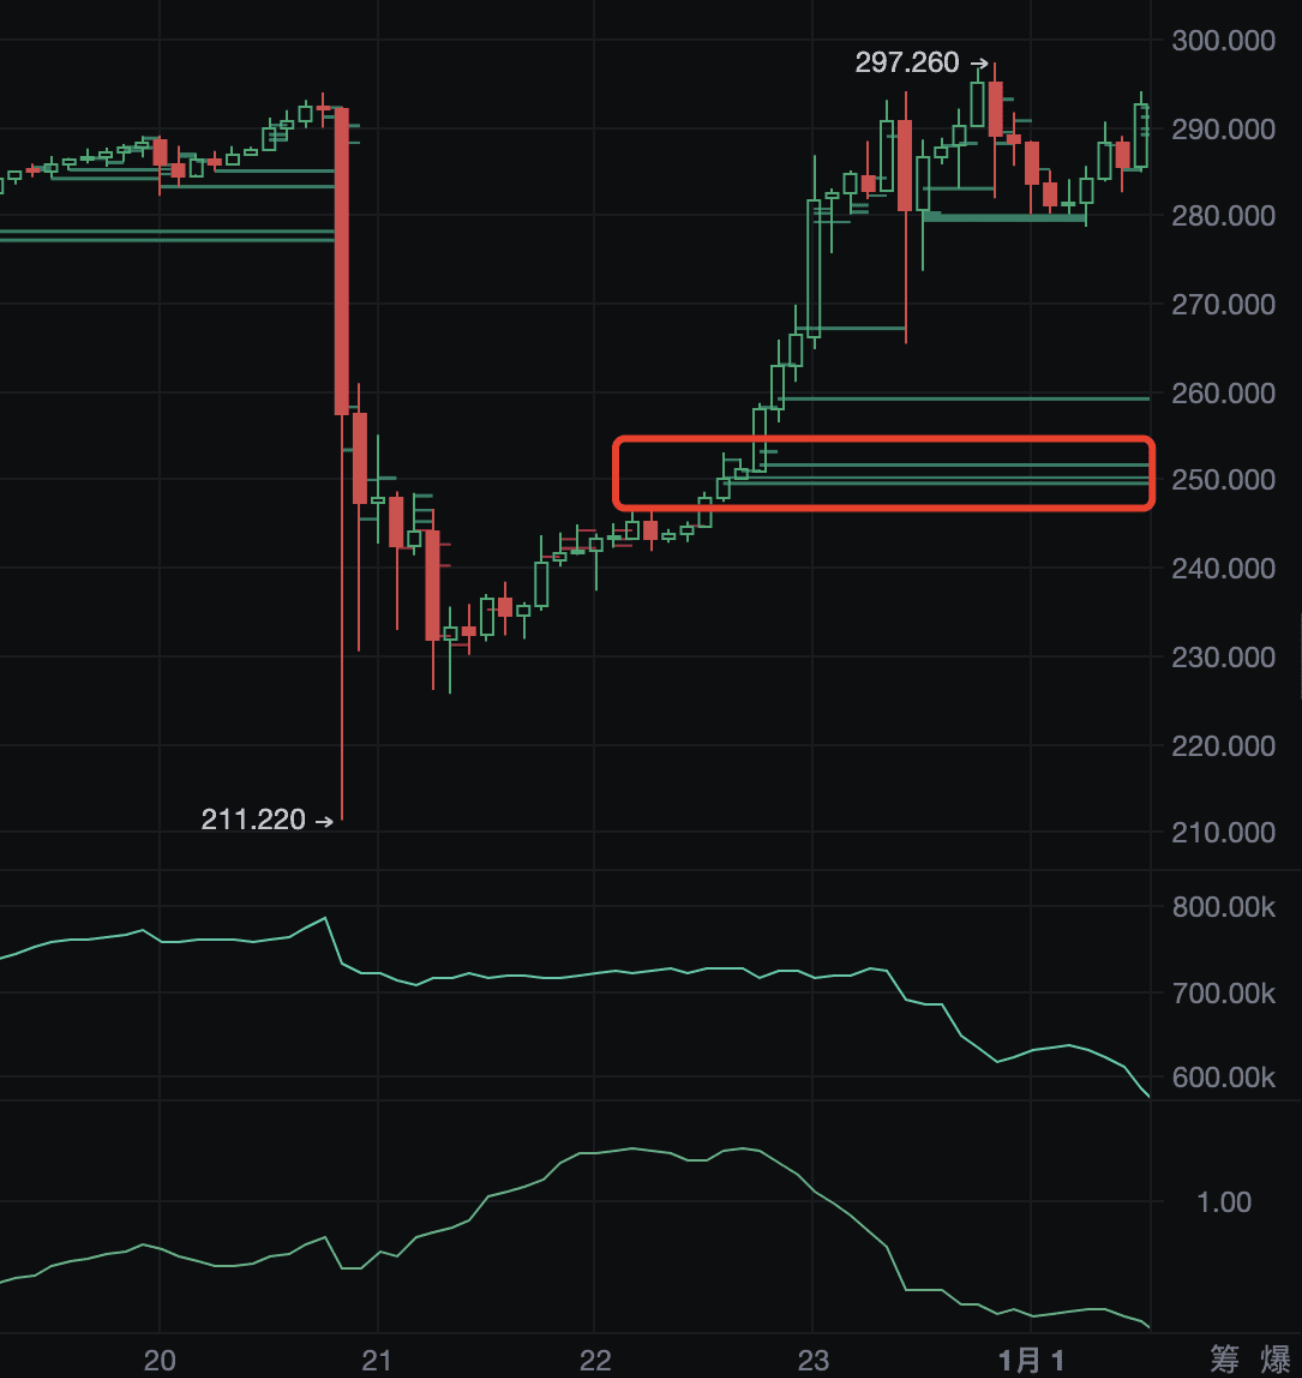
$250 is a turning point, because the large order data shows that after this position, the main players continued to place a lot of buy orders below the current price.
Why operate like this?
Because it's to attract market-making robots or some high-frequency robots, relying on OBI (order book imbalance) trading strategy robots to actively buy and push the price up, continuously using large buy orders to push the market-making robots to buy at market price and push the market price up, which was the classic operation last night.
At 11 p.m. last night, after the TRB market price returned to its original position, what happened?
The price was flat, the position size decreased, and LSUR decreased. What does this mean?
It means that everyone thought TRB had reached its peak and started to close out their positions and exit, retail investors started to go short, leading to a decrease in LSUR.
Last night, after TRB reached around $290, it traded sideways for a long time, at this point, we would naturally think of going short at the previous high!!
So a series of data indicates that at this position, retail investors are not optimistic, if the price goes up, retail investors will still firmly go short.
At this point, the awareness of the market maker and retail investors has clearly changed, the market maker is bullish, and retail investors are bearish.
The hunting moment begins!!!
And oh, it's late at night, it's New Year's Day, everyone has to spend time with their families, celebrate the New Year, sleep… This is also why the explosive rise launched in the early morning ended in the morning, because it was targeting the friends in the GMT+8 time zone!
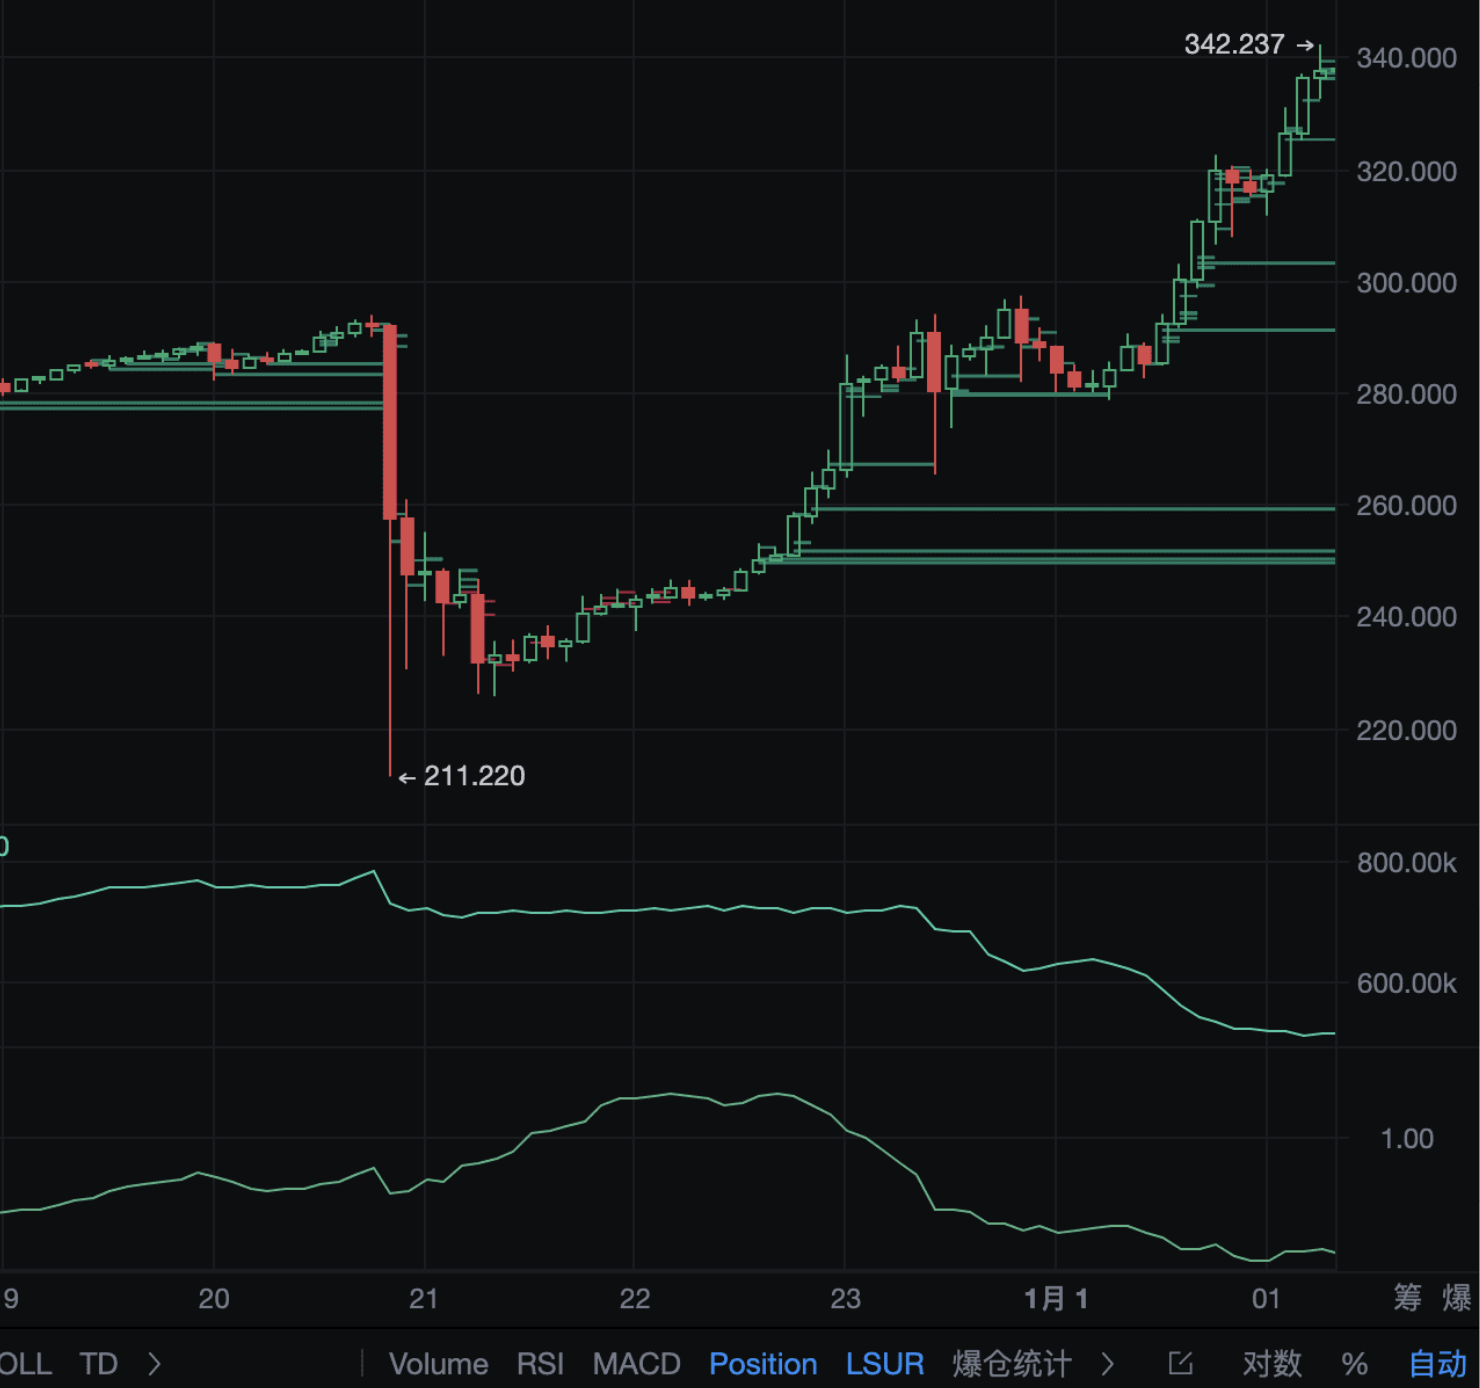
This chart is very classic, with the main large orders aggressively supporting the price and LSUR continuously declining.
So why doesn't the price drop?
Because when the market makers feel that you want to buy, they will buy in advance, and then sell to you after raising the buying price.
From $250 to $464, an 80% increase, can you guess how much capital the market makers used?
The answer is $40 million! With $40 million in large orders, they managed to raise the price from $250 to $464. The subsequent rise was actually the market makers selling off, and the main upward trend was from $250 to $464, during which the market makers used approximately $40 million in capital.
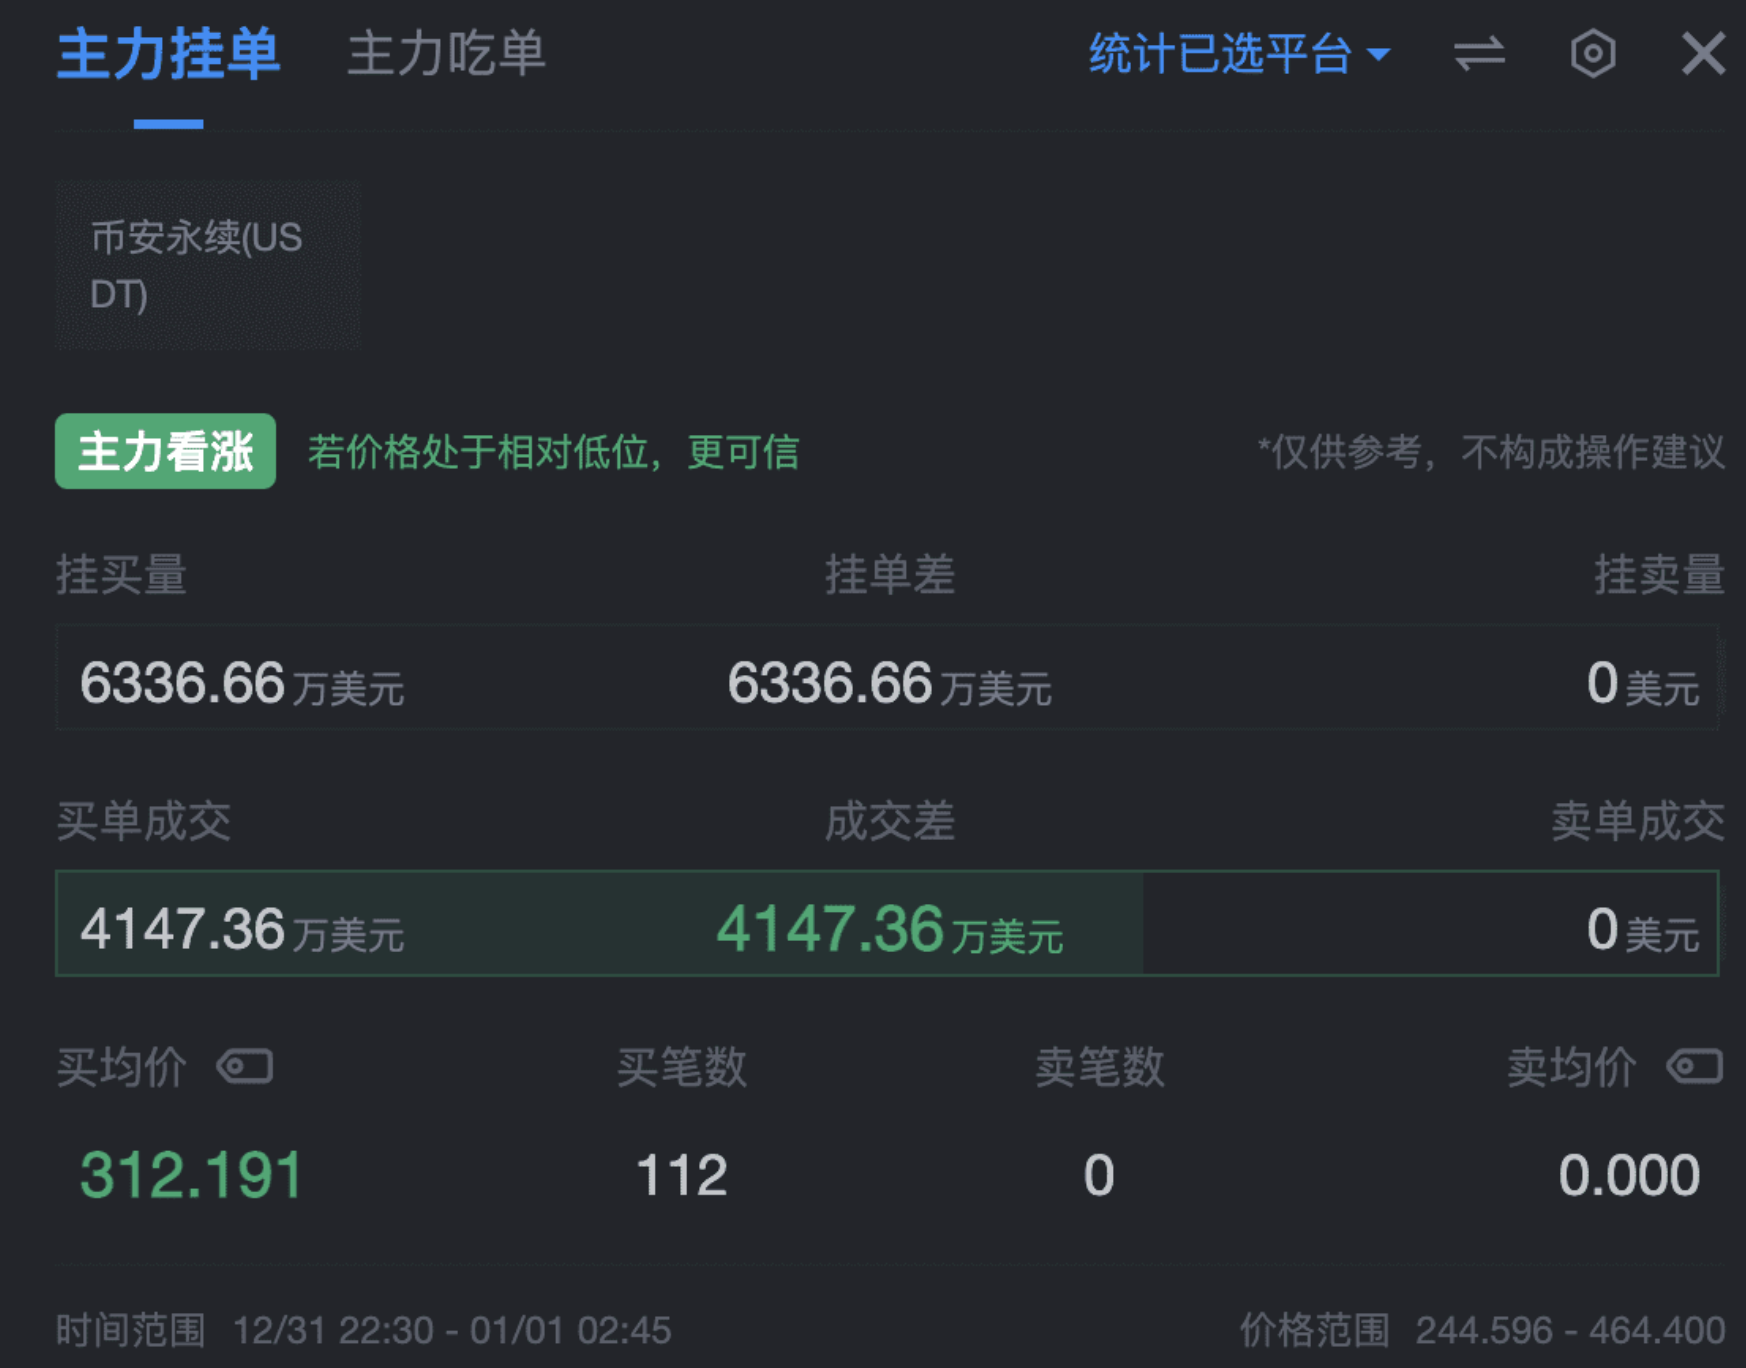
Market maker control is basically about accumulation, washing, raising, and selling. The accumulation phase has ended, and now it's the selling phase. In the selling phase, the best method is to raise the price to sell off!!!
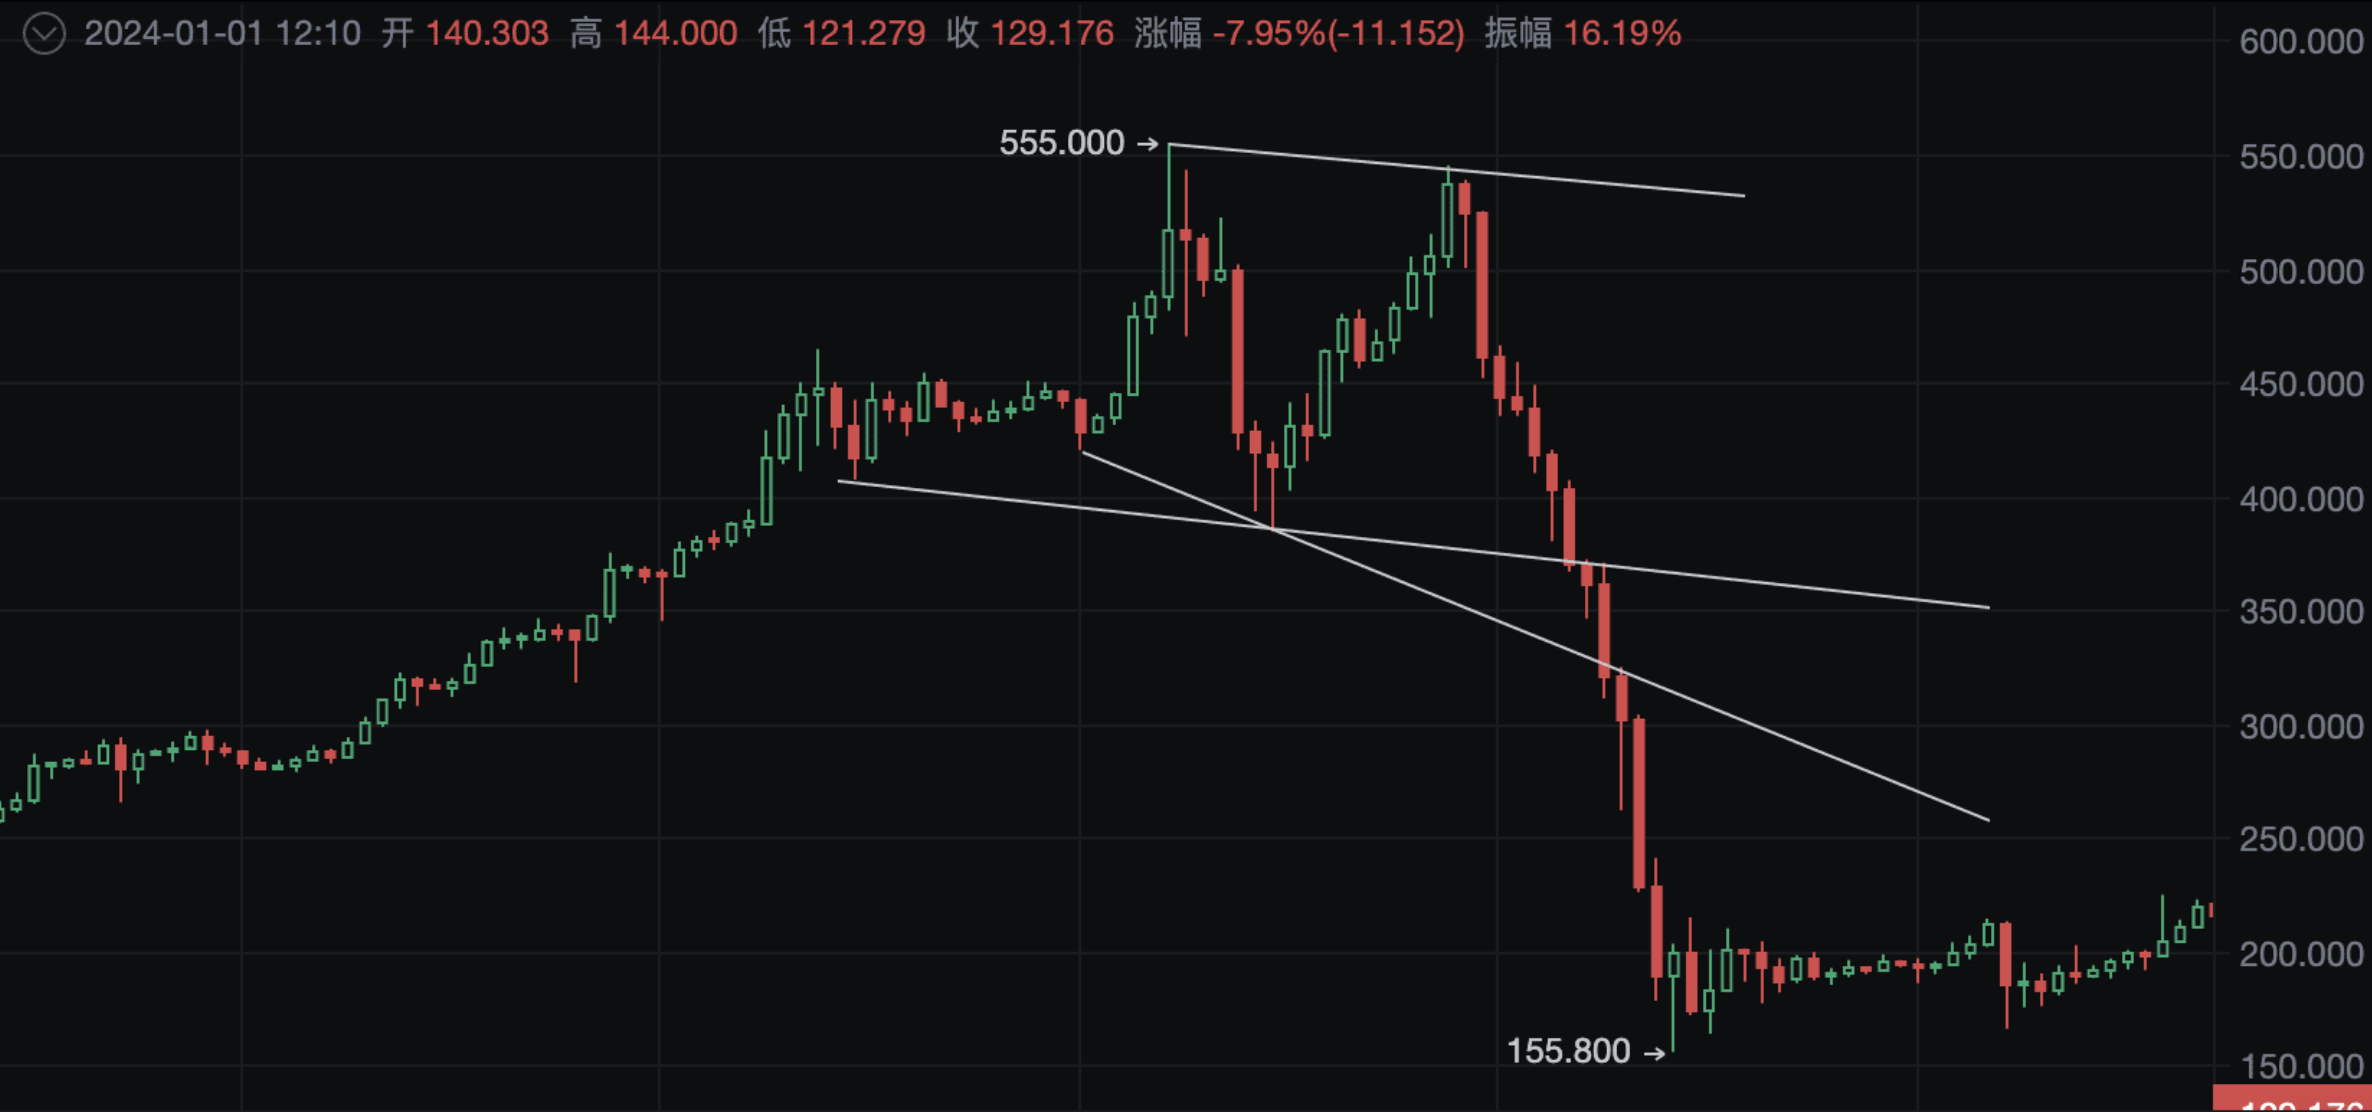
I've drawn a simple pattern here. After the market makers finish raising, they start their selling phase. After consolidating, there's a sudden surge, attracting technical analysts to buy in, and then quickly dropping, triggering stop-loss orders. This drop back to around $464 is actually clear selling, and at this point, a deep retracement will attract retail investors to buy in again, continuously pushing up the price. But because the market makers have been selling off, the price is rising slowly and can't break the previous high.
But it's important to note that in many cases, the second peak in the crypto market will break the previous high, triggering stop-loss orders for short positions, and then drop. So this rise, the market makers were kind, otherwise they would have broken the previous high, triggered stop-loss orders, and then plummeted, leaving you in tears.
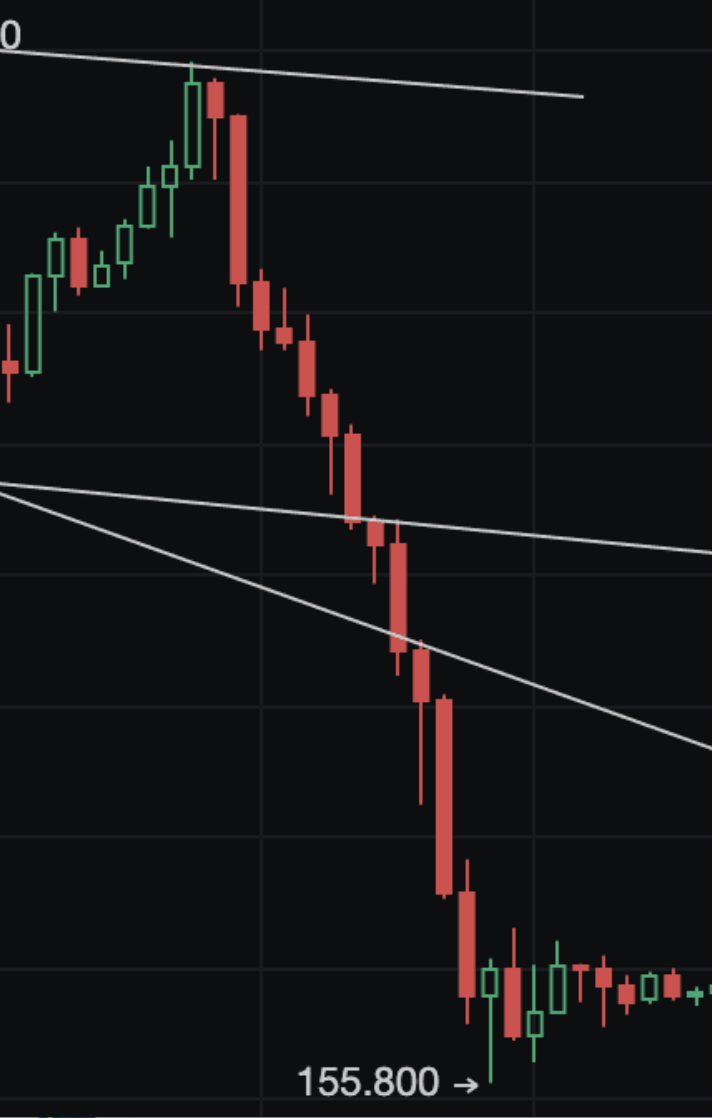
Kindness exists, but not much, because it led to a 70% drop!!! This drop basically exceeded the expectations of 99% of people!
Why can they operate like this? Because this is a coin controlled by capital, not fundamentals, which can be explained by technical analysis.
So how do retail investors operate during the drop?
Let's go back to the analysis of LSUR and position size. We retail investors like to buy the dip and hold, and during the drop, the position size increases, LSUR rises, indicating that retail investors are buying in.
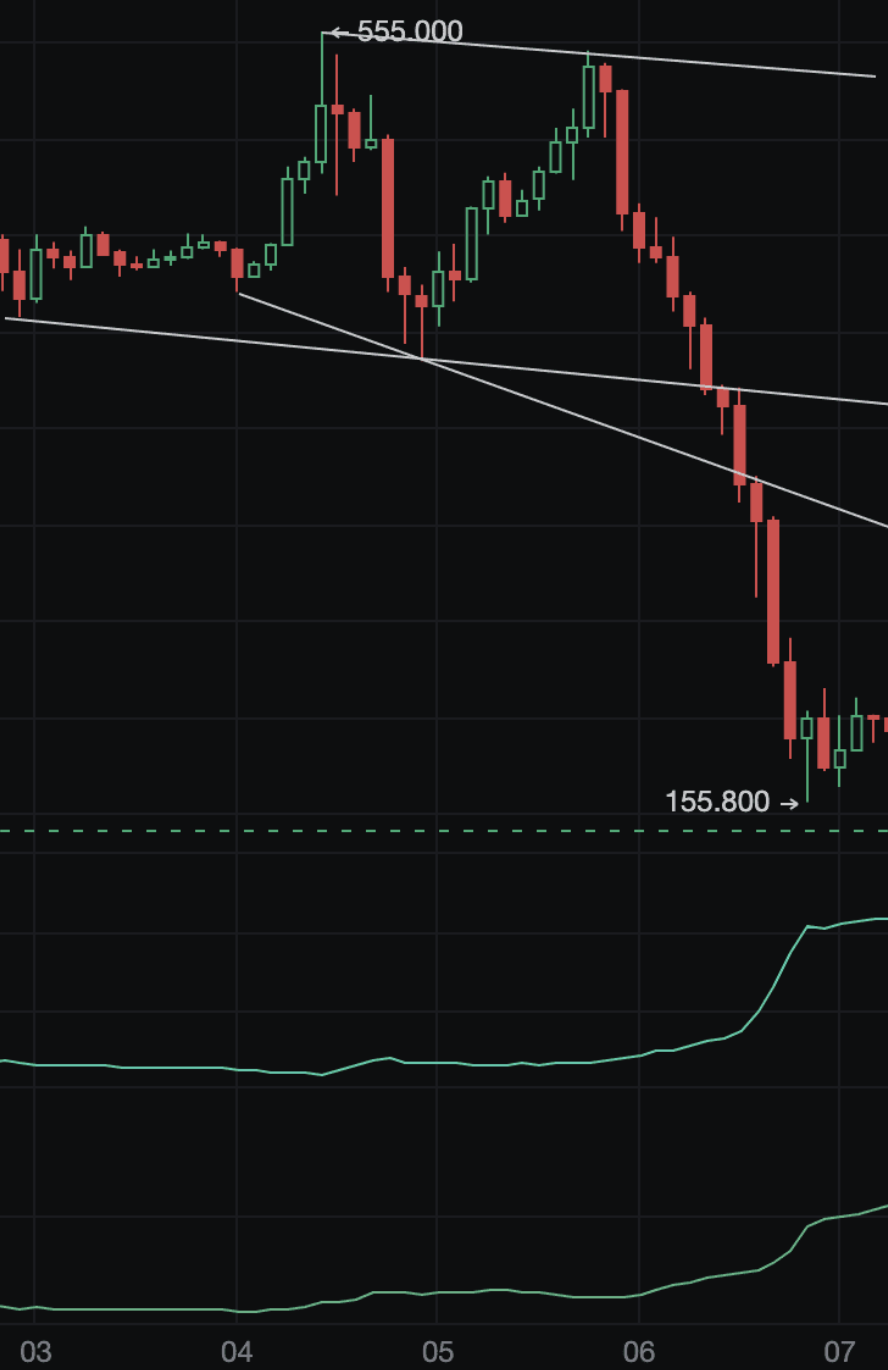
Also, you can notice the humor in the highest price of $555, isn't it? (This can be understood as a kind of market language, in the same situation, 555 means crying, meaning "I'm going to sell off, cry about it." This situation has also occurred before.)
Now, let's talk about the explosive funding rate!
(3) Funding Rate
Last night, Binance settled the funding rate every 4 hours, with a funding rate range of +/-2% for TRB. A funding rate of -2%, settled every 4 hours, was very tempting.
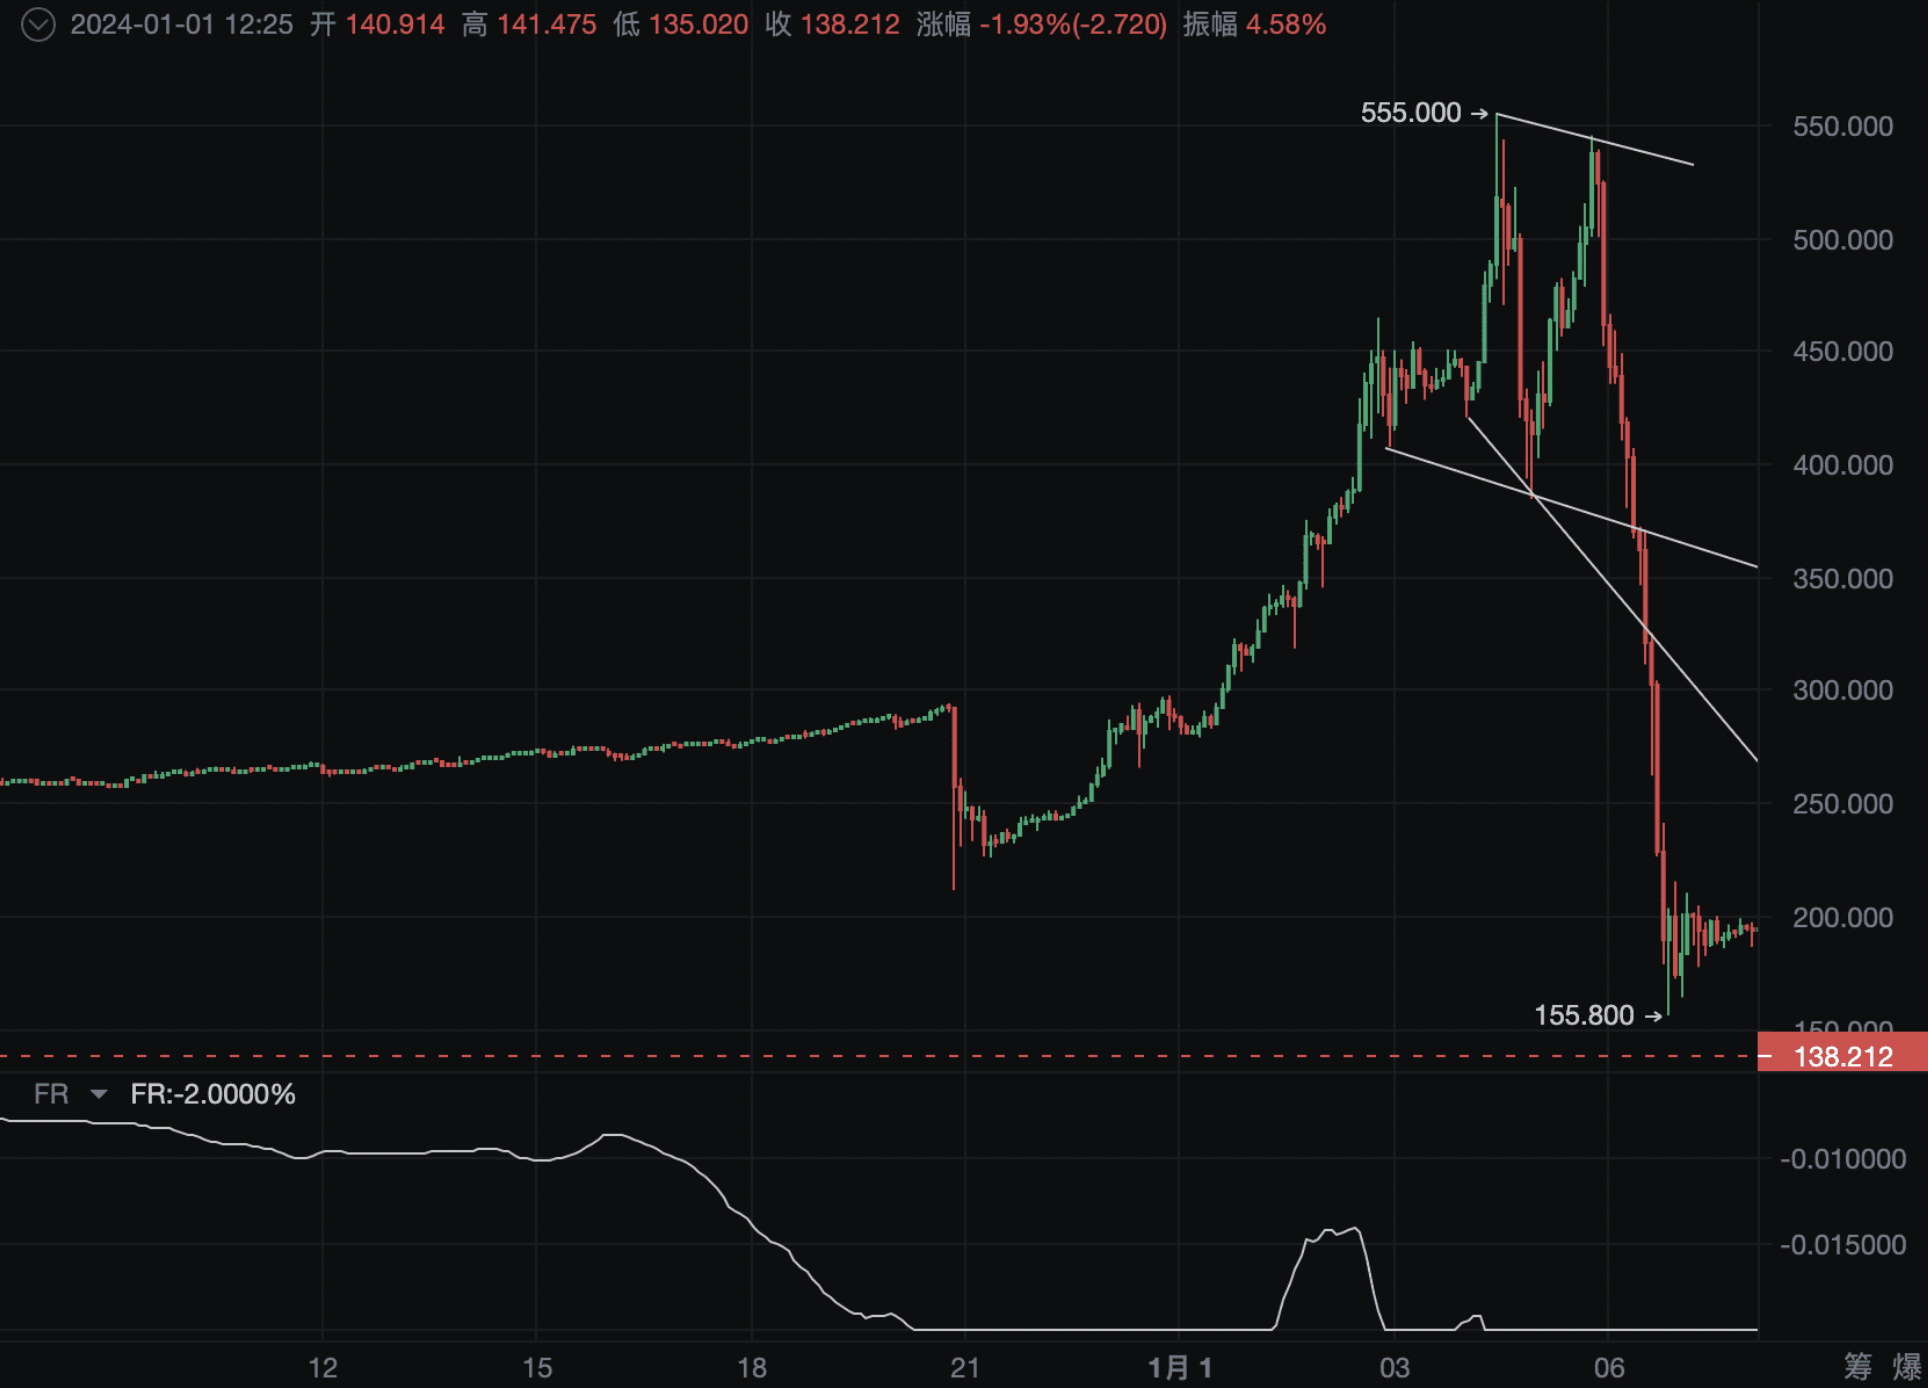
A funding rate of -2% means that most people in the futures market were shorting TRB, causing the TRB price to be lower than the spot price.
Since retail investors were shorting, the main players were definitely going long, and LSUR also reflected this data feature, so we got validation from multiple data sources for this judgment point.
However, traders who only trade one side of the market rarely care about the funding rate. So, who cares about the funding rate?
That's right, it's arbitrage traders!
What arbitrage opportunity appeared last night? The TRB funding rate was negative, allowing for reverse arbitrage, but reverse arbitrage requires holding the coin, and the market makers usually borrow all the coins in advance to avoid interference with their operations, so reverse arbitrage is generally not feasible. Therefore, arbitrage traders usually use cross-contract arbitrage.
Applied to TRB, this means: going long on the Binance TRB USDT contract and going short on the OKX TRB USDT contract.
Why do this? It's to profit from the funding rate settled every 4 hours:
Binance funding rate of -2% (settled every 4 hours) = -8%
OKX funding rate of -1.5% (settled every 8 hours) = -1.5%
So let's calculate the profit, 8-hour profit of 6.5%, and because it's arbitrage, there's both long and short positions, so it should be relatively safe. Therefore, many arbitrage traders saw this trading opportunity last night and went to do arbitrage.
But arbitrage also has risks, especially cross-exchange arbitrage. The core risk point is that exchanges may suspend withdrawals, and then the price difference between the two coins is out of control. Another risk is that if one side is pushed too hard, it can explode, becoming one-sided. If the position is quickly closed after the explosion, the loss won't be particularly large, but if the position is left one-sided after the explosion, it will create one-sided risk.
Then we saw the price of over $700 on OKX, because OKX has shallow liquidity, and the arbitrage traders were shorting on OKX, leading to a chain of liquidations, ultimately causing the OKX price of over $700 in the futures contract due to the arbitrage traders' chain liquidations.
Of course, there's also the kind of arbitrage that exploits price differences, which can be very profitable if done well.
Arbitrage traders are important participants in the market, but improper risk management can lead to major problems. But last night's TRB was a nightmare for arbitrage traders, and many people were liquidated. So when trading, it's important to pay attention to risk control, set strict stop-loss orders, and not let small losses turn into major disasters. At the same time, if last night you could combine main large orders with market maker trading, the gains would be very substantial.
Now, TRB has completed the process of selling off and dropping, and because there were so many liquidations, it's expected that there won't be a new market trend in the short term. Even if there is a new market trend, it will need to go through another round of accumulation and market washing.
Summary
The review of this round of TRB's bloodbath market trend is basically over. To summarize, if we want to make money in this wave, we need to fully utilize the following tools and methods:
- Identify strong market maker coins
- Identify abnormal funding rates, LSUR, and position size
- Combine main large orders (or large transactions) for main capital analysis
- Set strict stop-loss orders
Combining main large orders is the best choice for grasping the market maker's capital control. Whether buying or selling, it ultimately needs to be reflected in the market, and as long as there are orders and transactions, we can monitor them, so everyone must use these tools well!
免责声明:本文章仅代表作者个人观点,不代表本平台的立场和观点。本文章仅供信息分享,不构成对任何人的任何投资建议。用户与作者之间的任何争议,与本平台无关。如网页中刊载的文章或图片涉及侵权,请提供相关的权利证明和身份证明发送邮件到support@aicoin.com,本平台相关工作人员将会进行核查。


