1. Understanding Inscriptions
The first step is to open the AICoin PC client homepage as shown in the picture.
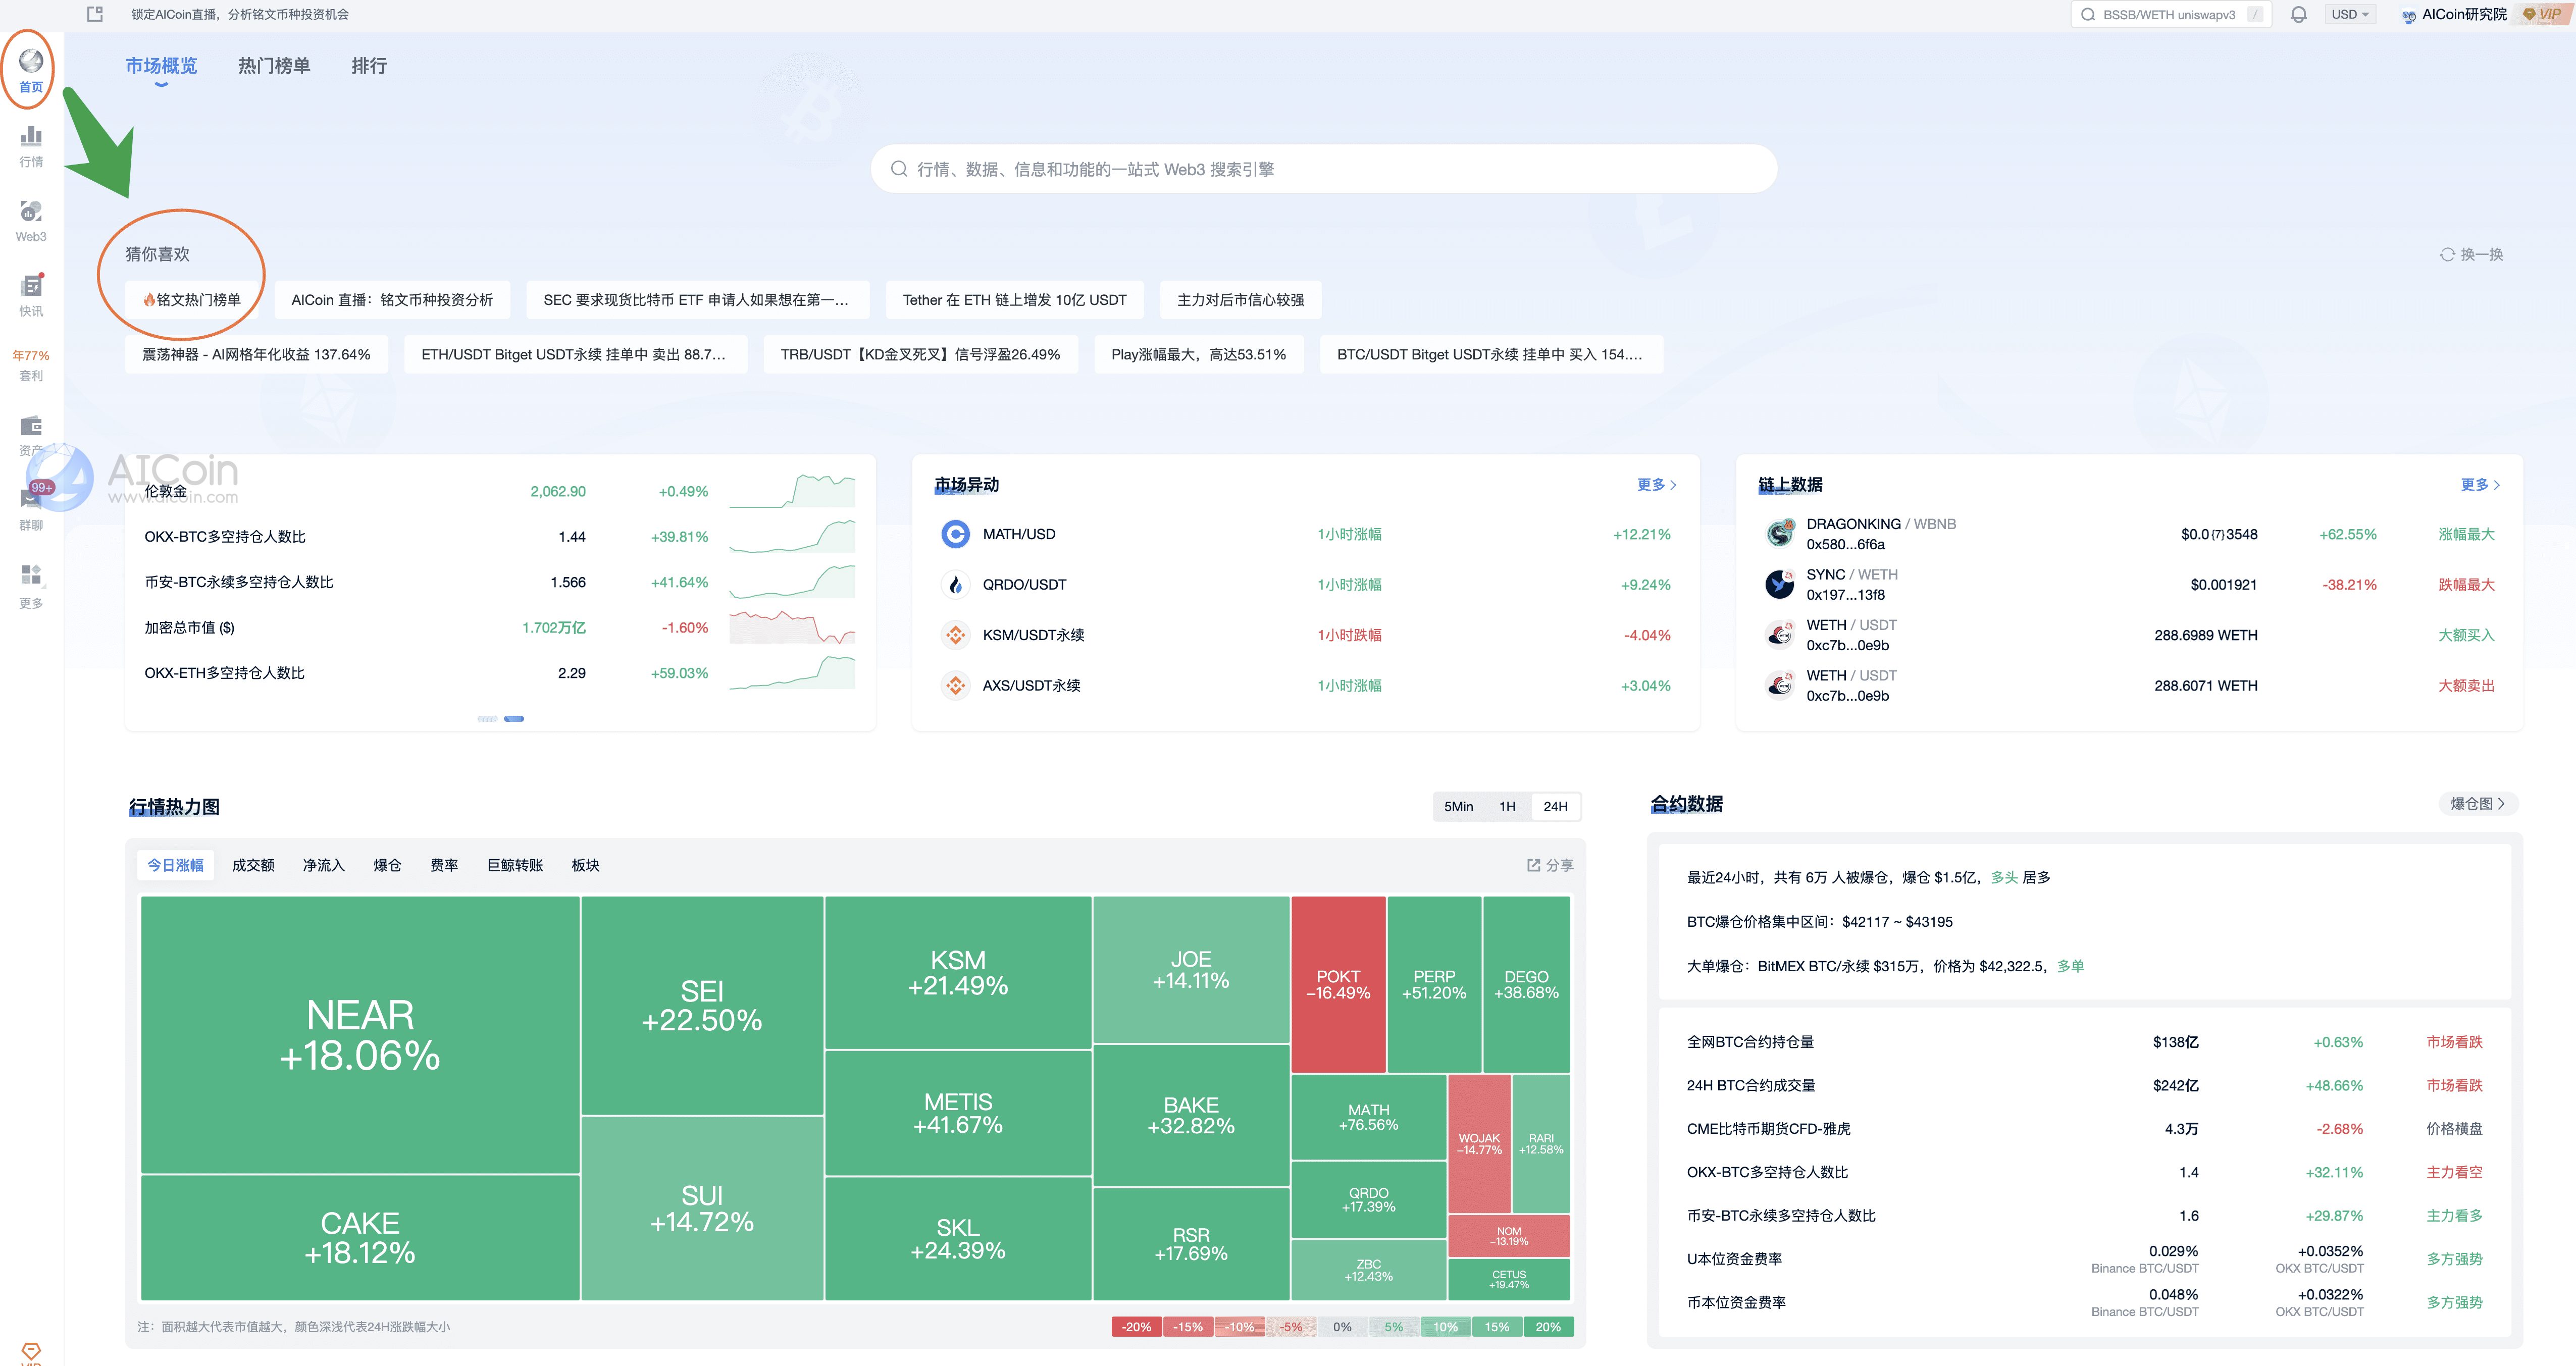
Then click on the Inscription Popular List in the position shown in the picture, and pay attention to what inscriptions are and how to buy and sell them.
Friendly reminder: I would like to remind everyone of a risk point. Inscriptions have a relatively high risk, but the returns are also very good. The 24-hour increase can reach 500%.
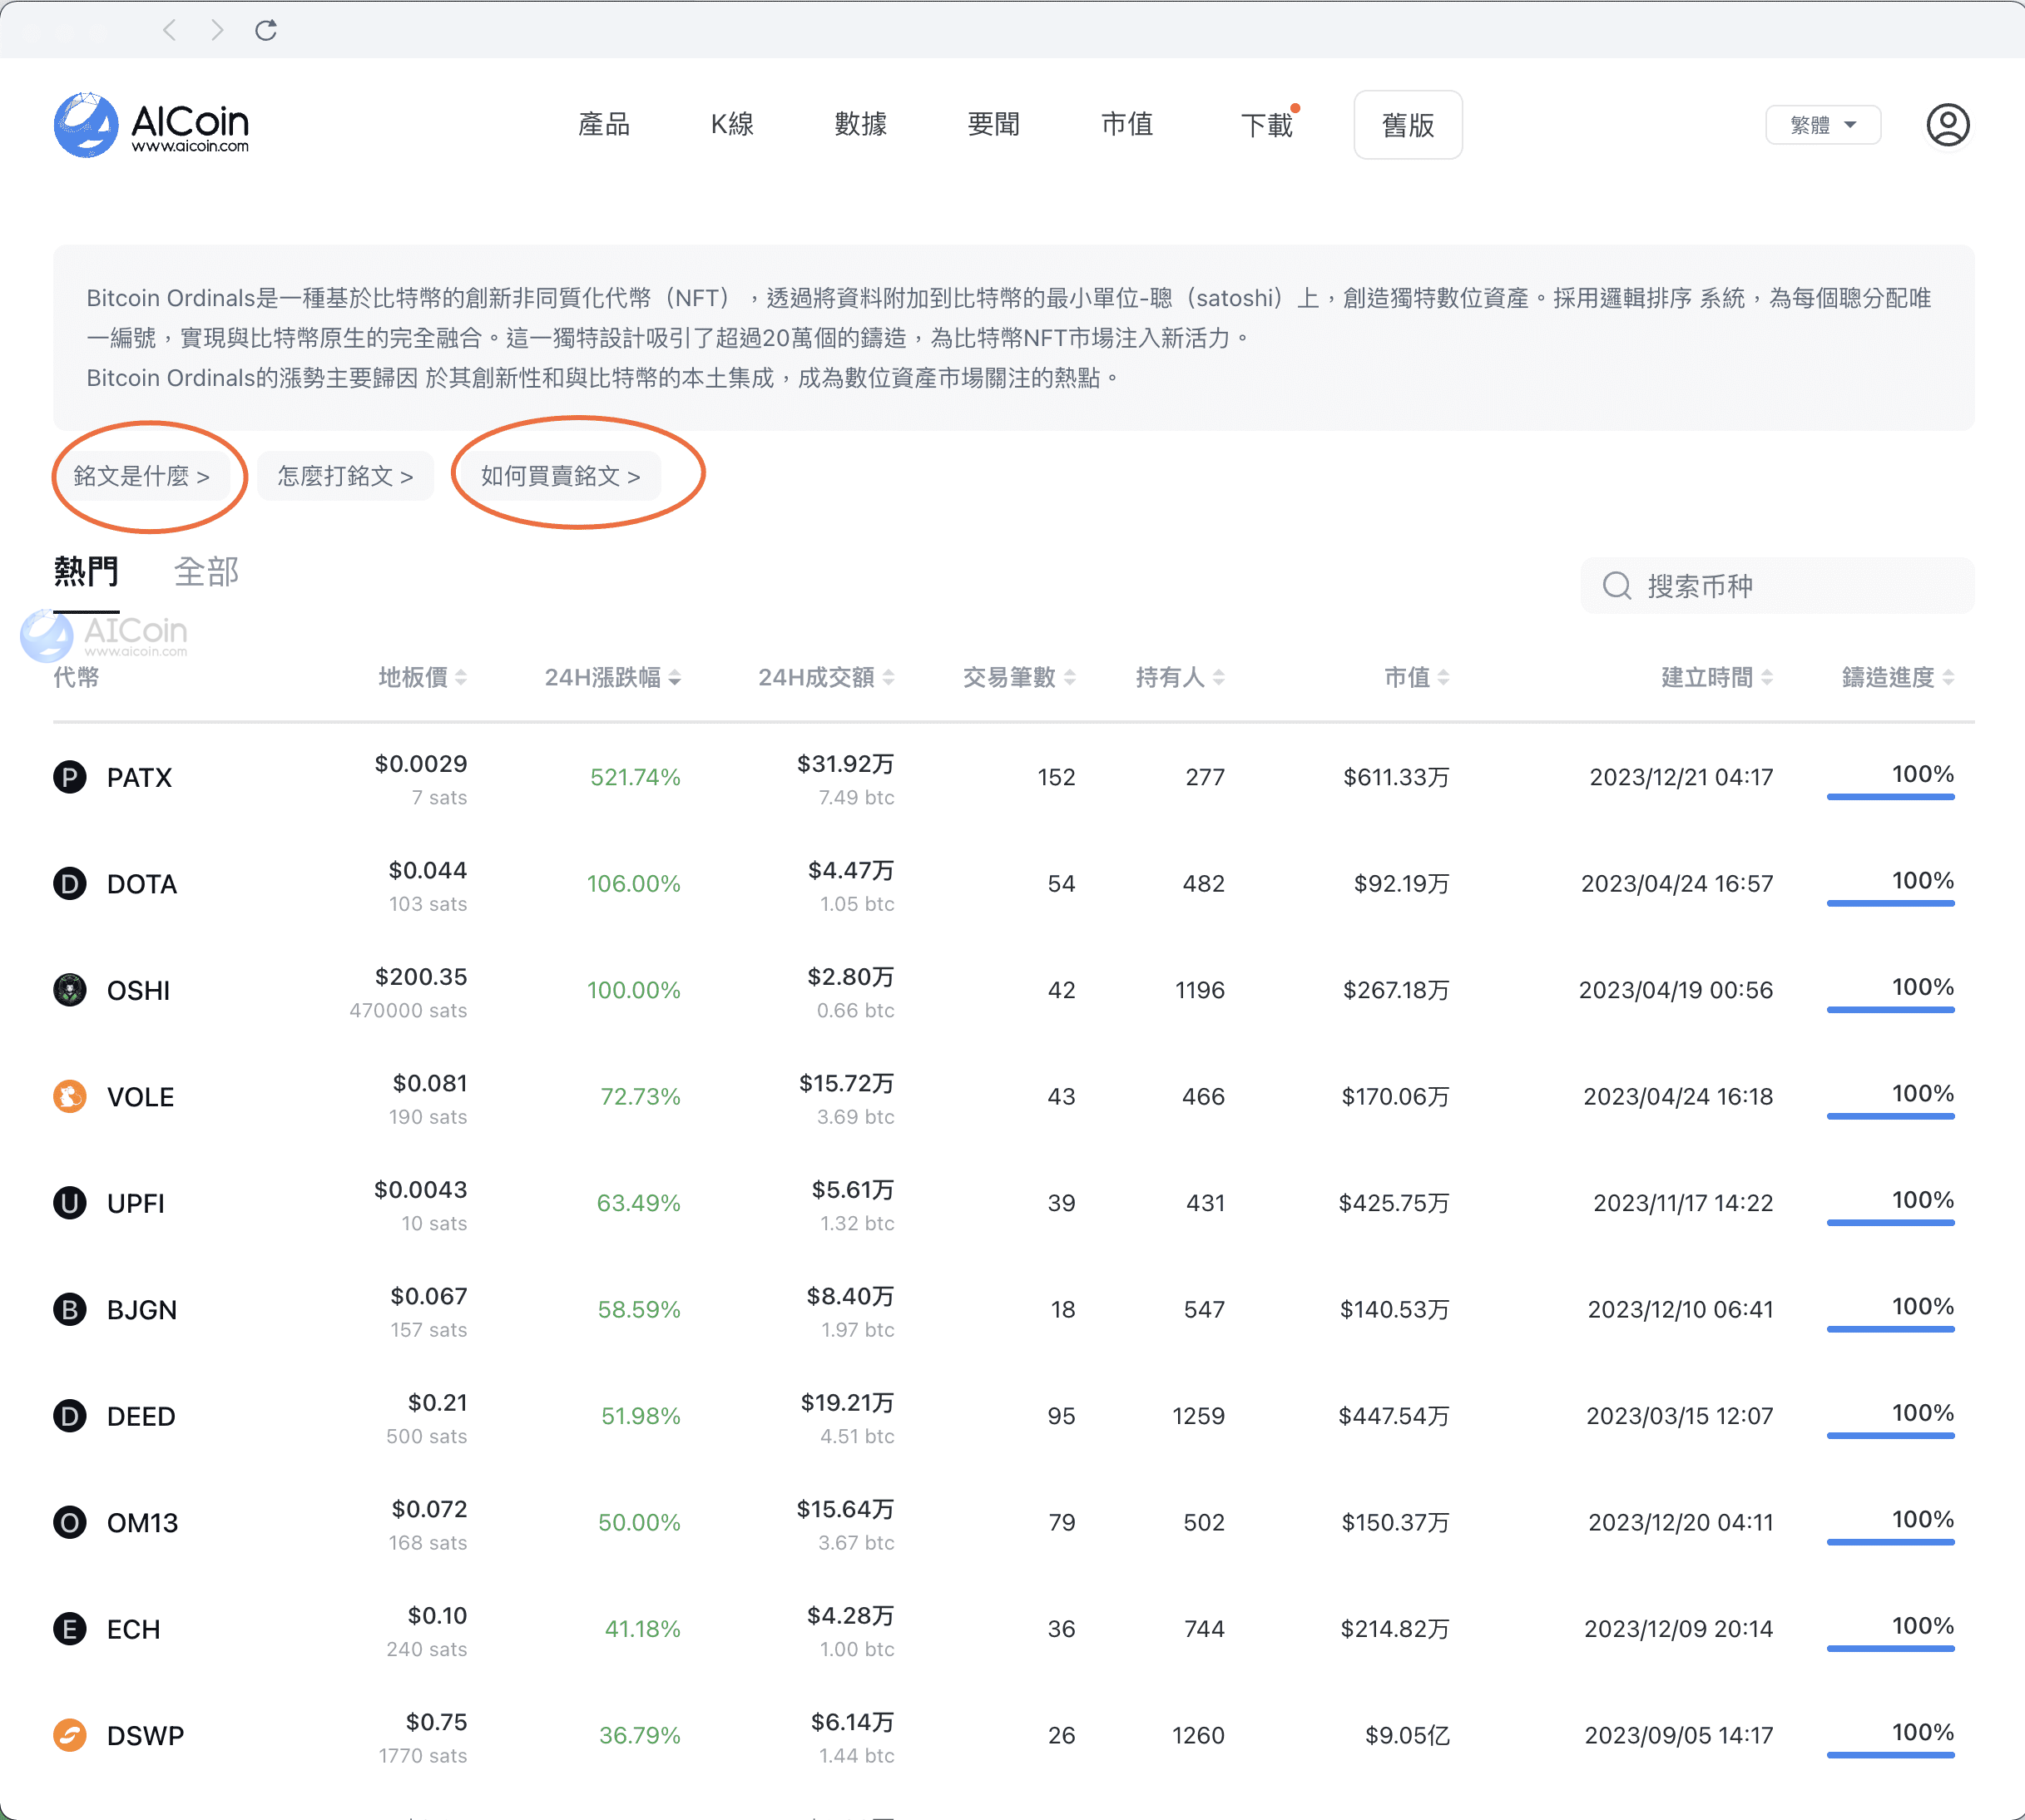
The floor price in the picture refers to the lowest selling price of the inscription, which reflects the supply and demand and value of the inscription.
Specific usage of the floor price:
If the floor price rises, it means that the demand for inscriptions is greater than the supply, and the value of the inscription increases.
If the floor price falls, it means that the supply of inscriptions is greater than the demand, and the value of the inscription decreases.
2. Tokens in the Inscription Section
Click to open the section as shown in the picture.
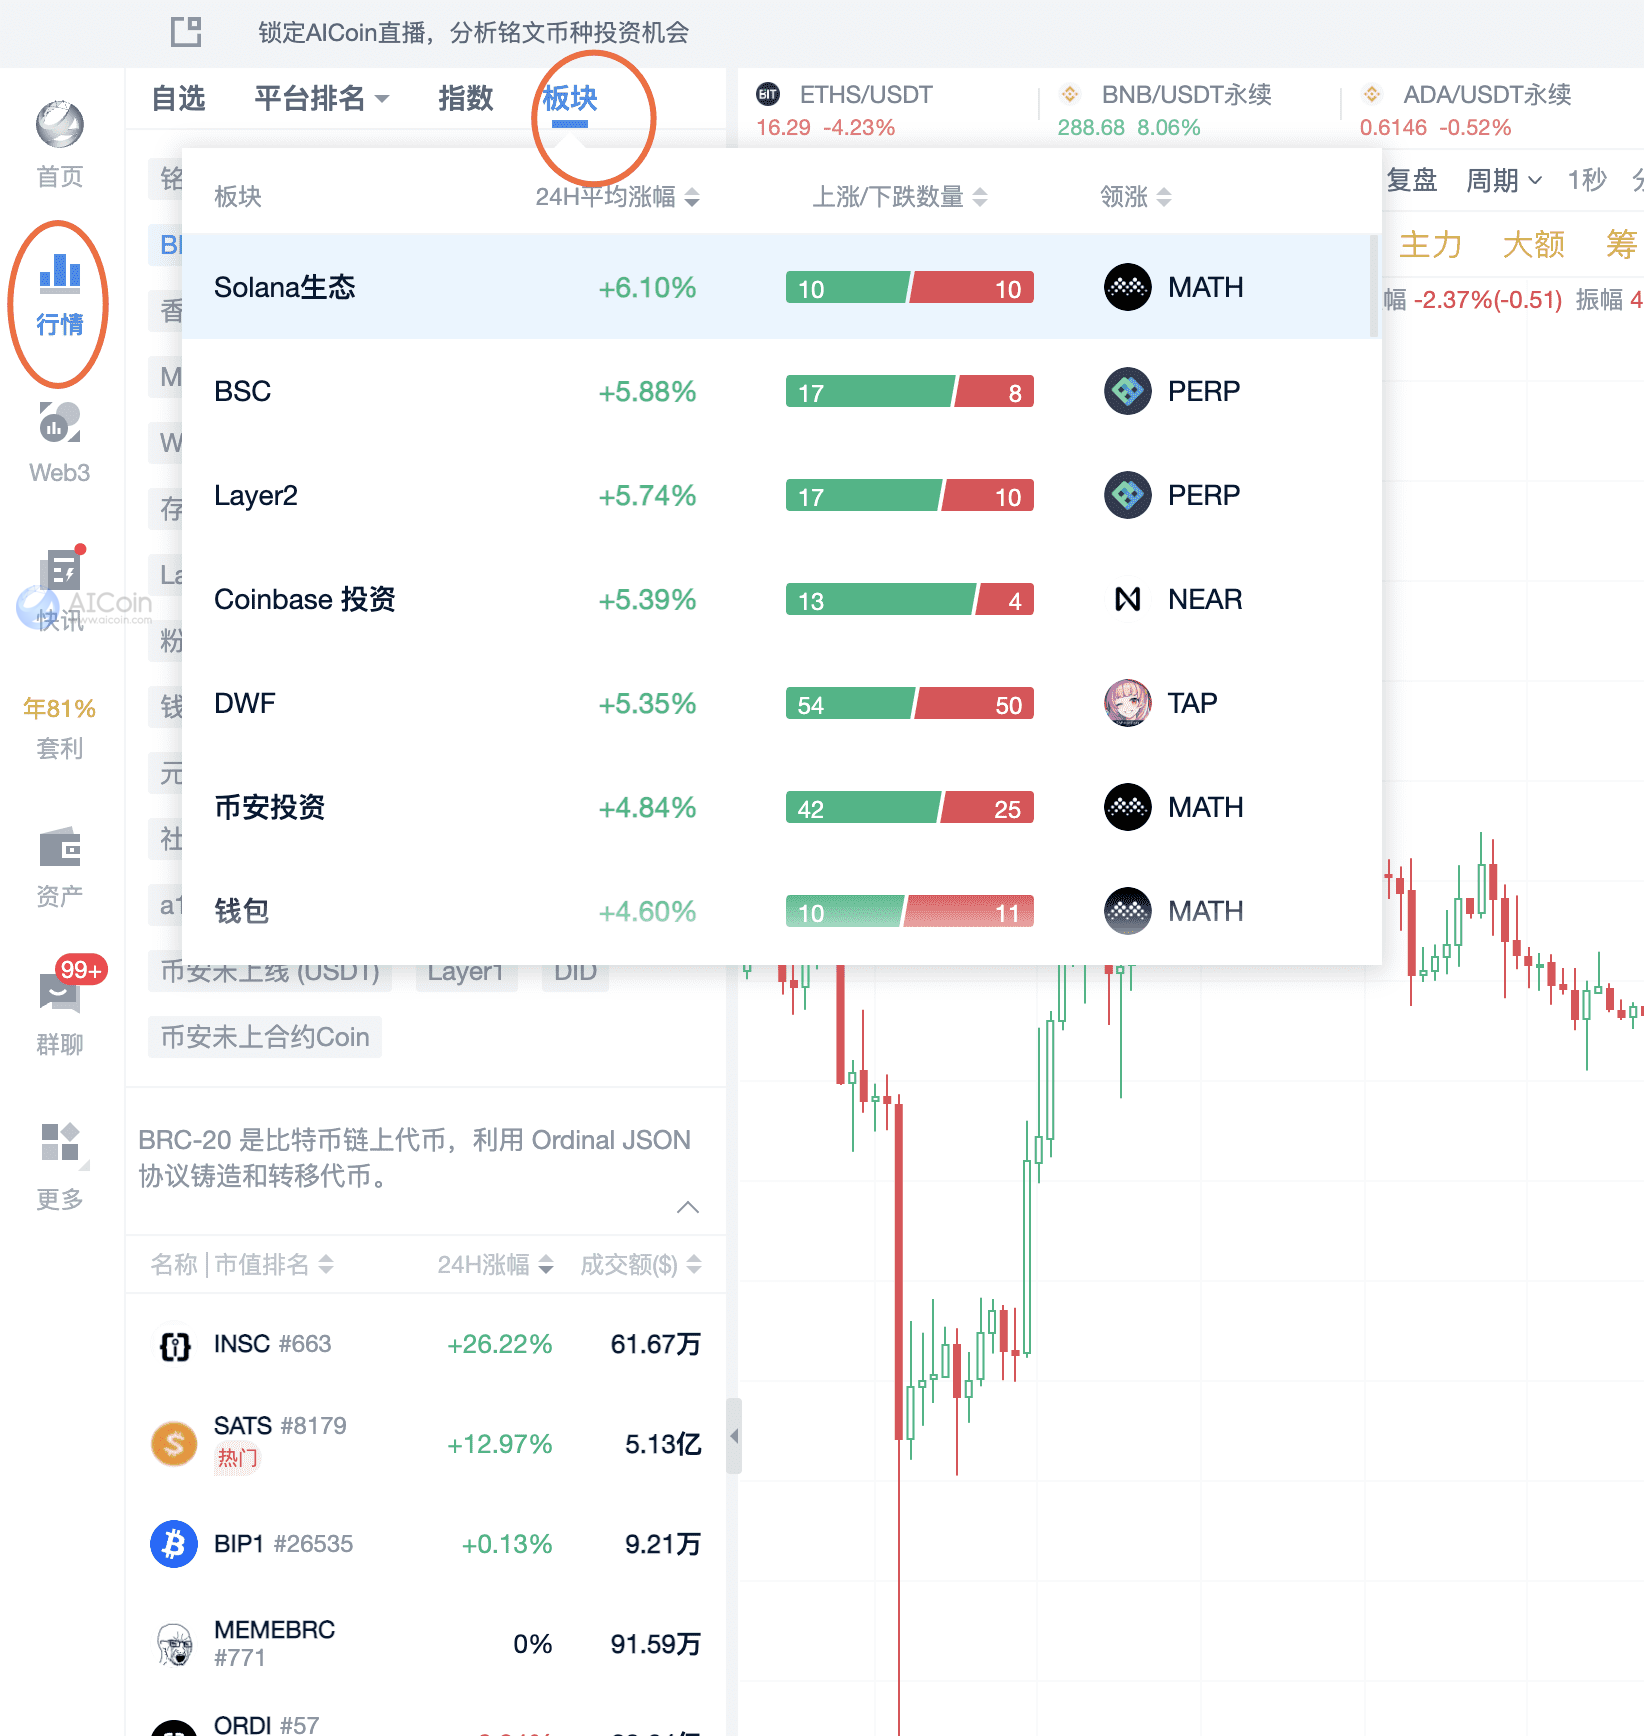
Pay attention to the leading tokens in the SOL ecosystem, inscriptions, and BRC20 in these three sections.
SOL
SATS
ORDI
ATOM
RATS
SHIB
3. Inscription Token Investment Analysis
Portfolio Strategy:
Indicator Selection: EMA + MACD
EMA parameters to consider: 24, 52;
MACD parameters: 12, 26, 9.
Assessing the trend
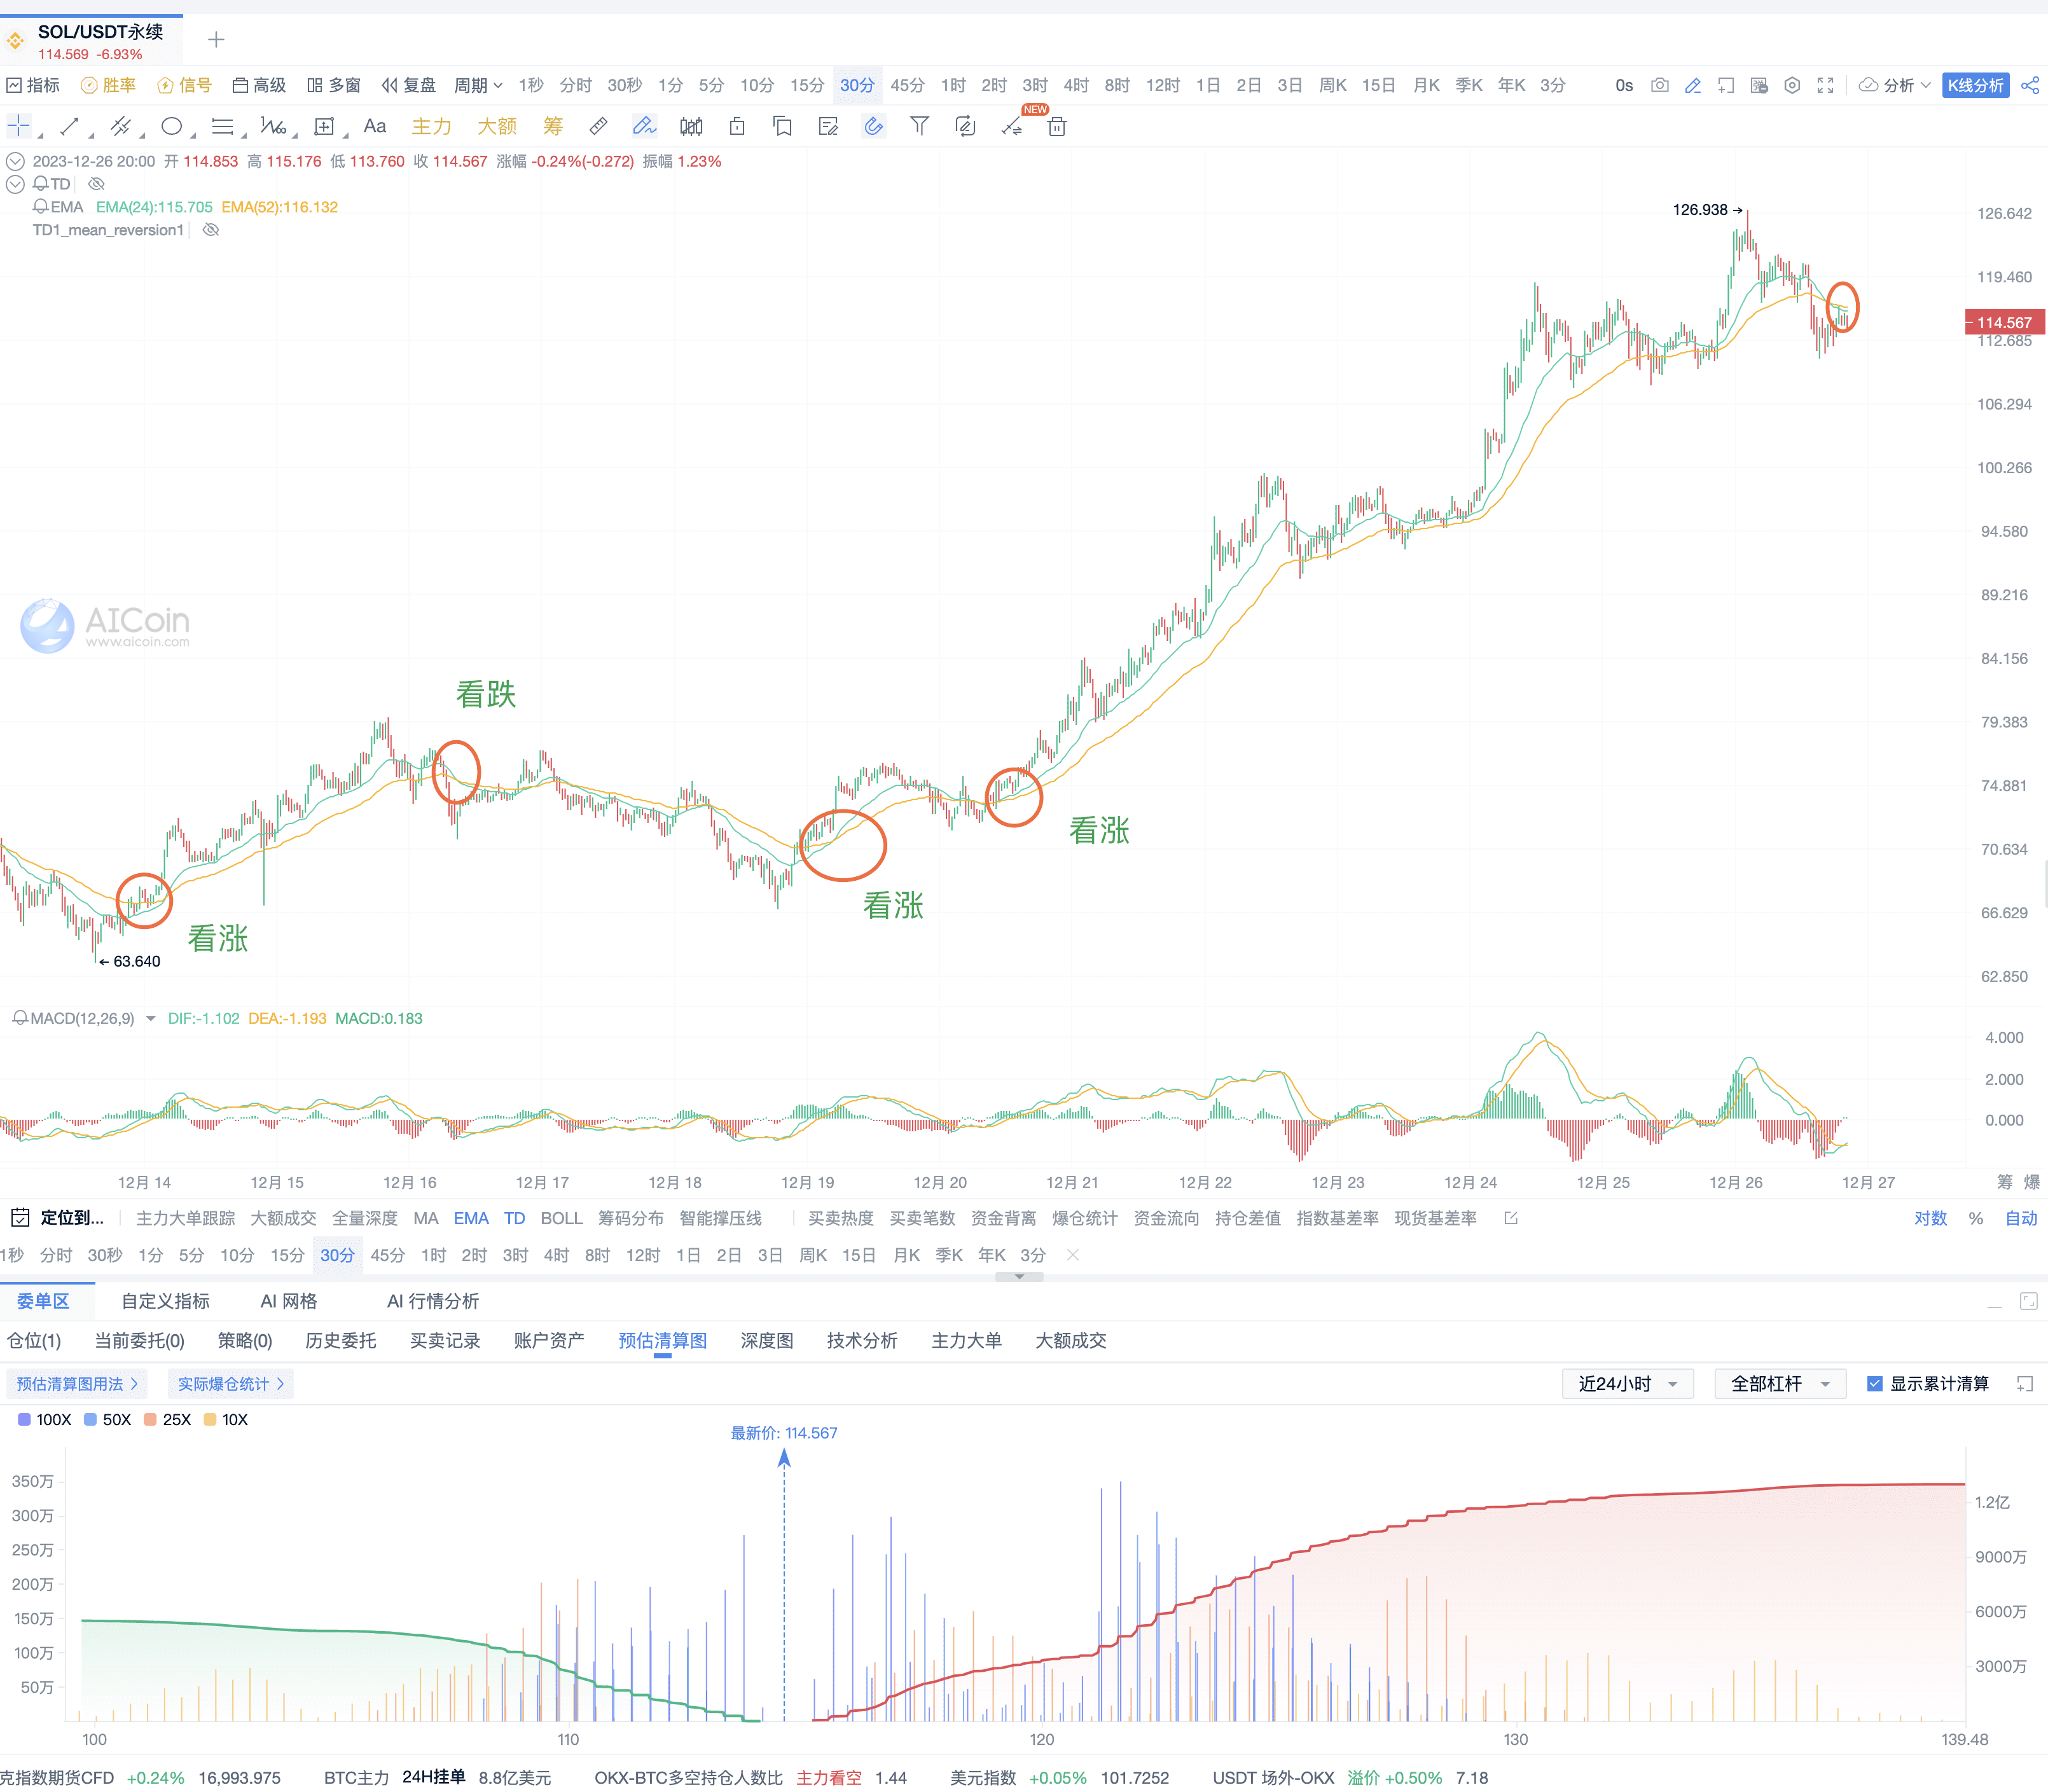
Open SOL/USDT on Binance USDT perpetual, and observe the use of the strategy combination.
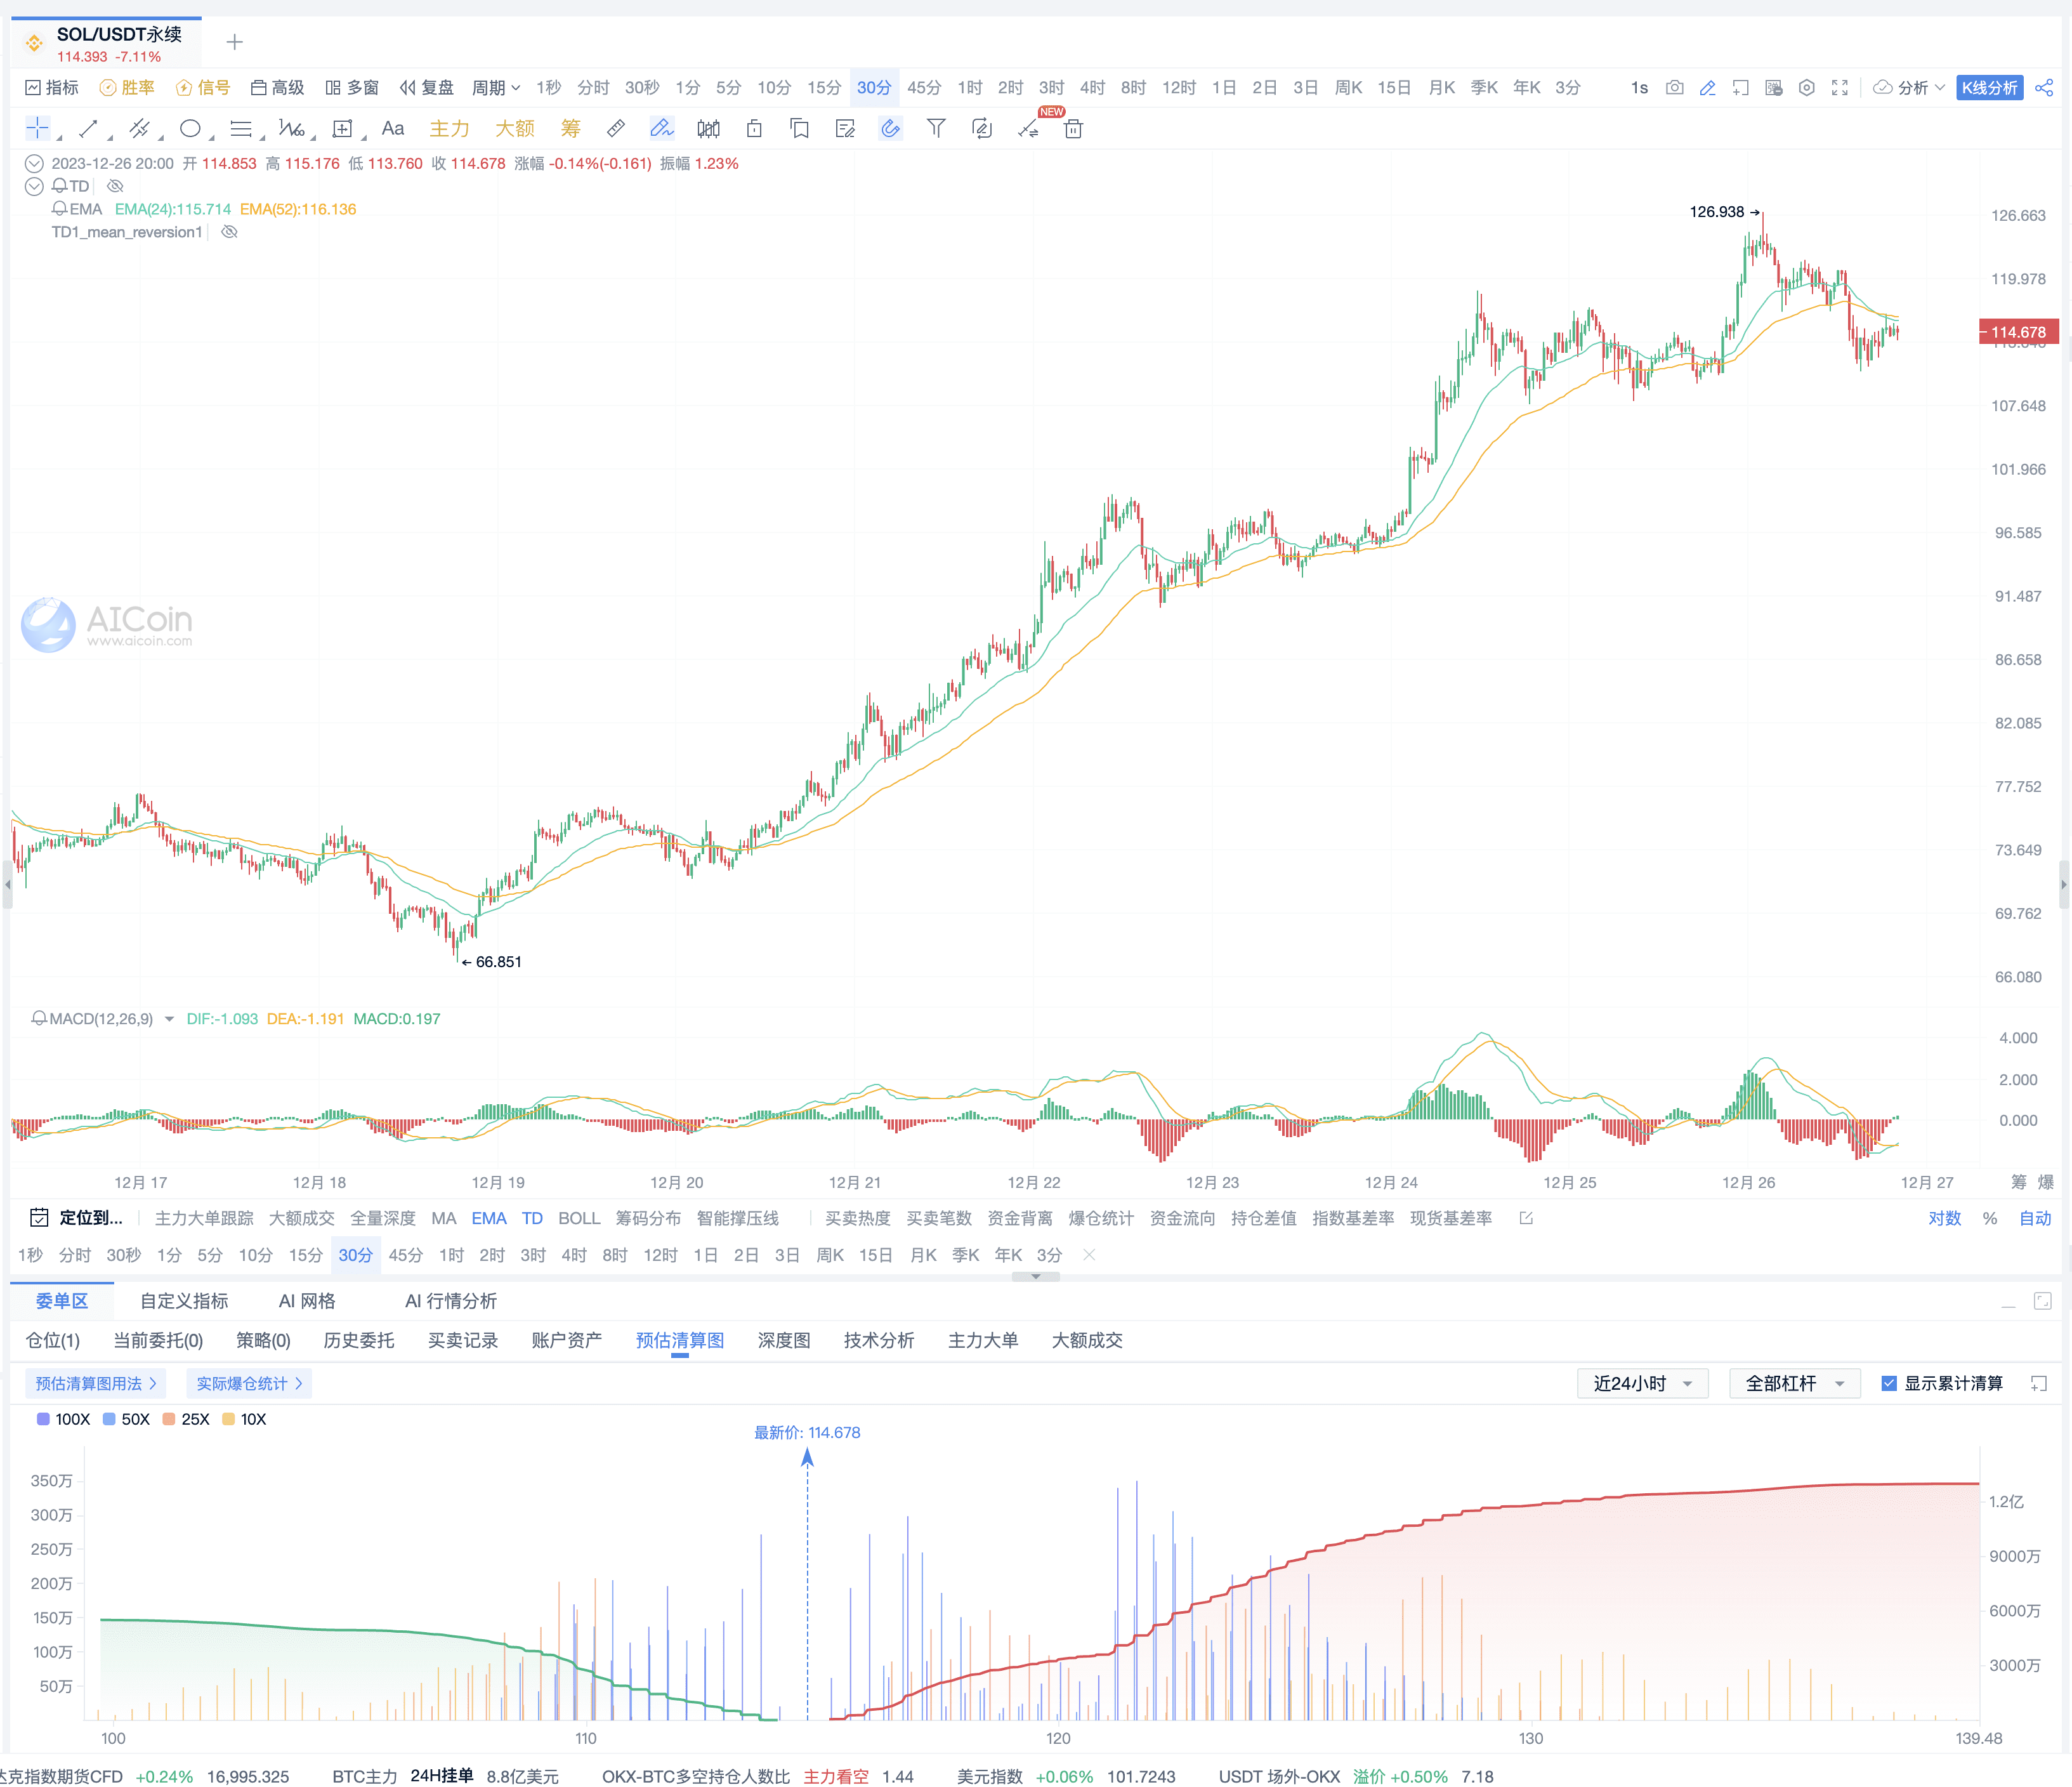
Taking the 30-minute cycle as an example; using EMA52 as a trend support and resistance line, if the price is above EMA52, it can be predicted as a bullish trend.
Confirming the trend, finding exit and entry points
MACD usage:
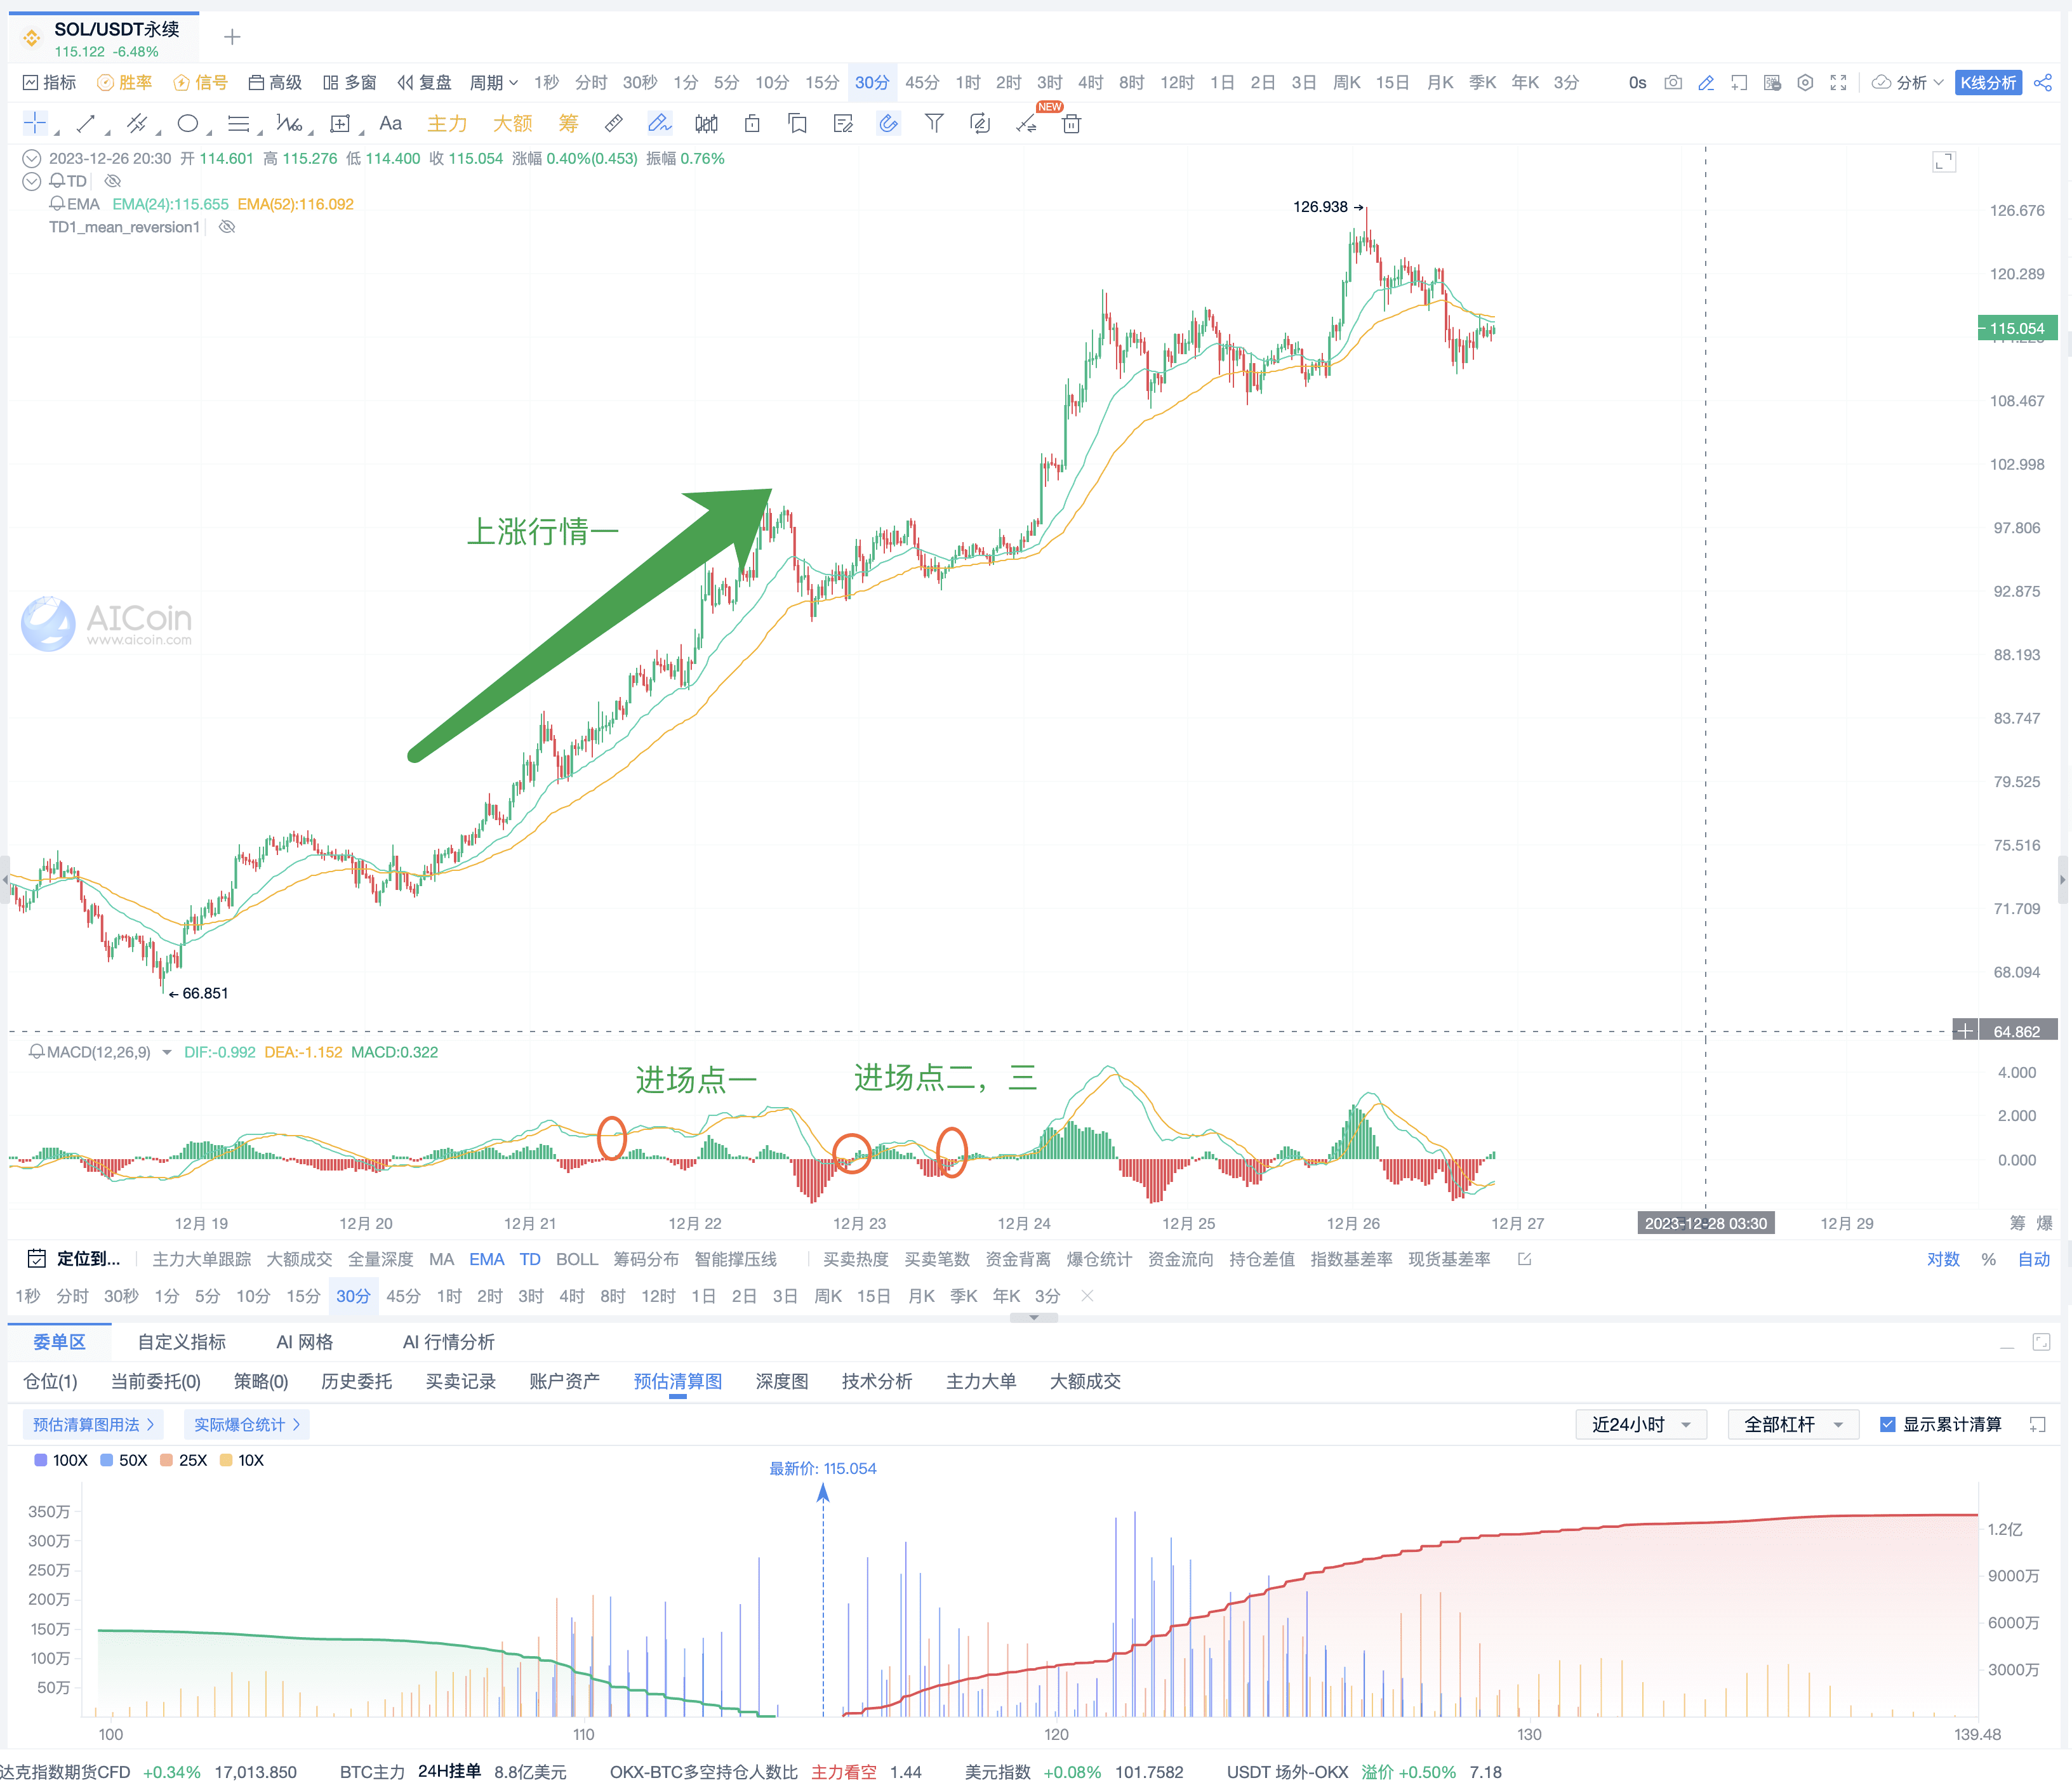
Pay attention to the rebound of MACD from the zero axis or the pressure of MACD rising above the zero axis.
If we look at it from EMA52, it is an uptrend, and we pay attention to the opportunity given by the MACD rebounding from the zero axis.
(1) For example, looking at SOL, the conditions met are:
EMA determines the uptrend or downtrend
MACD determines the entry position.
(2) Usage techniques for EMA24
The role of EMA24 includes:
1) If you want to exit
2) If you happen to see a trend and want to enter
Usage example:
For entry, you can consider the price just breaking through EMA52. When you are not sure enough, you can consider bottoming out at EMA24 breaking through EMA52; for exit, you can consider the price falling below EMA24 or EMA24 falling below EMA52.
Analysis of related currencies combined with strategies
SOL
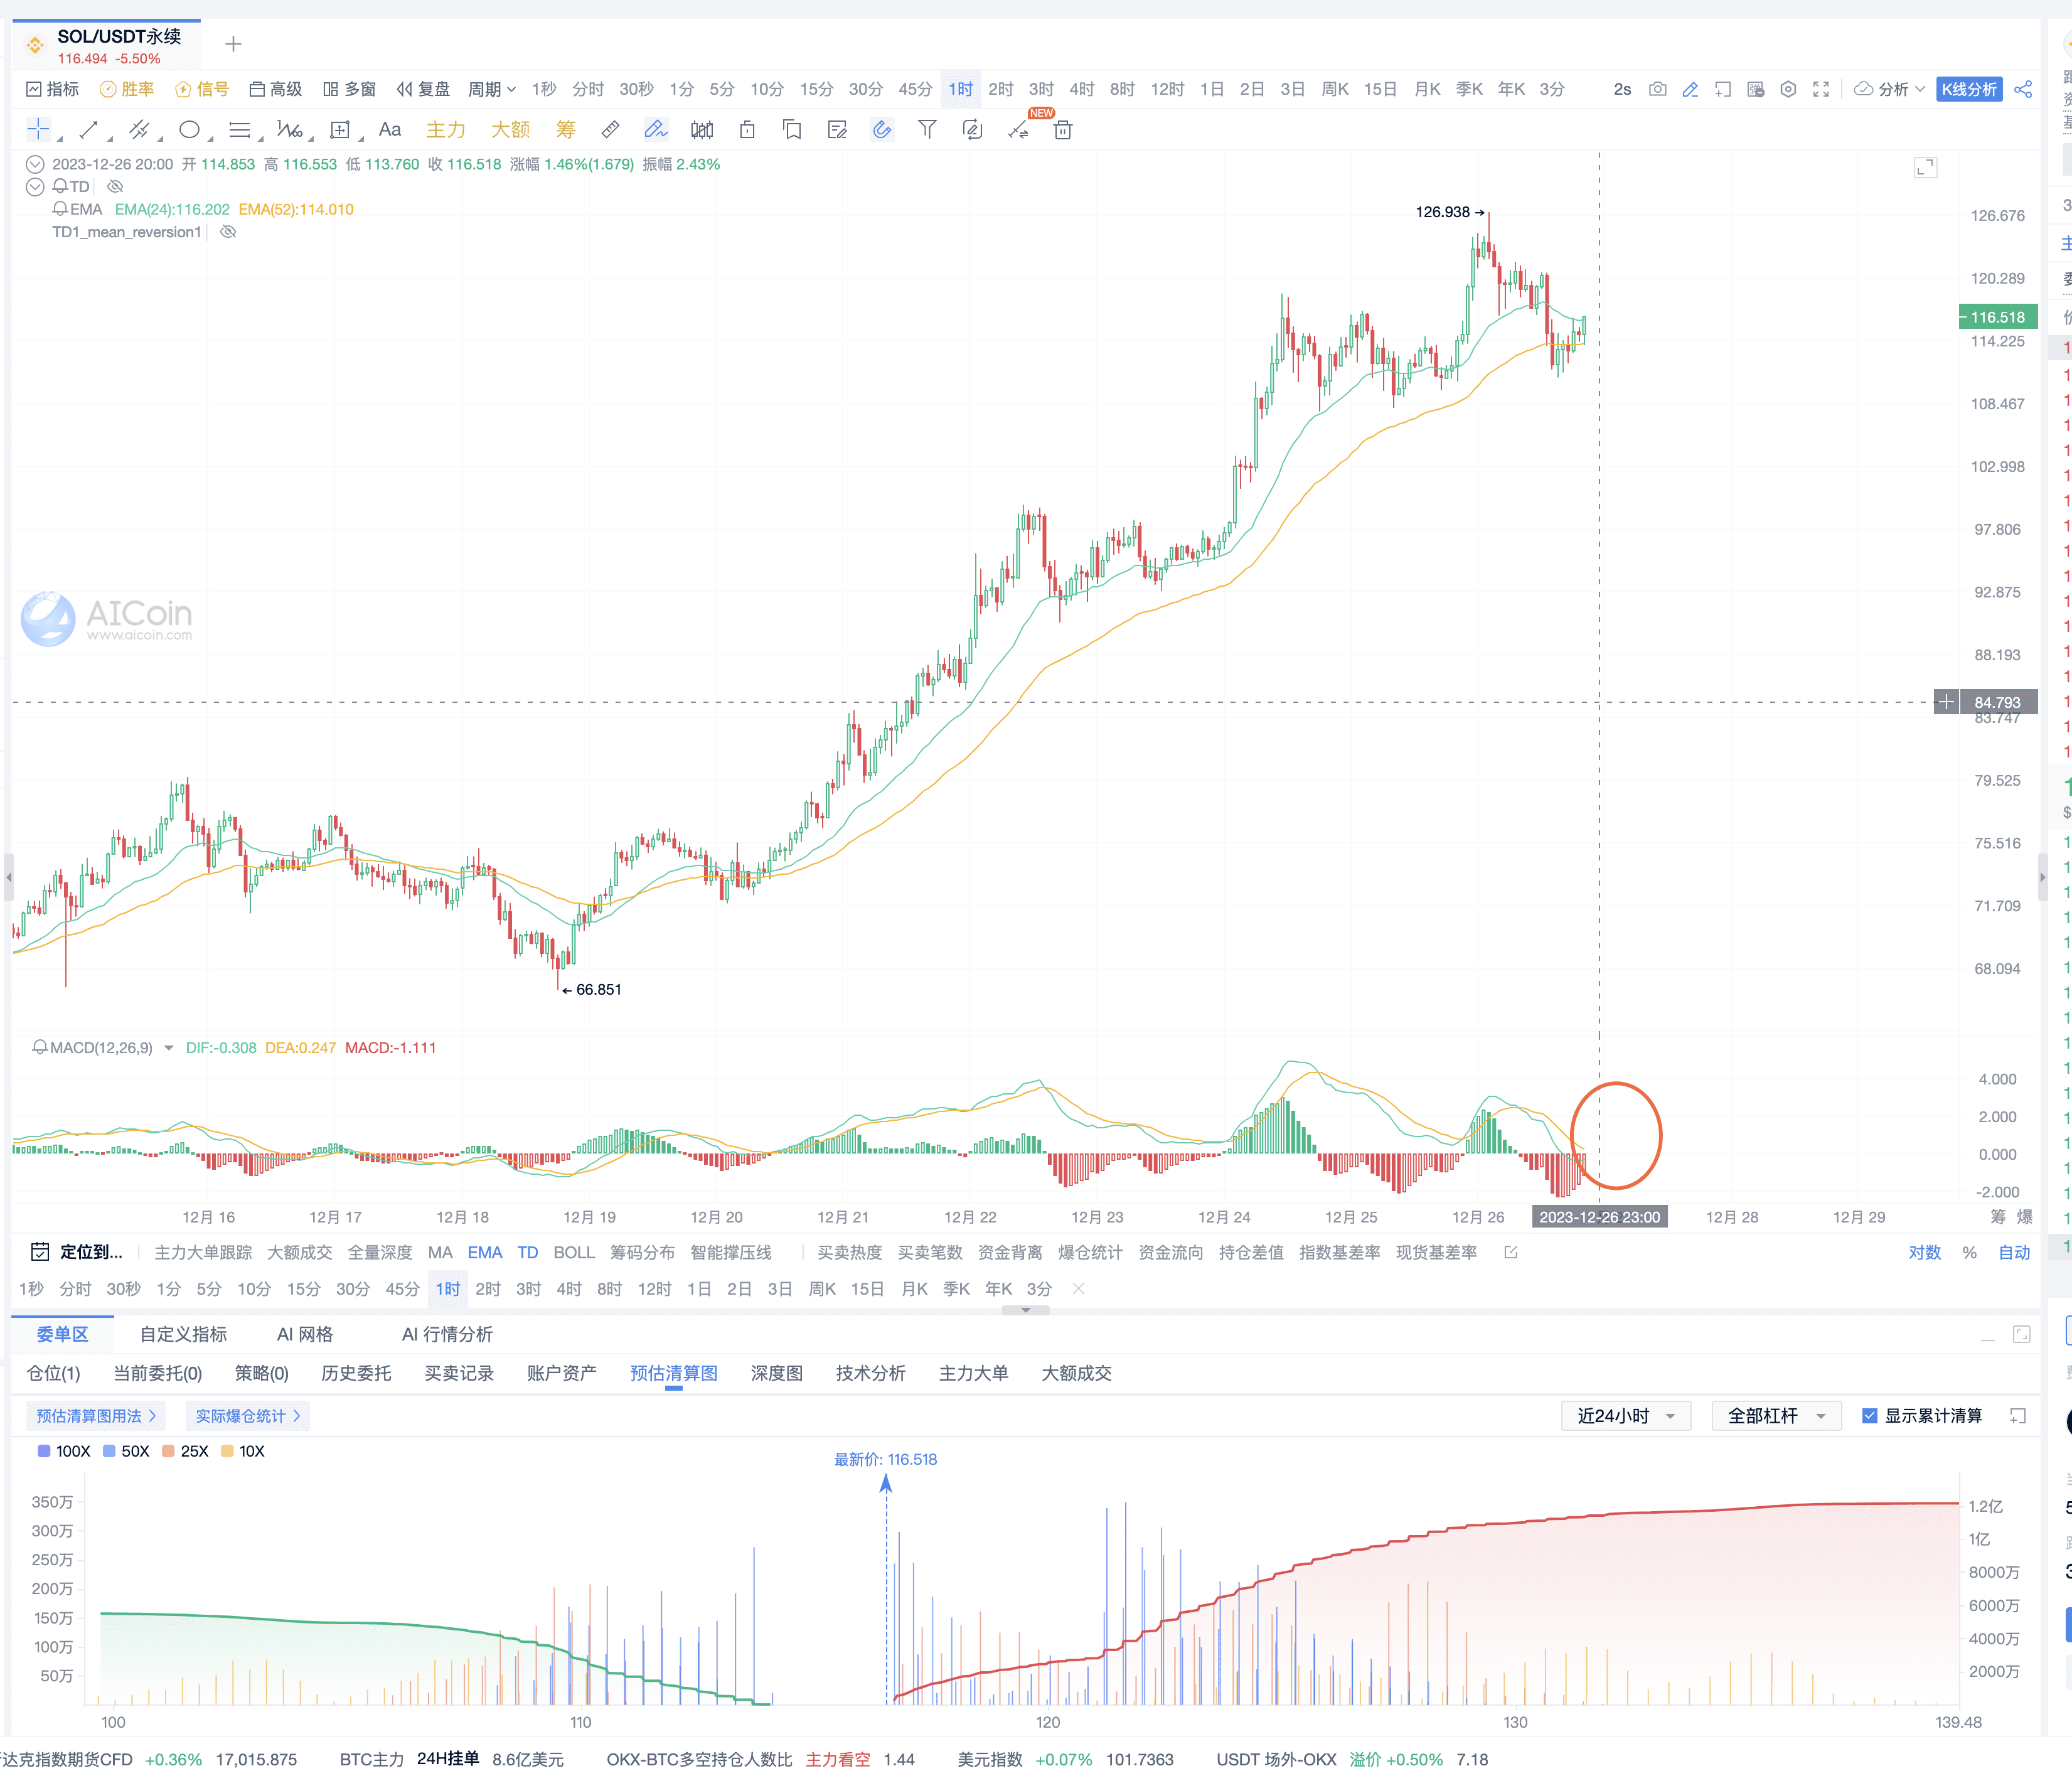
On the hourly cycle, the price has stabilized above EMA52 and is currently pulling back to the zero axis;
On the hourly cycle, SOL is a good buying point. Wait for a crossover of the MACD line here.
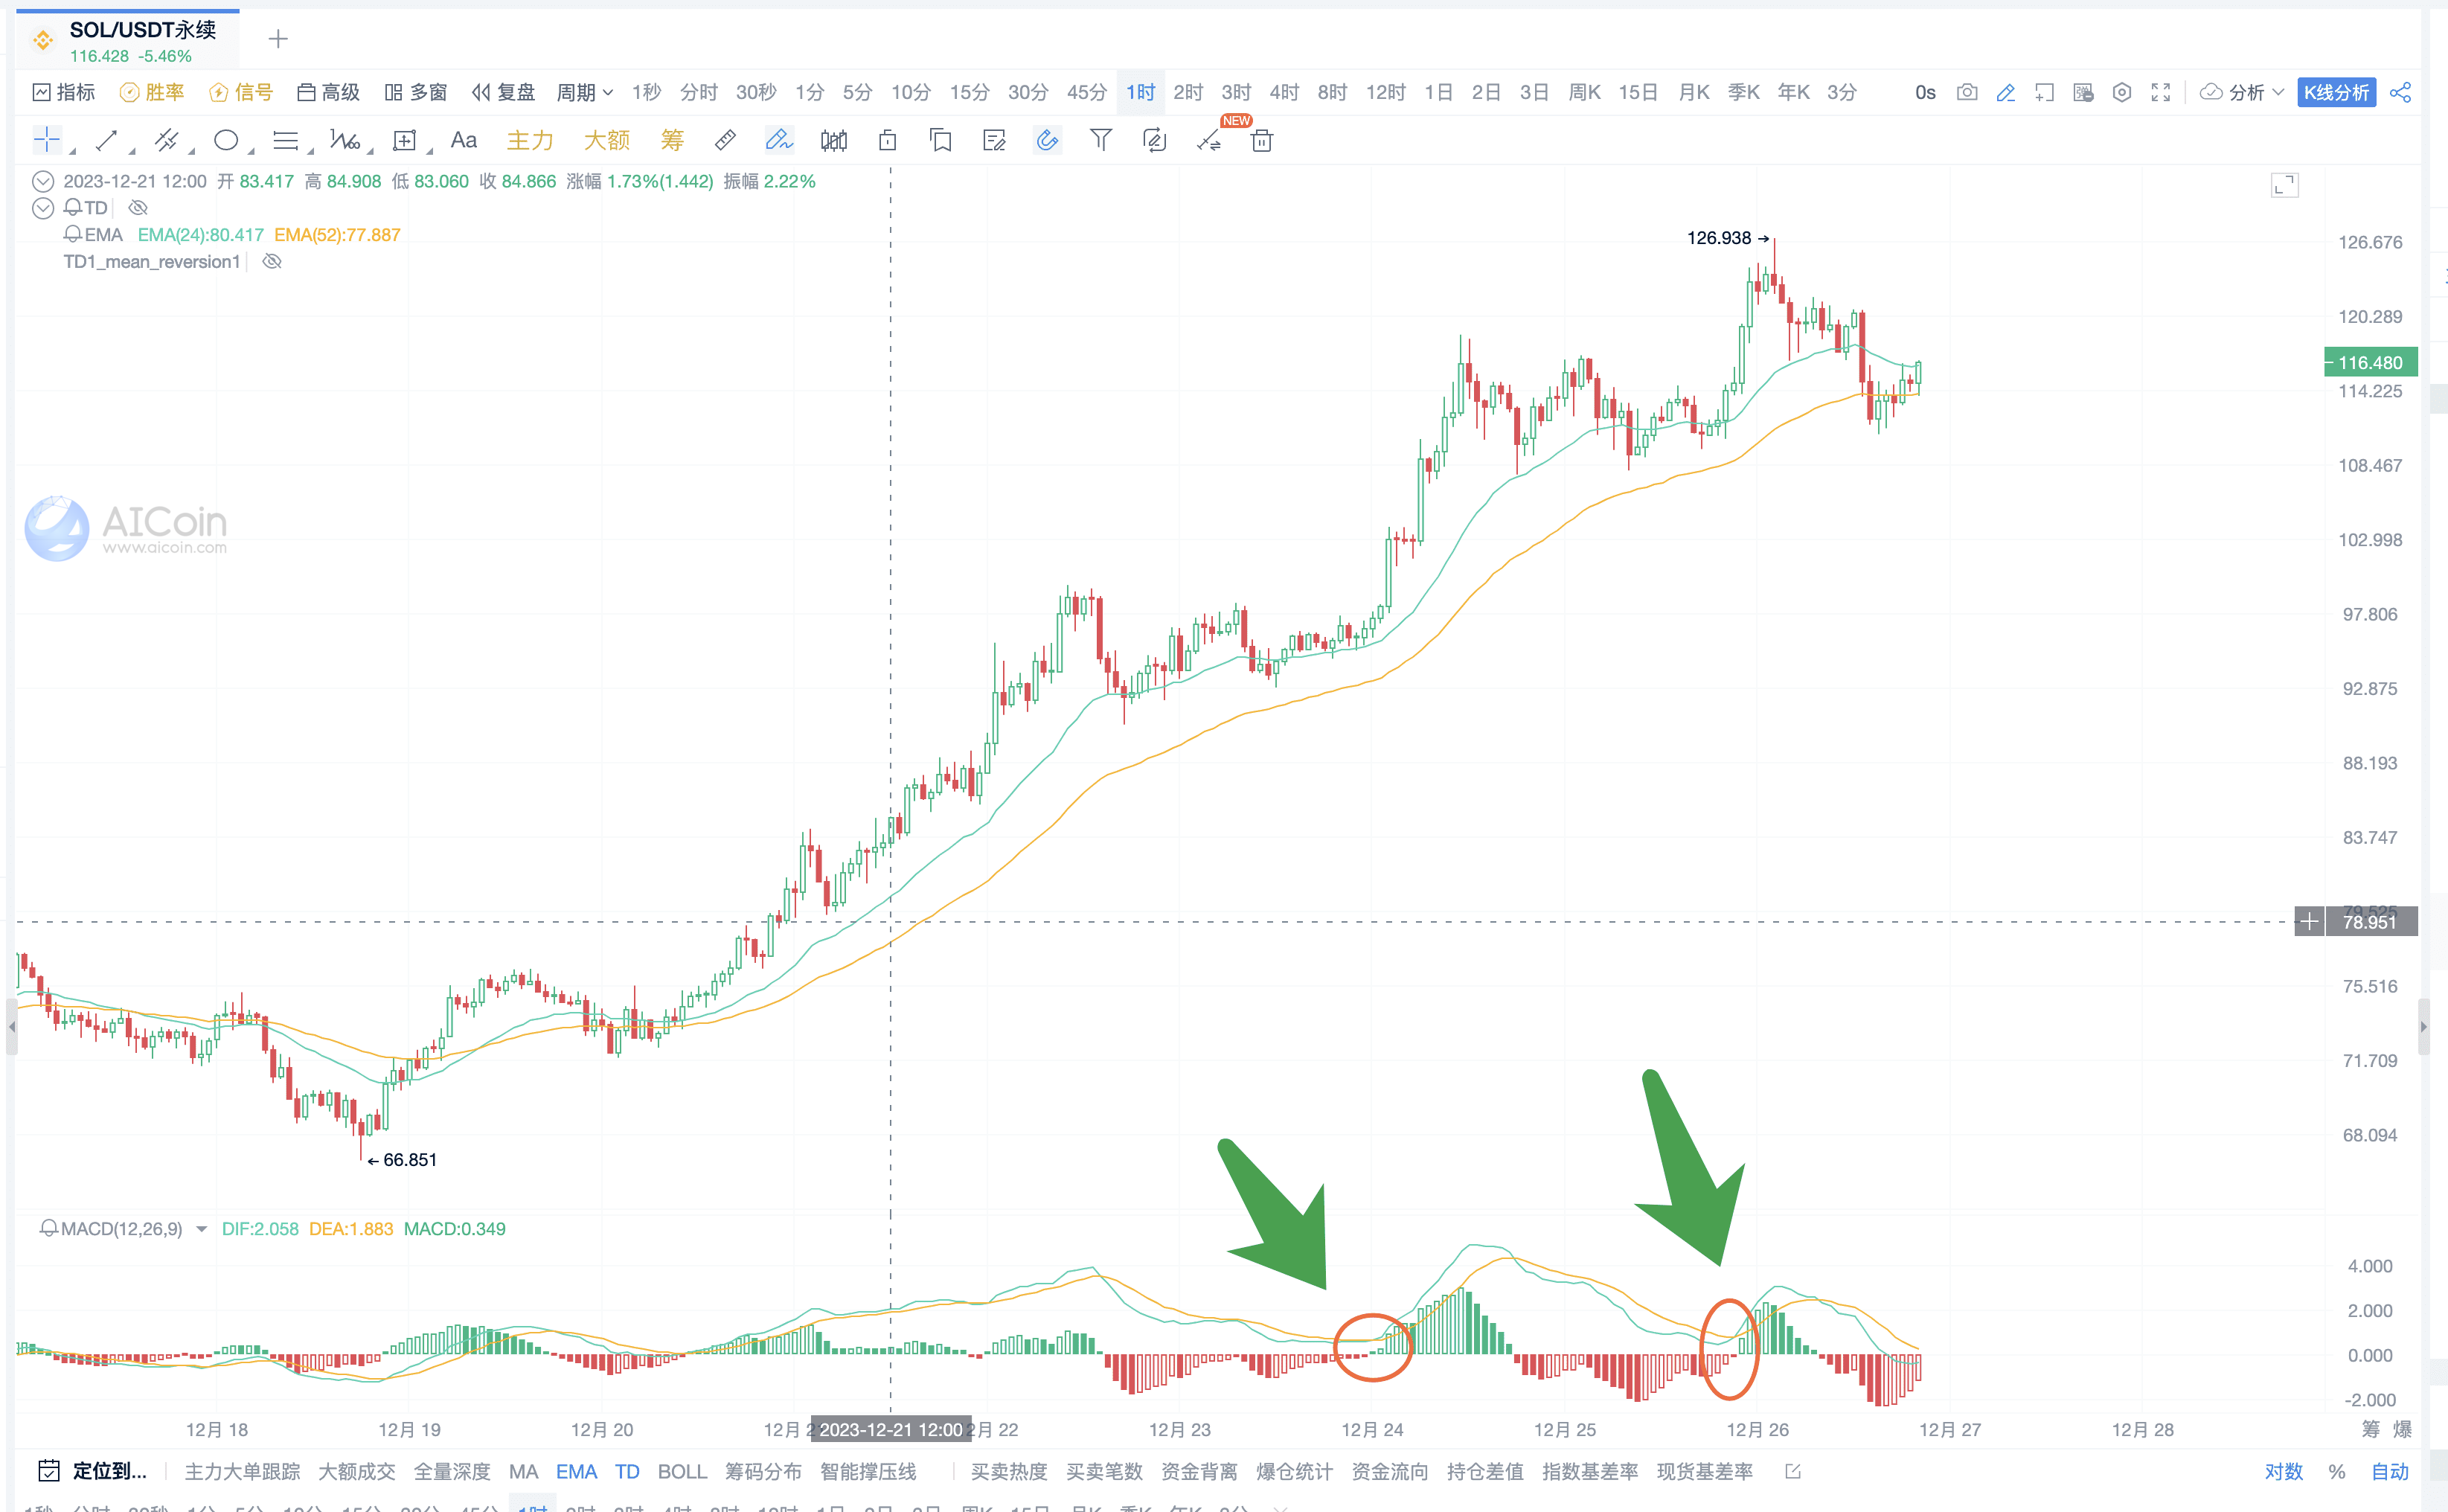
On the hourly cycle, SOL is a good trend continuation point, as shown in the two previous pullbacks to the zero axis in the following figure.
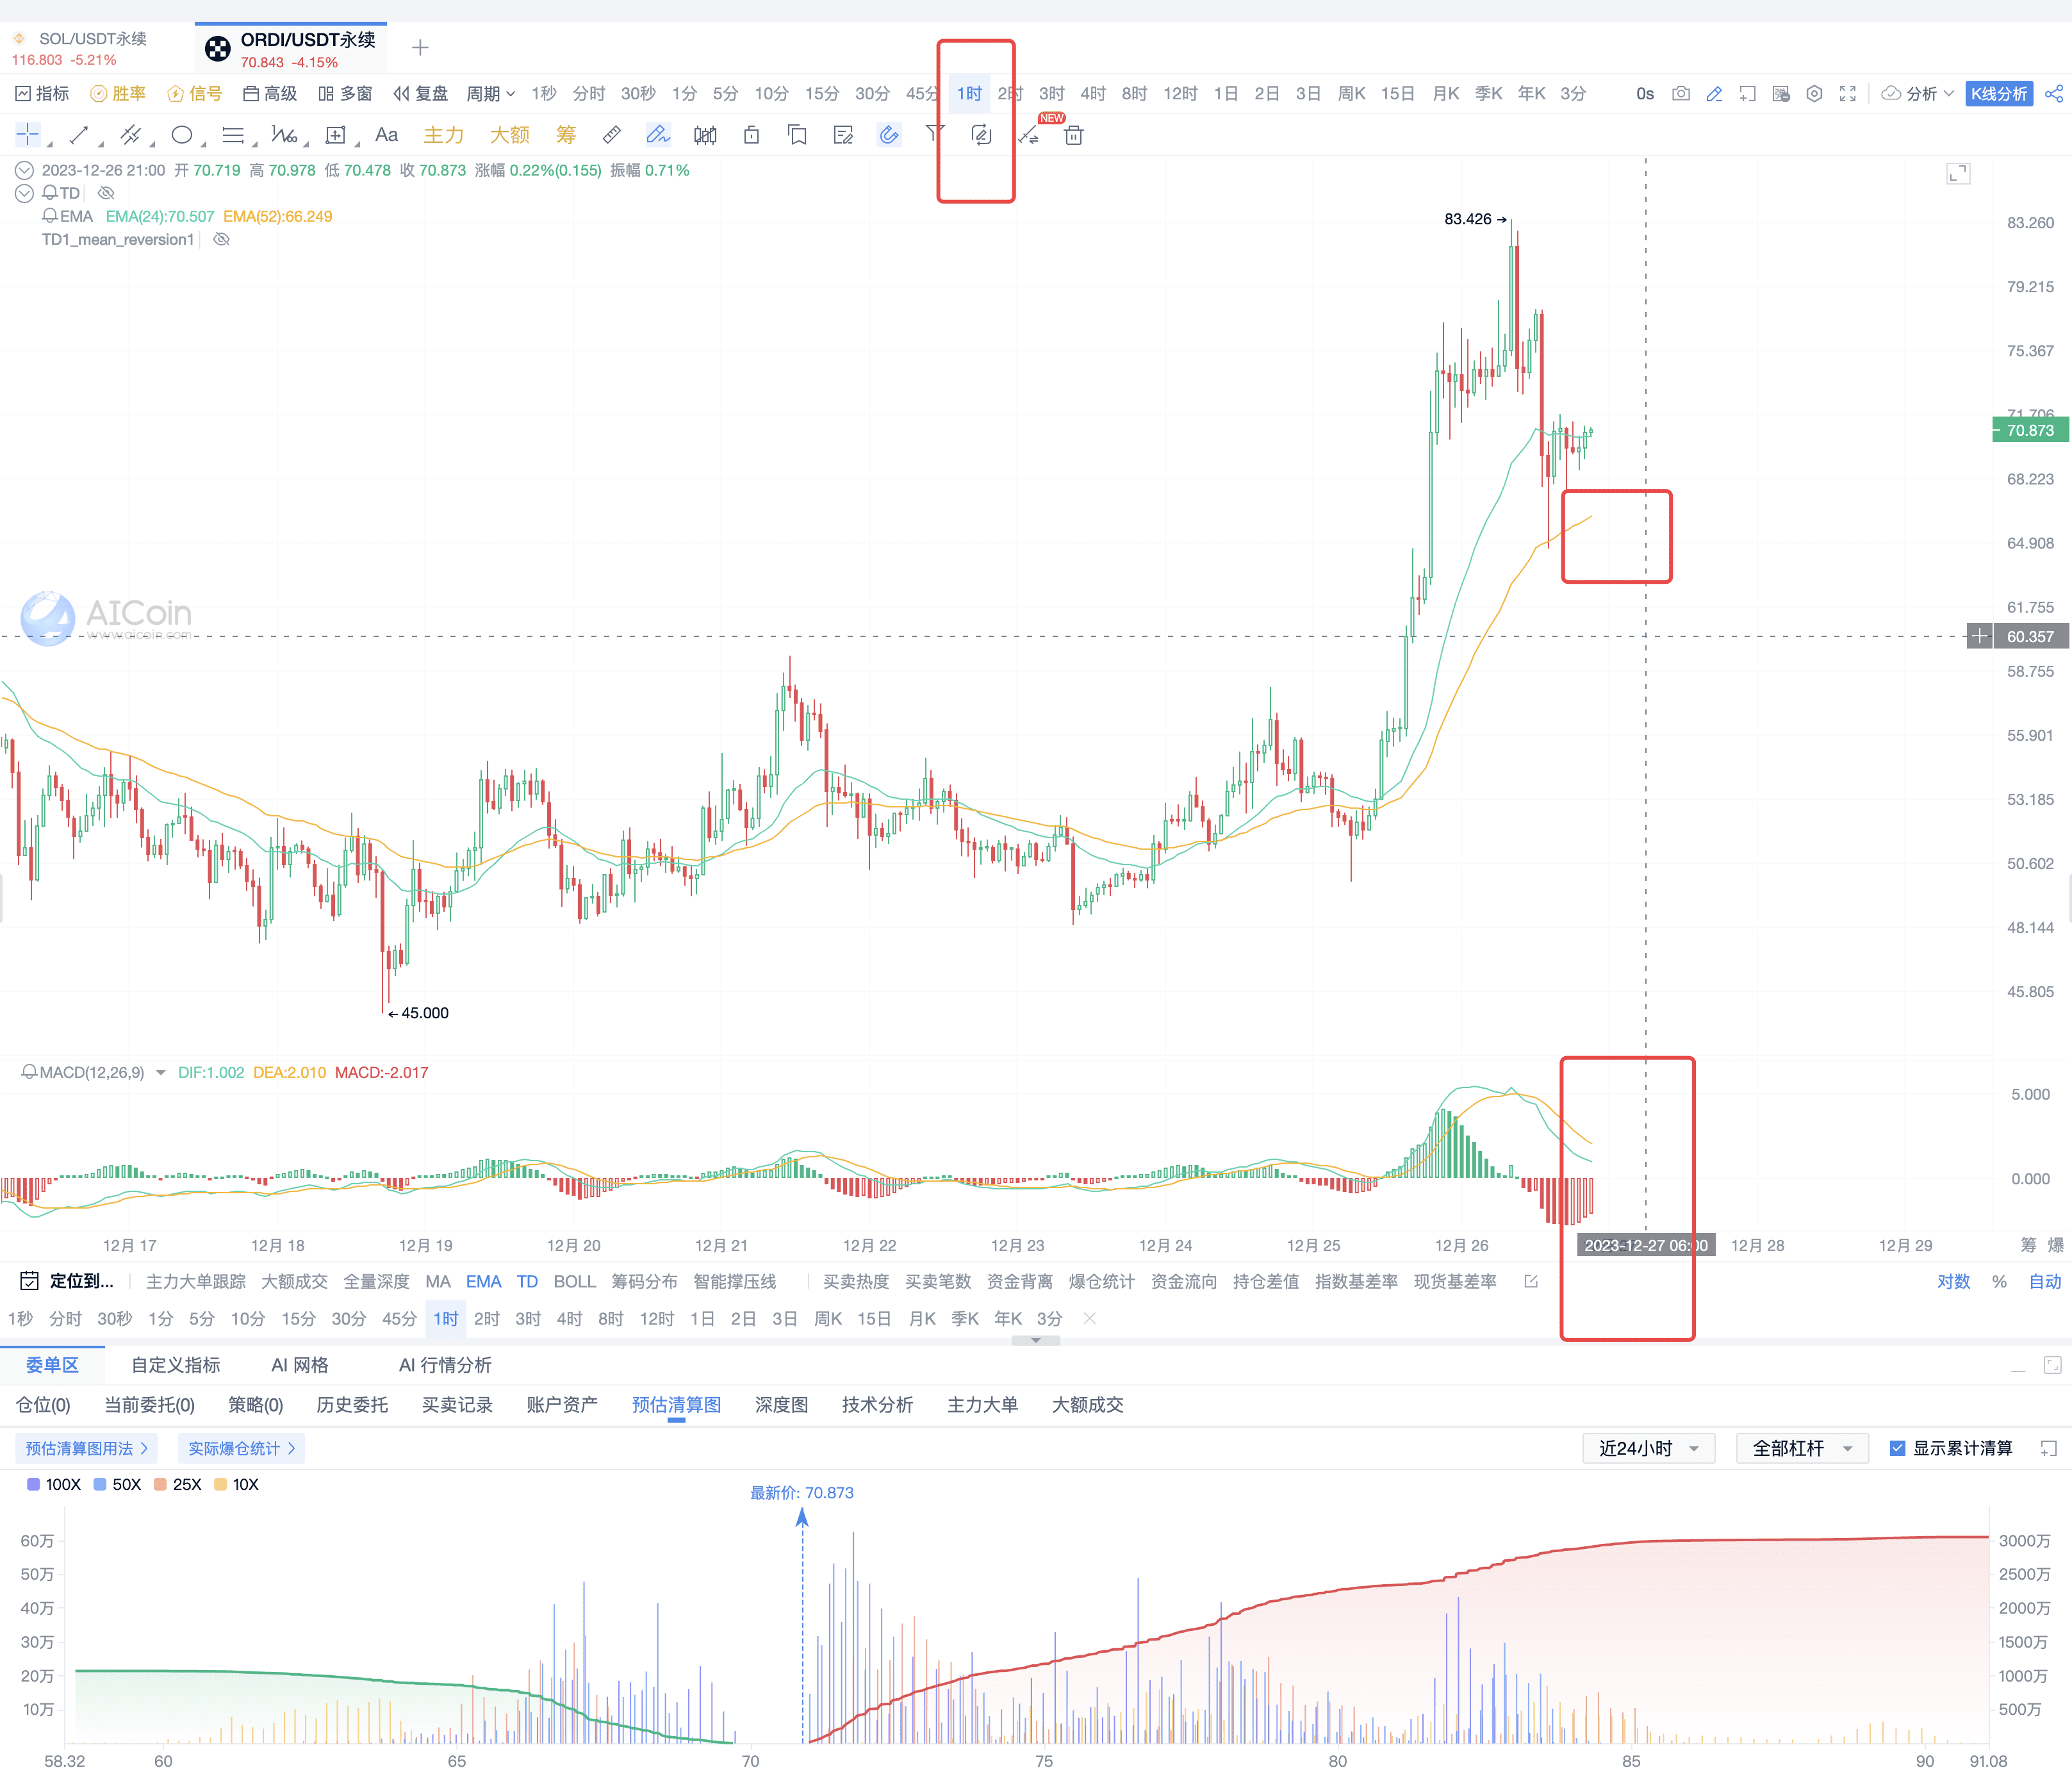
ORDI
On the hourly cycle of ORDI, it is recommended to observe and wait for the opportunity to pull back to the zero axis; it is currently in the process of pulling back to the zero axis and is still firmly above EMA52.
Xiao A is the industry's first intelligent analysis robot for currencies and K-line charts launched by AICoin. Xiao A can help you in 3 minutes: (1) analyze currency trends; (2) analyze K-line chart trends; (3) analyze price trends combined with indicators; (4) provide advice on buying and selling points; (5) predict price movements.
Open the PRO version of the K-line to experience Xiao A's intelligent analysis: https://aicoin.app/zh-CN/vip
4. Q&A
Many times, the teacher also falls when it is above?
Currently, it only indicates the trend, not that it can be entered blindly when it is above. Being above indicates a strong upward trend compared to a downward trend.
Why is it 52, and not other numbers?
Choosing EMA52 requires skill. It is derived from the EMA12, 26 of the MACD indicator. In our research and actual trading process, we have found that it has a high value for trend judgment.
Can we directly use the golden cross of EMA24 and 52 to indicate a bullish trend and the death cross to indicate a bearish trend?
This method can be used. If using these parameters, consider using the 30-minute and 15-minute cycles; for entry judgments using only EMA, it is recommended to use the 1-hour and 4-hour cycles with parameters EMA12, 26; for capturing popular currencies, it is recommended to use the combination of EMA24, 52 + MACD.
What is the difference between EMA24 and 52 and EMA30 and 60?
EMA24 and EMA52 are derived from the constituent elements EMA12, 26 of MACD. As for the parameters 30 and 60, they have not been backtested, so the specific differences are not clear.
What cycles are suitable for the combination of EMA24 and 52 and MACD (12,26,9)?
Generally, it can be used for cycles of less than 1 hour and is suitable for medium to short-term trading.
Recommended Reading
“Bull Market Big Profits, Tips for Screening Shanzhai Stocks to Help You Easily Profit!”
“2B and 123 Rules to Help You Seize the Golden Entry Points for Trend Trading”
“Liquidation Chart Identifies Market Trends, Predicts Future Trends of Main Forces”
For more live content, please follow the AICoin "News/Information-Live Review" section, and feel free to download the AICoin PC client.
免责声明:本文章仅代表作者个人观点,不代表本平台的立场和观点。本文章仅供信息分享,不构成对任何人的任何投资建议。用户与作者之间的任何争议,与本平台无关。如网页中刊载的文章或图片涉及侵权,请提供相关的权利证明和身份证明发送邮件到support@aicoin.com,本平台相关工作人员将会进行核查。


