Click to watch the video: Master Chen's 12.25 Video: Vegas Indicator Golden Cross Analysis - Where to Buy if the Market Falls?
Last week, my one-on-one members made a lot of short-term profits from their contracts. Basically, they were buying high and selling low every day, but the number of short-term trades was not high. The main goal was to expand profits and reduce risks. As for the medium and long term, the market has not seen an increase, and some friends have seen some profit retracement in their medium and long positions. However, I noticed that most people have not closed their positions yet. Today, let's discuss how to determine the next buying point for Bitcoin and share some knowledge from the charts.
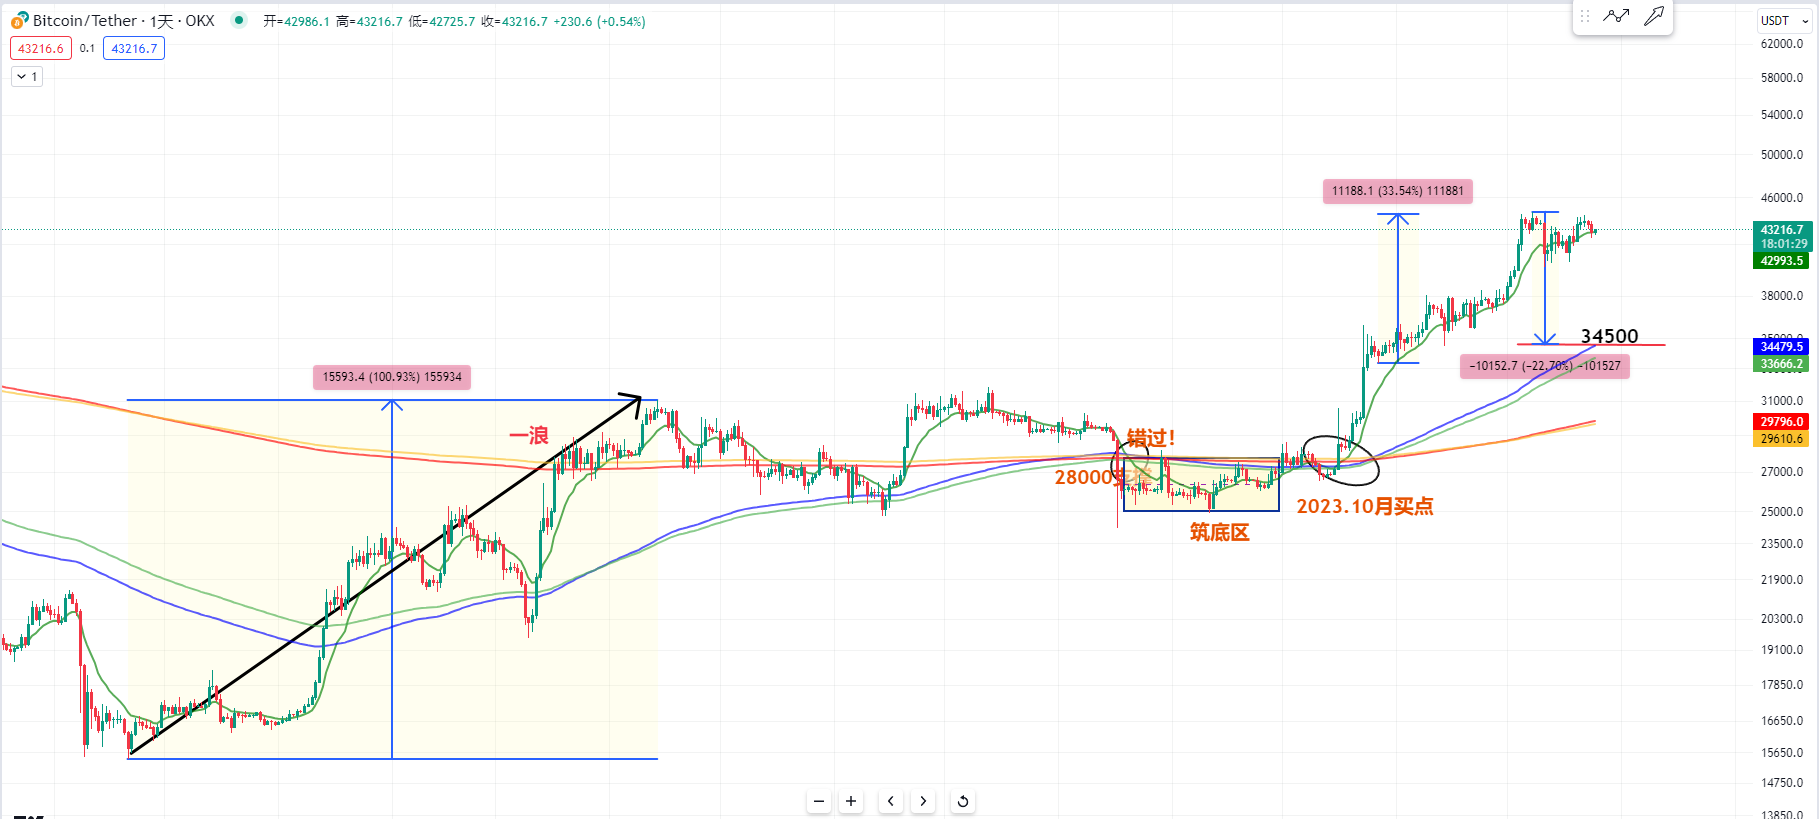
First, let's take a look at the daily chart of Bitcoin. In the range of October this year, I also want to tell everyone that the Vegas indicator on the daily chart of Bitcoin may have a golden cross at any time. The golden cross is a very important indicator. In a lifetime, you may encounter the opportunity to buy at a golden cross only two to three times.
Because this golden cross occurs on the daily chart level in the Vegas blue 144 channel, or the lower 576 and 676 channels, we may have to wait for 4 or 5 years for it to happen.
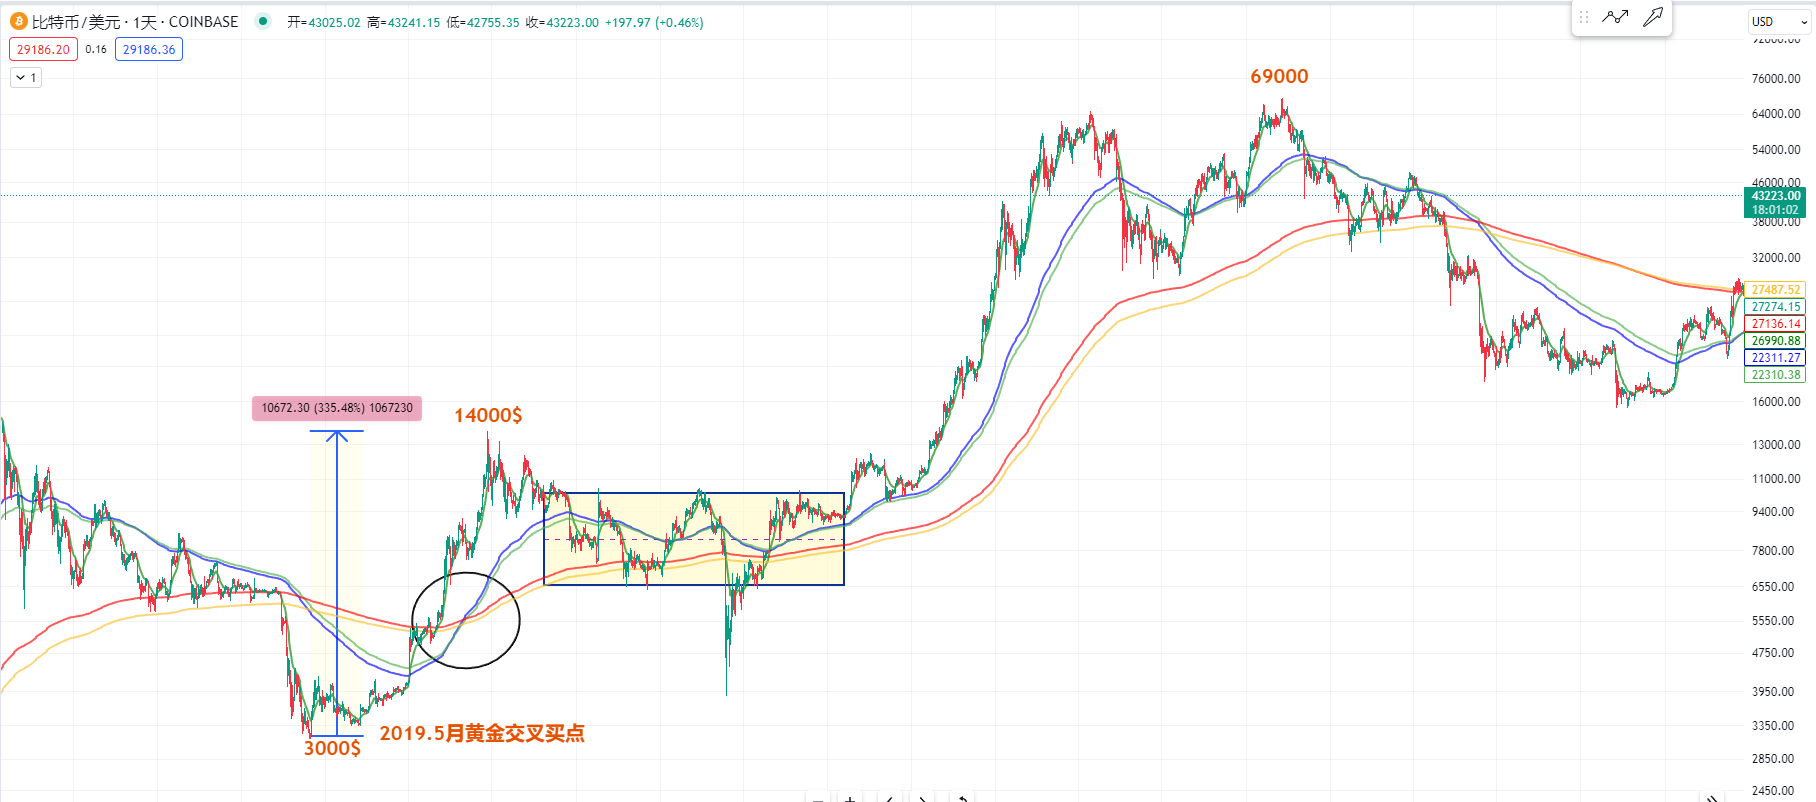
Let's take a look at the last time this Vegas indicator on the daily chart level had a golden cross, which was in 2019. At that time, after the bottom was formed at the end of 2019, the golden cross occurred at this position, and for several years, there was no death cross. I also mentioned last year that in the history of Bitcoin's cycles, the maximum time for a downtrend is only one year. After dropping from 69,000 to below 20,000 for a year, I started telling everyone to buy in batches, and then Bitcoin's first wave of rise began.
I missed an opportunity at this position because at that time, I also judged that the golden cross at this position could be very important support, around 28,000, or ideally it could drop to the support around 27,000. However, the main force of Bitcoin generously returned to this golden cross position and formed a range below it.
So, I also told everyone before to respect this daily golden cross, especially the candlestick returning to the top of the Vegas 144 and 576 channels. If you entered at that point, the profit from Bitcoin's current space is also very considerable. Even if you entered at this point, there is a 30% profit. Bitcoin has not risen in the past two days.
In my personal judgment, Bitcoin is still not likely to break through the 44,444 position in the short term. If Bitcoin falls back, will it fall deeper? However, my view is that all trends at the moment are bullish, and any decline is a very important buying point. Do not worry about short-term or medium-term declines.
Because this indicator only has such an important golden cross every four years, it will not immediately have a death cross in the short term. So, I believe that the current trend is all bullish. If there is a decline, you must stand on the buy side, and you need to develop a big heart and good psychological quality. Do not worry about Bitcoin's decline. A big drop is a buying opportunity, especially a crash, which may be an opportunity for us to go long again with our spot and medium-term 100x leverage.
Because we can see that in 2019, Bitcoin's rise at that time had a relatively large space. The first wave of rise from 3,000 to around 14,000 was a 3x increase. Even if there is a big drop in this range, it is still a very important buying point. We also did not see the Vegas channel have a death cross.
So, we should not worry about whether Bitcoin will fall now, because if it falls, we can make short-term profits by shorting, and there are profits for our spot and medium-term positions when it rises. Moreover, the indicator is still in a golden cross, and it has just begun. We can also refer to the trend in 2015 when the first wave of rise was only 1x after the golden cross.
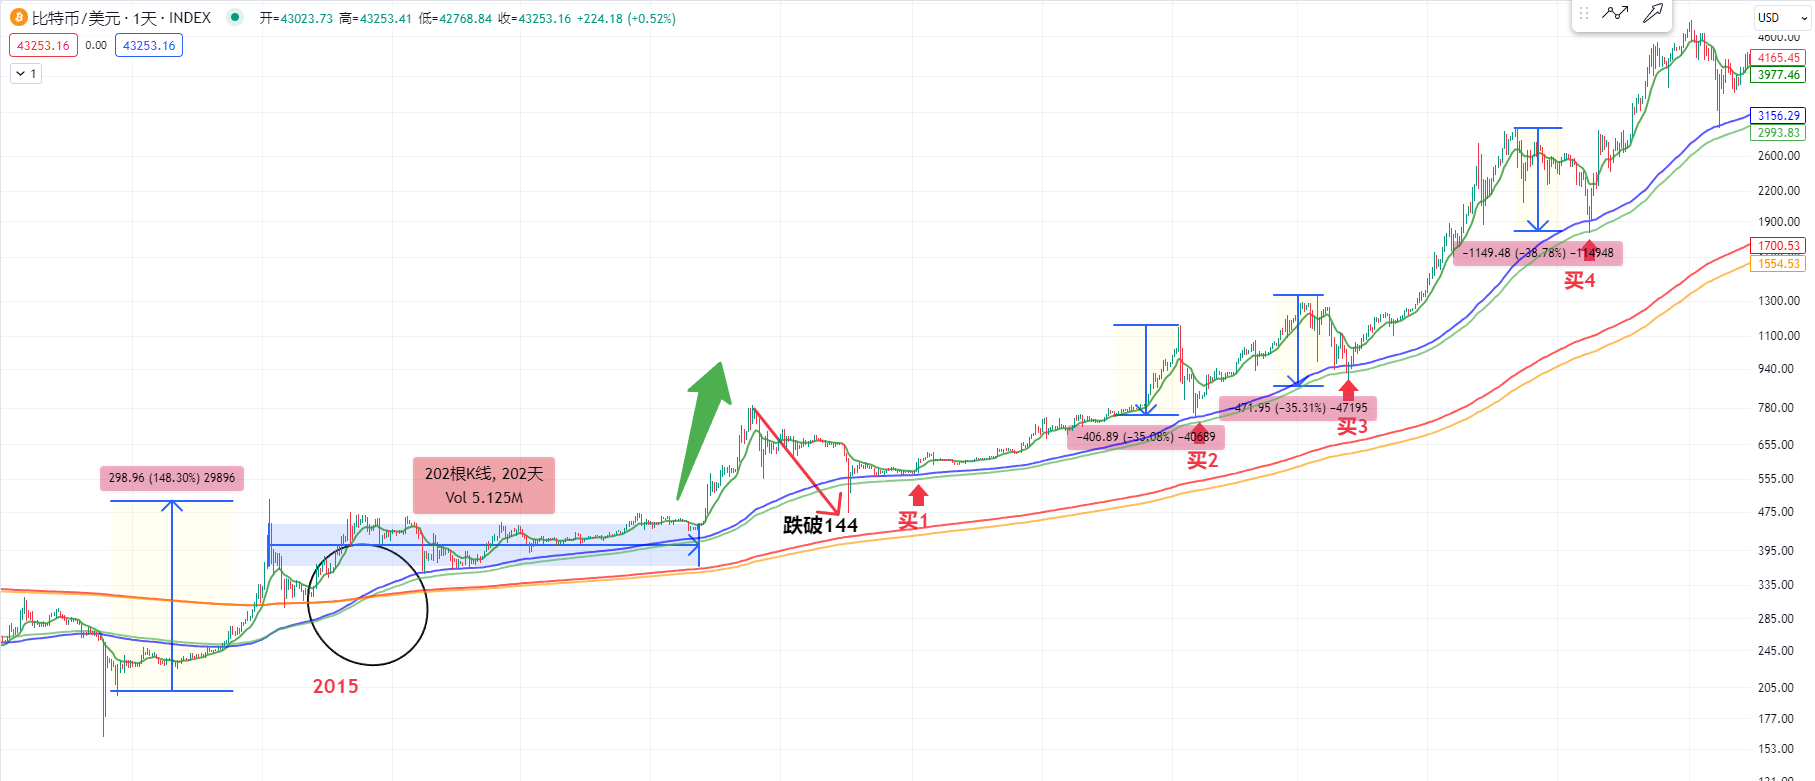
We can see that in 2015, after the bottom of Bitcoin, the golden cross appeared, and it rose by more than 1x. Then it consolidated for 200 days. The current range may be similar to this wave of rise. It consolidated for 200 days in the front and then broke through. We can observe that there was no death cross in the following three years, and there was a continued strong uptrend. If there is such a big drop, I hope everyone will boldly buy.
It's even better if you can guess these low points. If you can't guess, even if you buy at these positions and are trapped in the short term, you don't need to worry. This indicator is all in a golden cross. You should not expect Bitcoin to rise several times or whether Bitcoin will reach higher positions in the future.
So, let's observe the bottom of Bitcoin in 2015 when the golden cross just started at this position. After rising to this position, the indicator only had a golden cross. The time has just begun. If there is a fall back, we can observe several buying points.
Including this position, we can observe that it fell by 35% on the daily chart level. The subsequent buying point also fell by 35%, which is also a very important buying point. If we observe from a higher position, the space from the fourth buying point to the top is also between 30% and 40%.
So, let's observe the current Bitcoin Vegas 144 channel. The current price is approximately near 34,500, and we can also observe that if it comes down from this high point, the space is about 20%. Everyone should try to observe because this 144 channel moves upward at a certain speed every day.
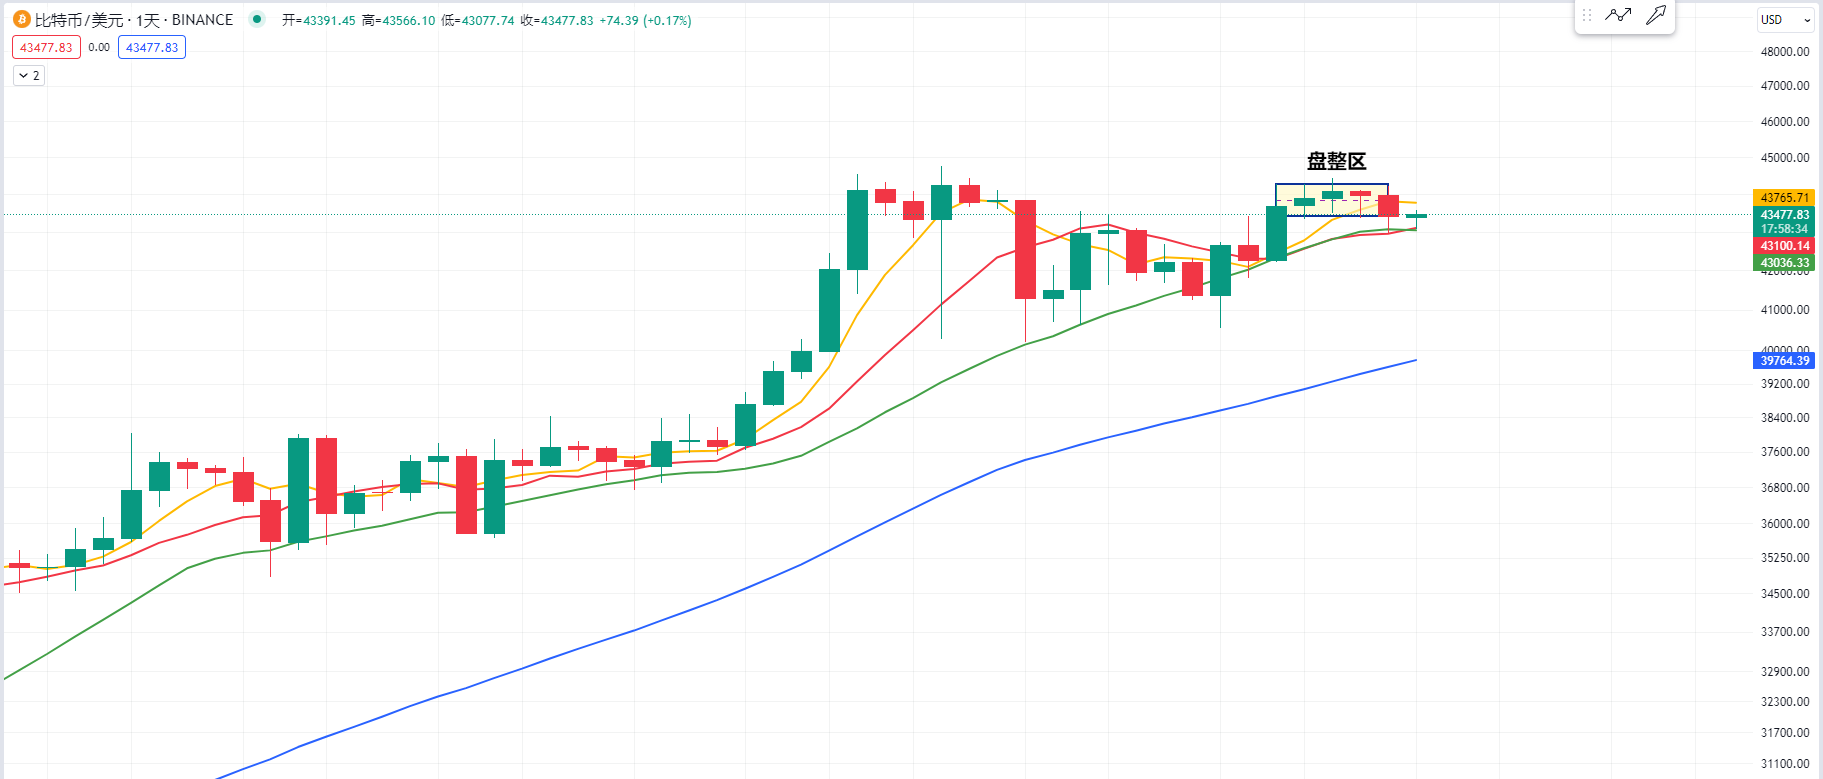
Then let's take a look at the daily chart of Bitcoin. Because I have been judging these two days, the green 20MA is the lifeline for retail investors. It is very close to this consolidation area, and it is estimated that there should be a change in the position. It must rise again by one candlestick. Yesterday it fell, so in the short term, we should try to observe whether this 20-day moving average can hold.
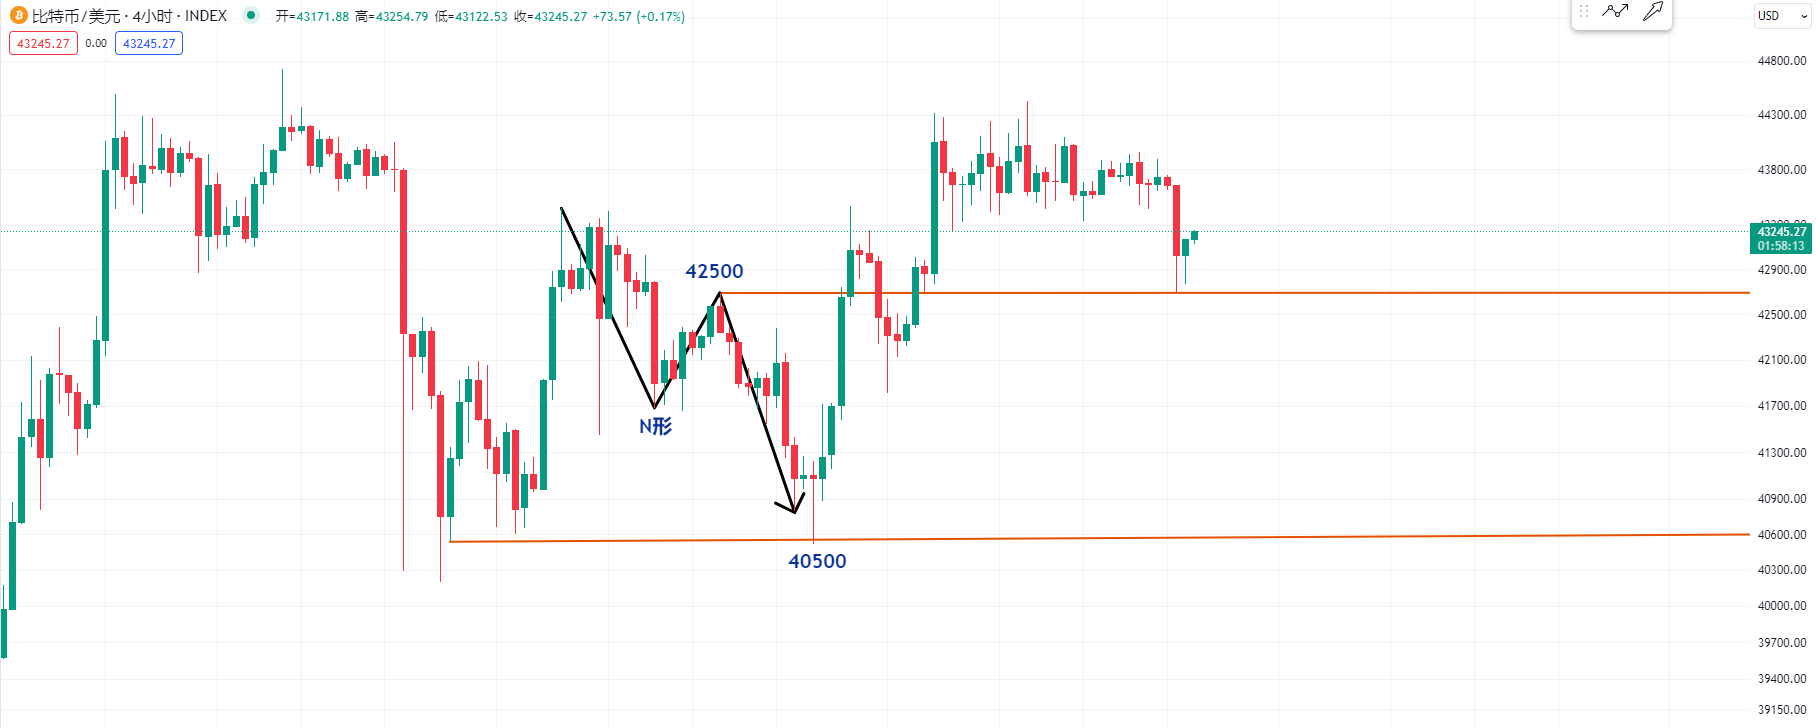
Then let's take a look at the support on the 4-hour chart of Bitcoin. I mentioned this position some time ago. At that time, there was an N-shape at this position on the 4-hour chart. After the breakthrough, it went up to this position, which is approximately near 42,500. Yesterday, this lower shadow also provided support.
So, in the short term, we should try to observe whether this support can hold. If it breaks down, we should pay attention to the Vegas 144 channel on the daily chart level. The next step may be a buying point for us to go long with 100x leverage. We will wait and see. Of course, we also need to pay attention to the time because sometimes Bitcoin's crash often happens when we are sleeping.
For more strategies, you can add a real account.
Candlesticks are king, trends are emperor. I am Master Chen, focusing on BTC and ETH spot contracts for many years. There is no 100% method, only 100% trend following. Daily macro analysis articles and technical analysis review videos are updated on the entire network.  Friendly reminder: Only the public account of the column (shown in the picture above) is written by Master Chen. The advertisements at the end of the article and in the comments section are not related to the author. Please be cautious in distinguishing between true and false. Thank you for reading.
免责声明:本文章仅代表作者个人观点,不代表本平台的立场和观点。本文章仅供信息分享,不构成对任何人的任何投资建议。用户与作者之间的任何争议,与本平台无关。如网页中刊载的文章或图片涉及侵权,请提供相关的权利证明和身份证明发送邮件到support@aicoin.com,本平台相关工作人员将会进行核查。


