I. Intelligent AI Analysis
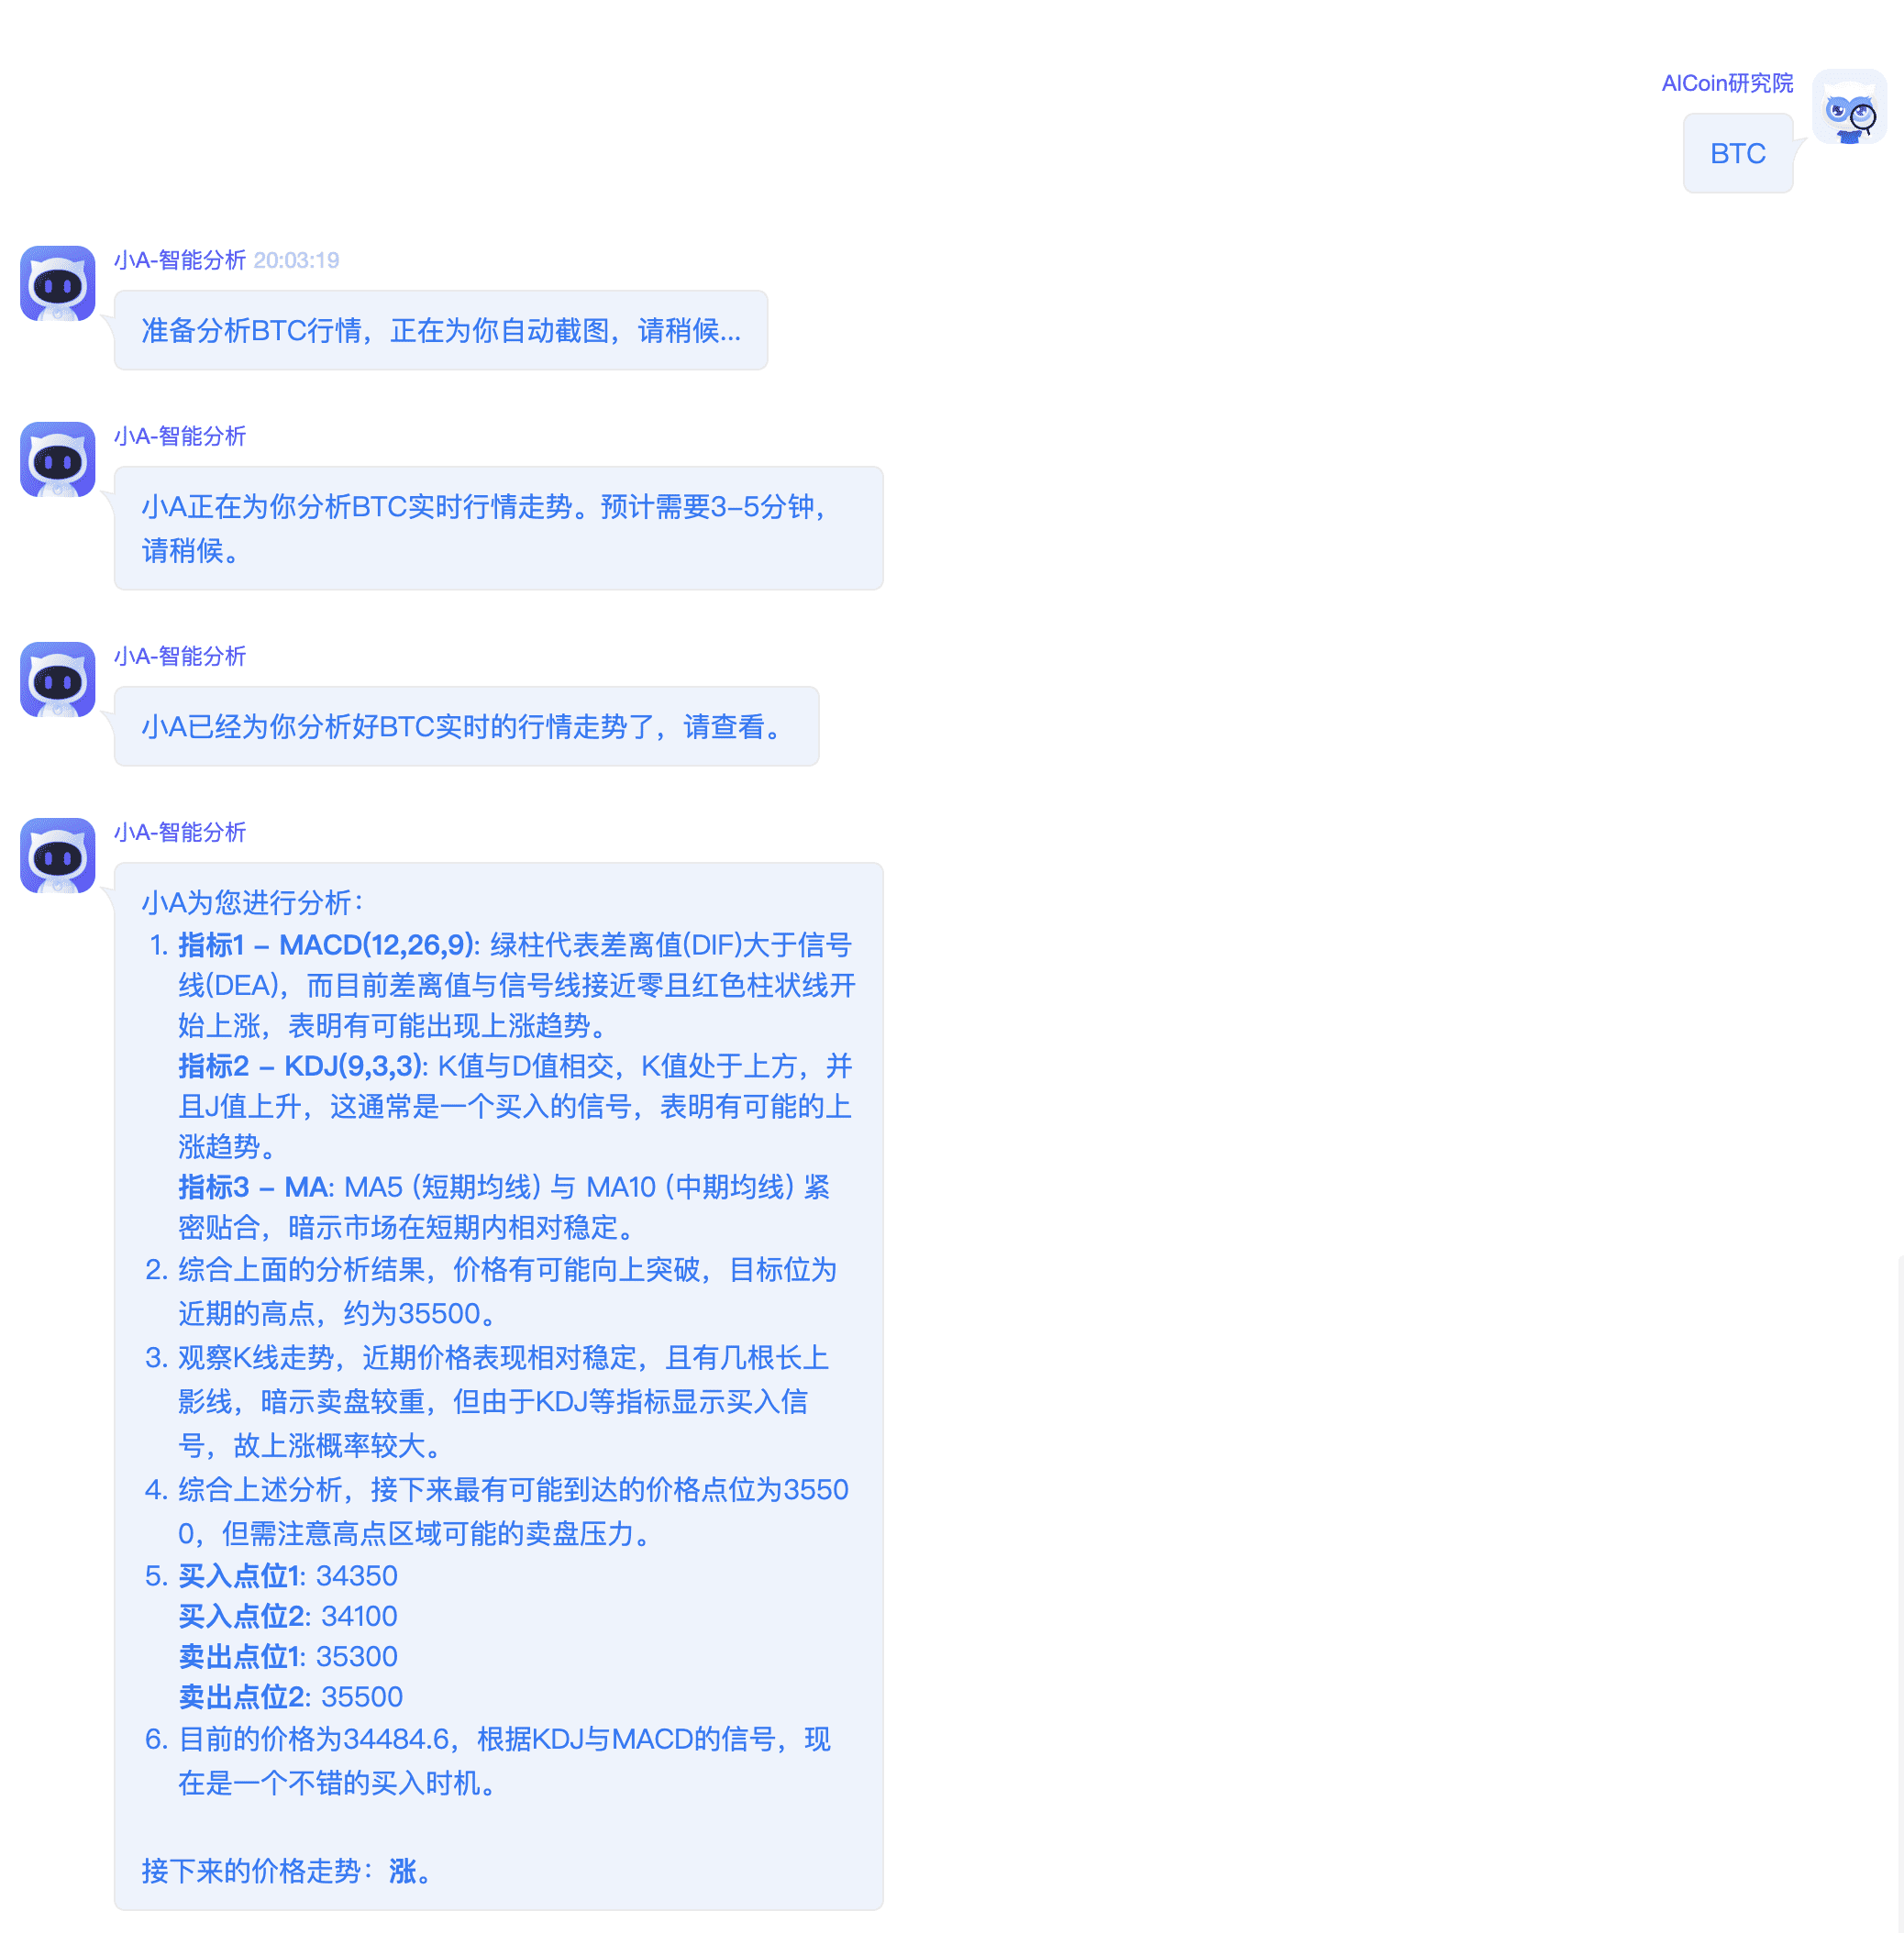
1. AI analysis of BTC
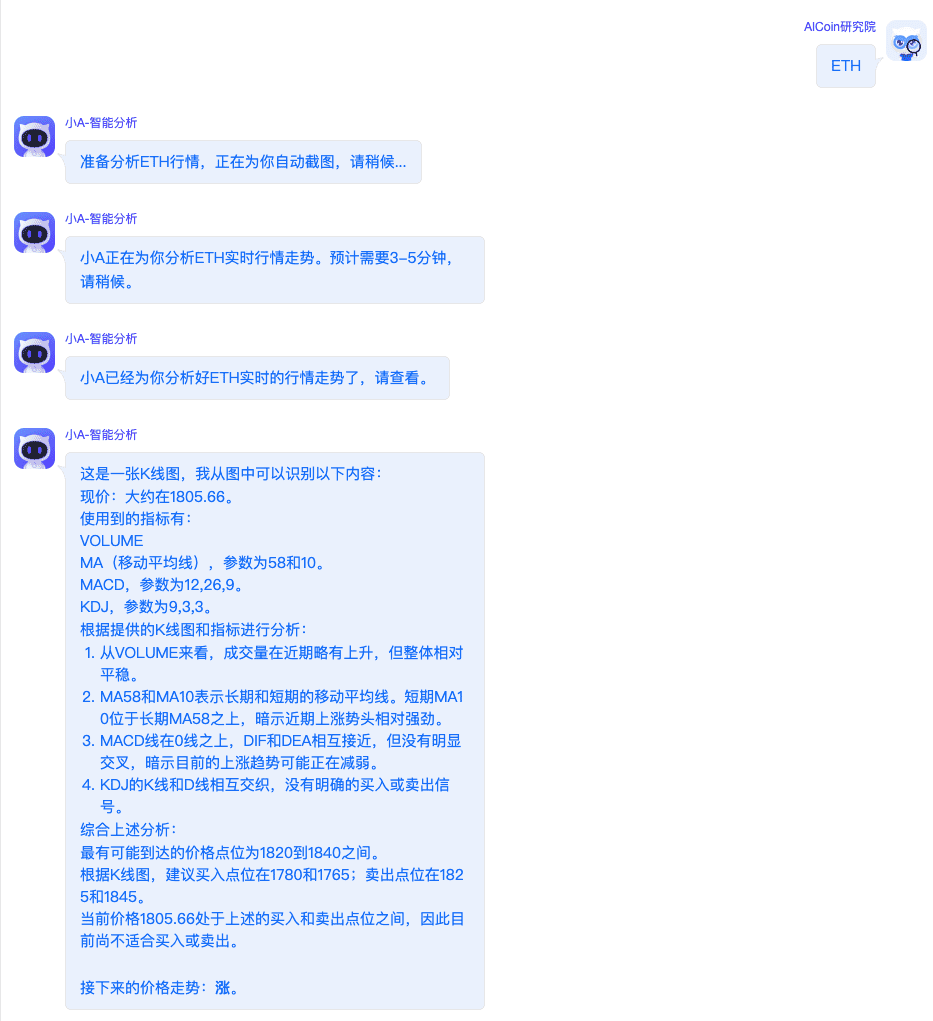
2. AI analysis of ETH
II. Setting and Composition of Ichimoku Chart Three Elements
1. Using the Ichimoku Chart
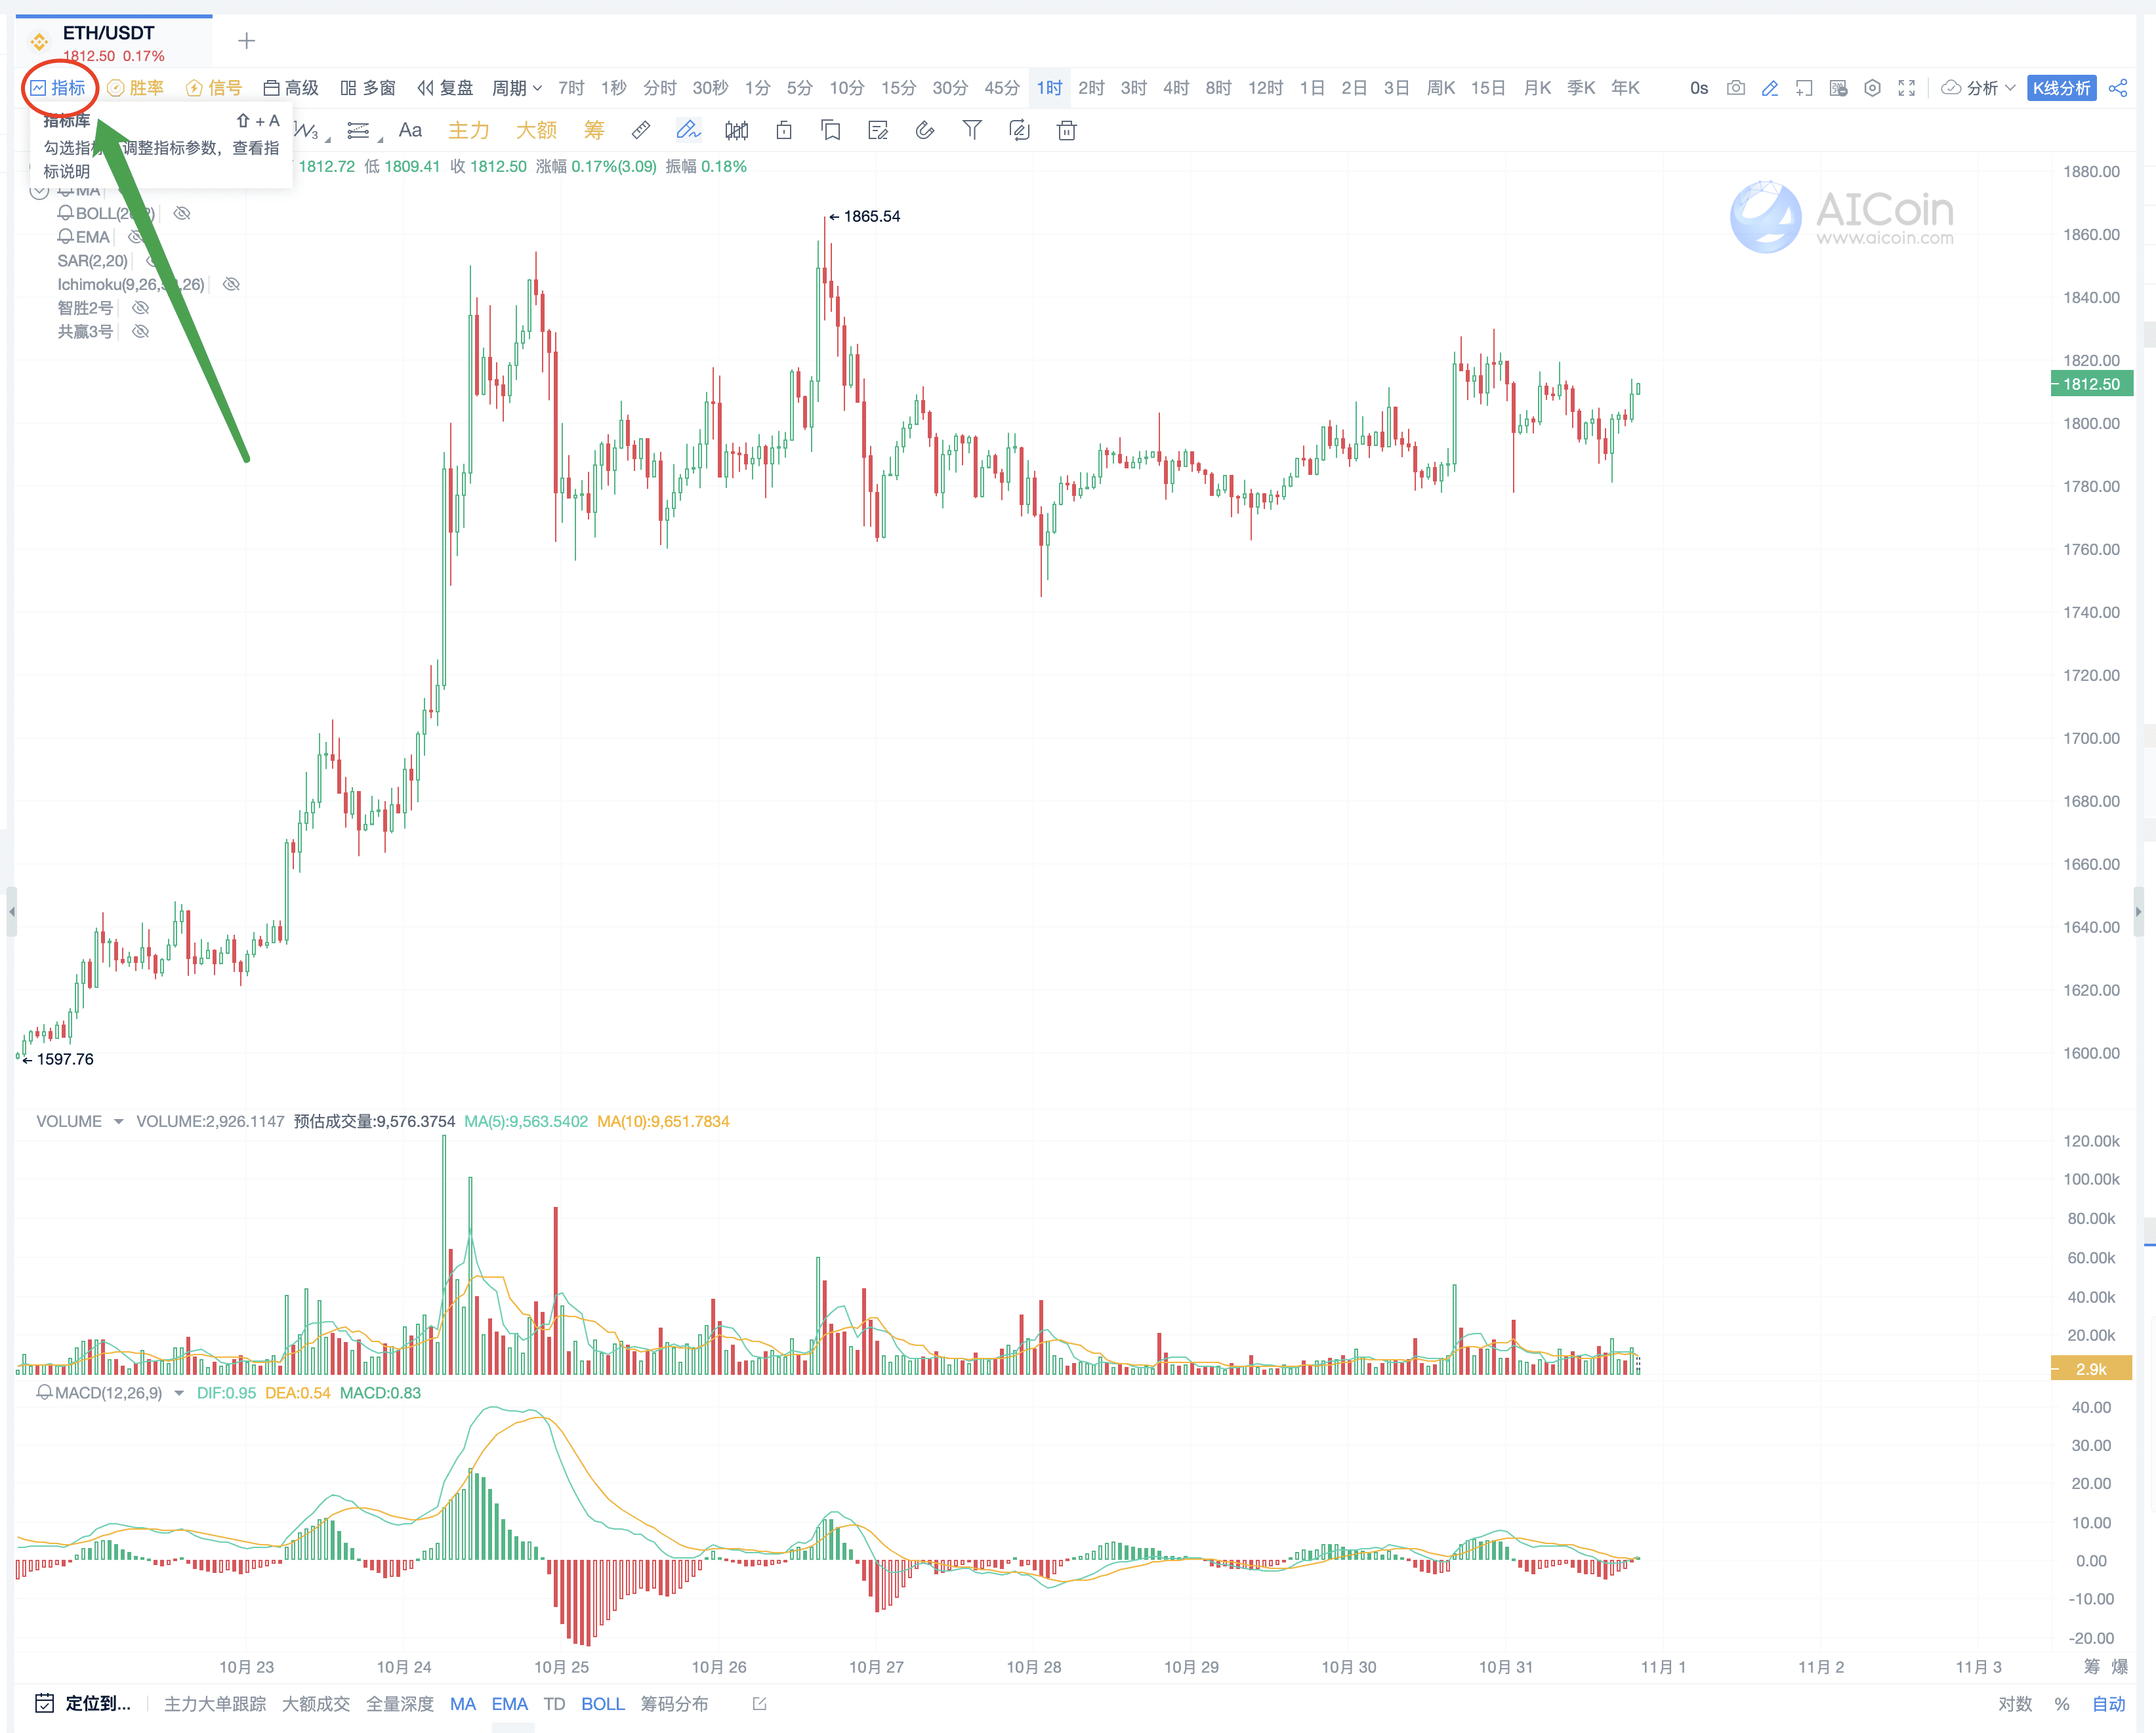
(1) Open the ETH/USDT pair on Binance, click "Indicators";
(2) Check the Ichimoku chart (ichimoku), which is a trend indicator used to judge the direction, strength, support and resistance levels, entry and exit points, etc.;
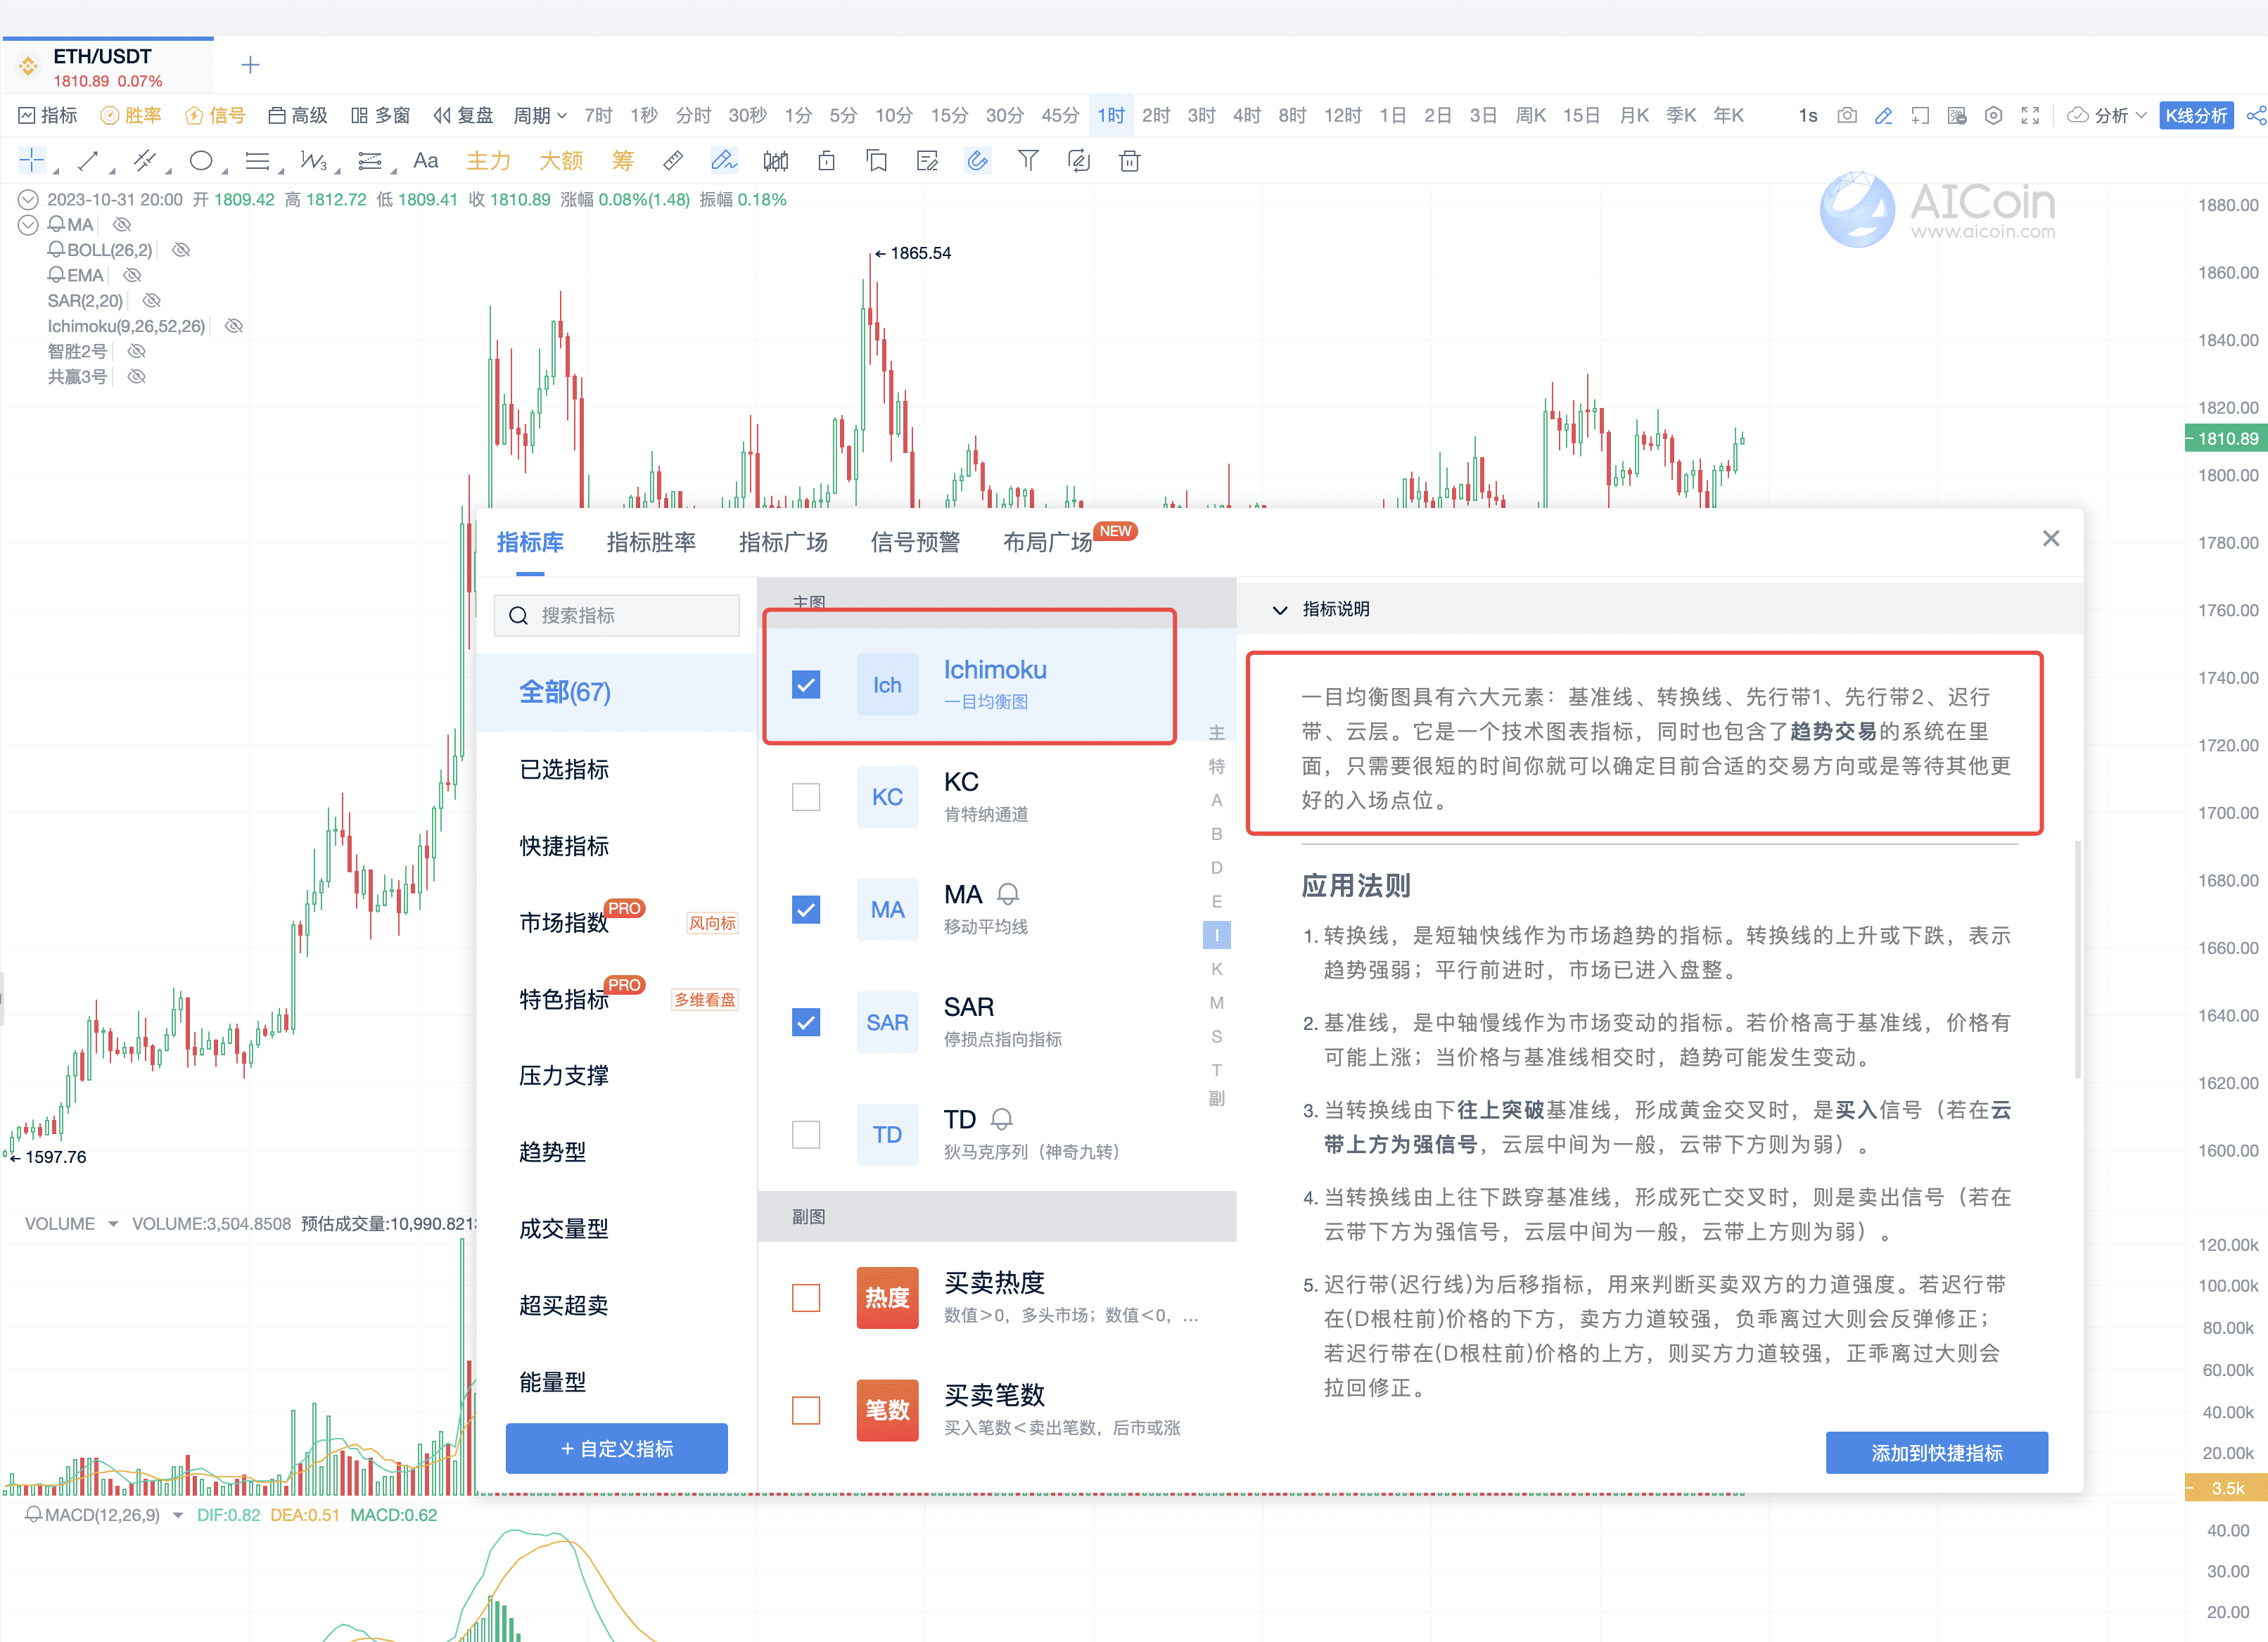
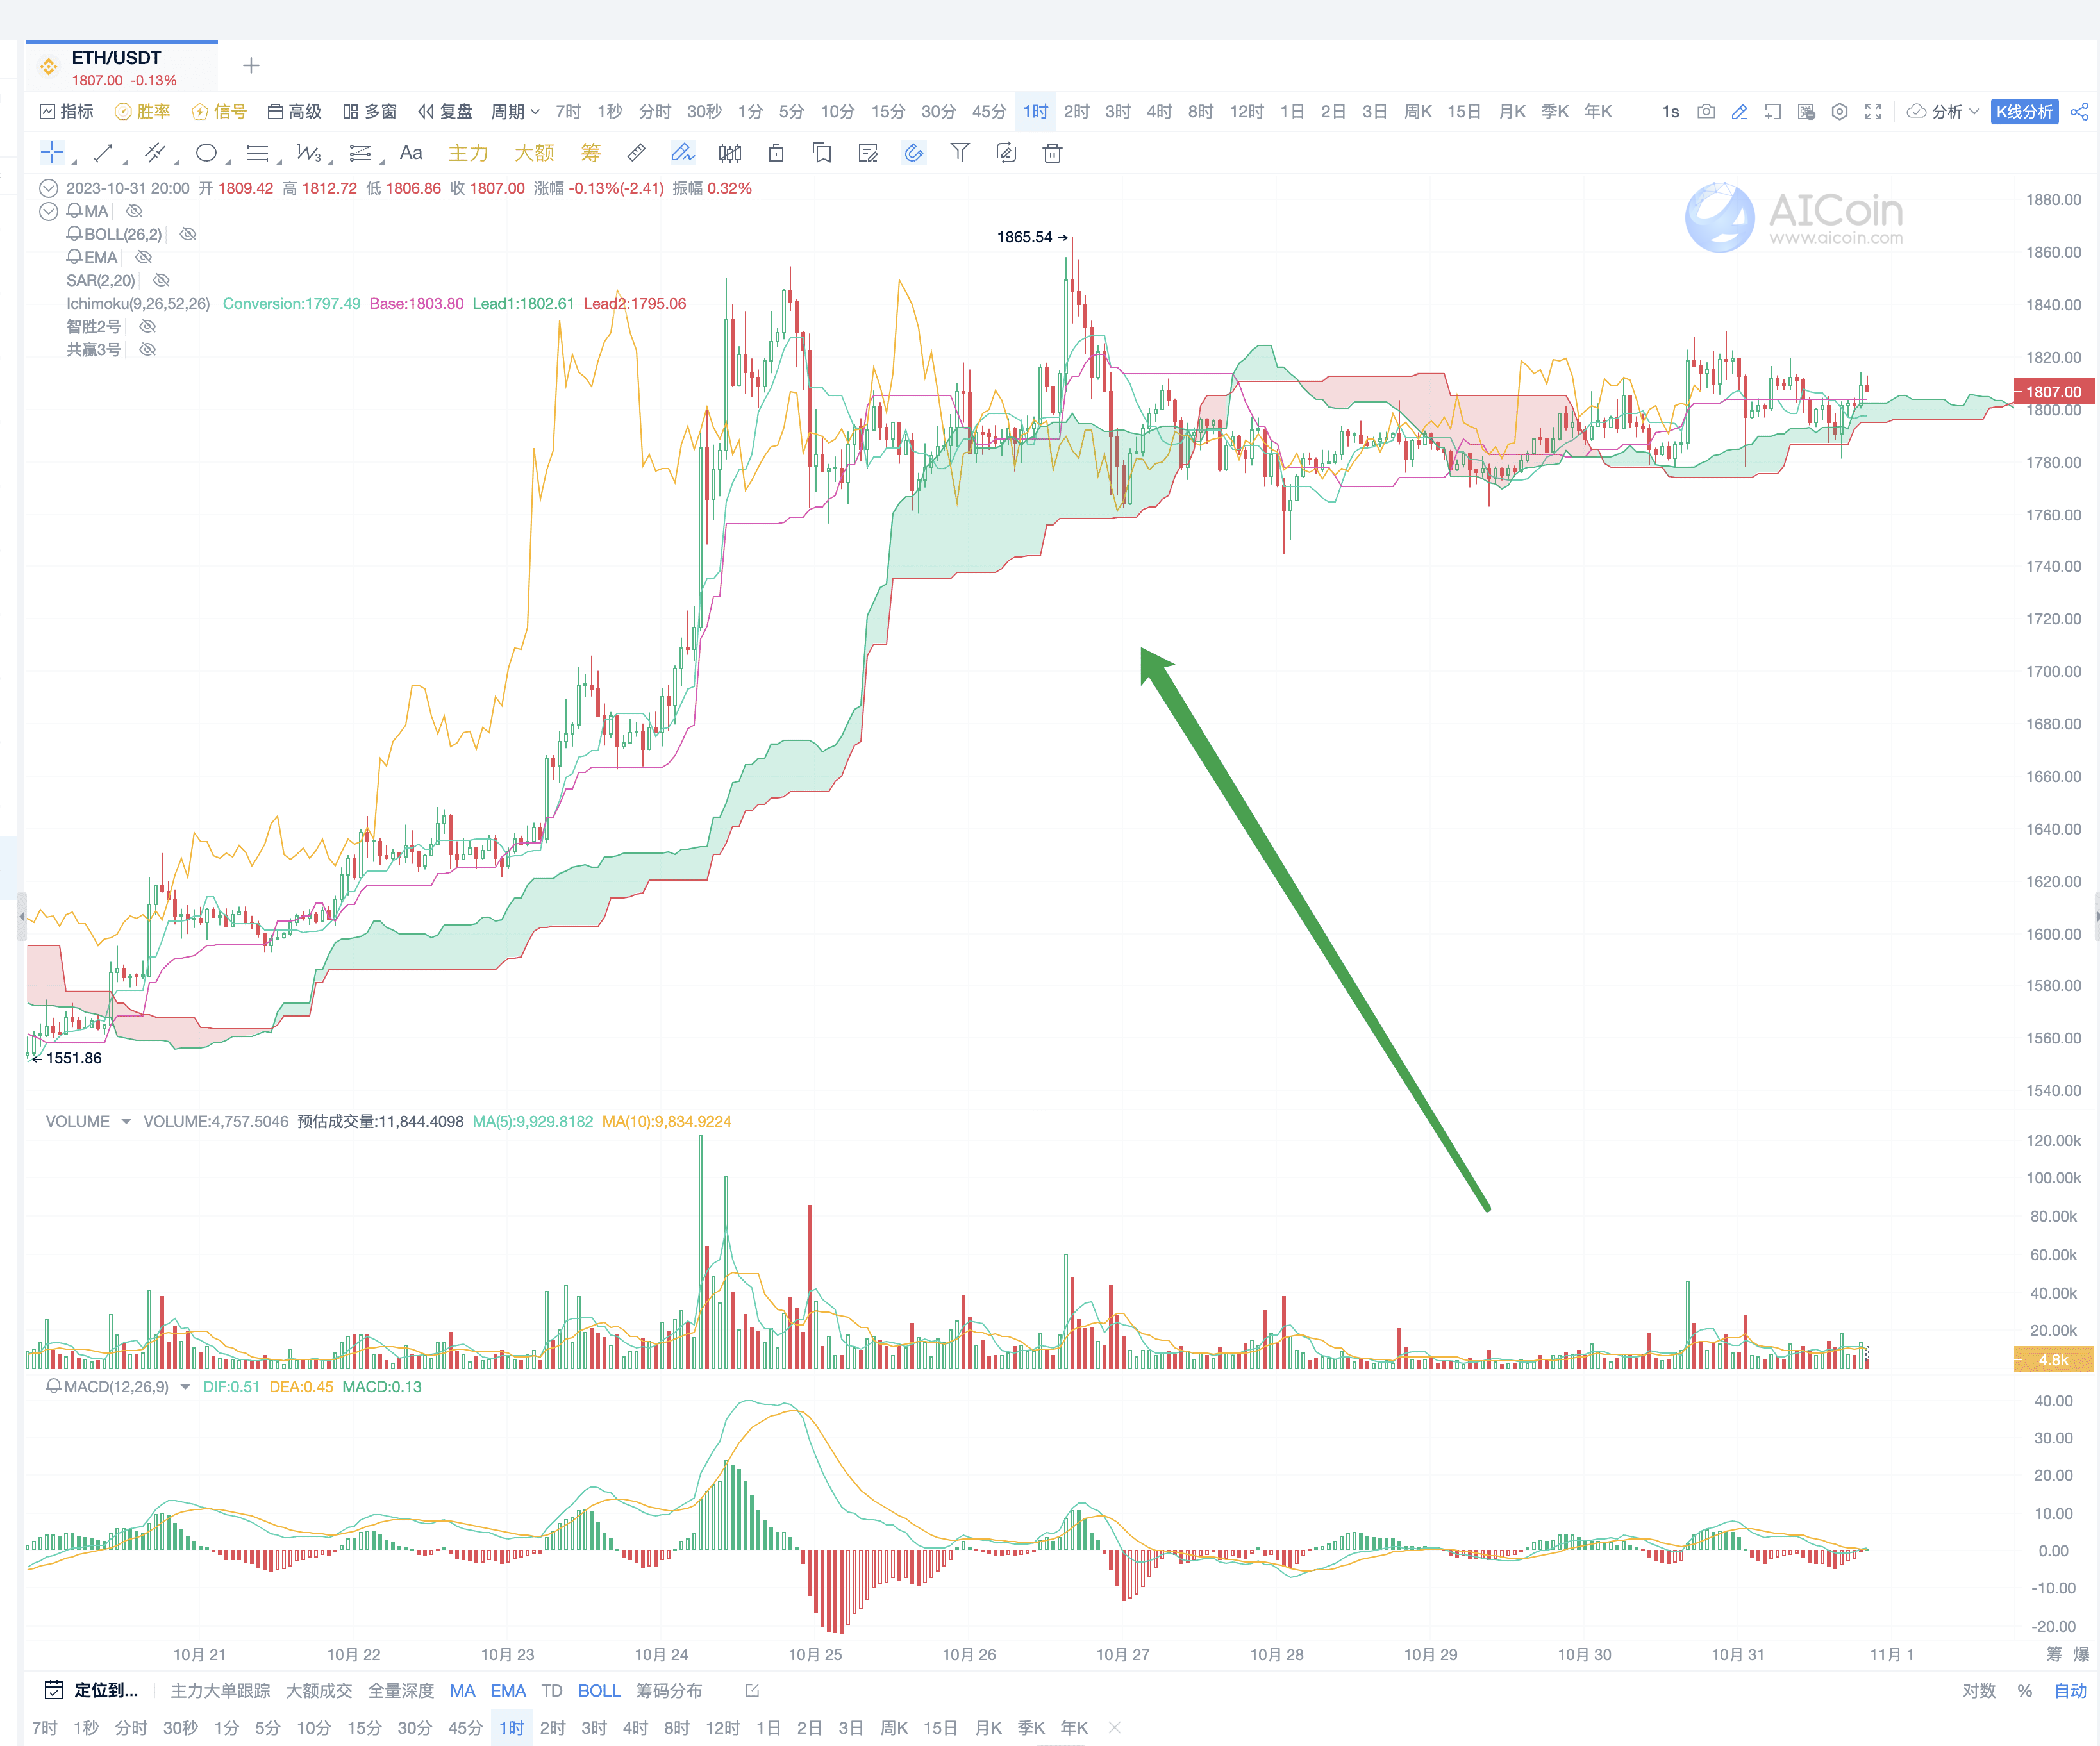
(3) Check the Ichimoku chart indicator, the indicator display is as shown in the figure.
2. First Element of Ichimoku Chart: Cloud
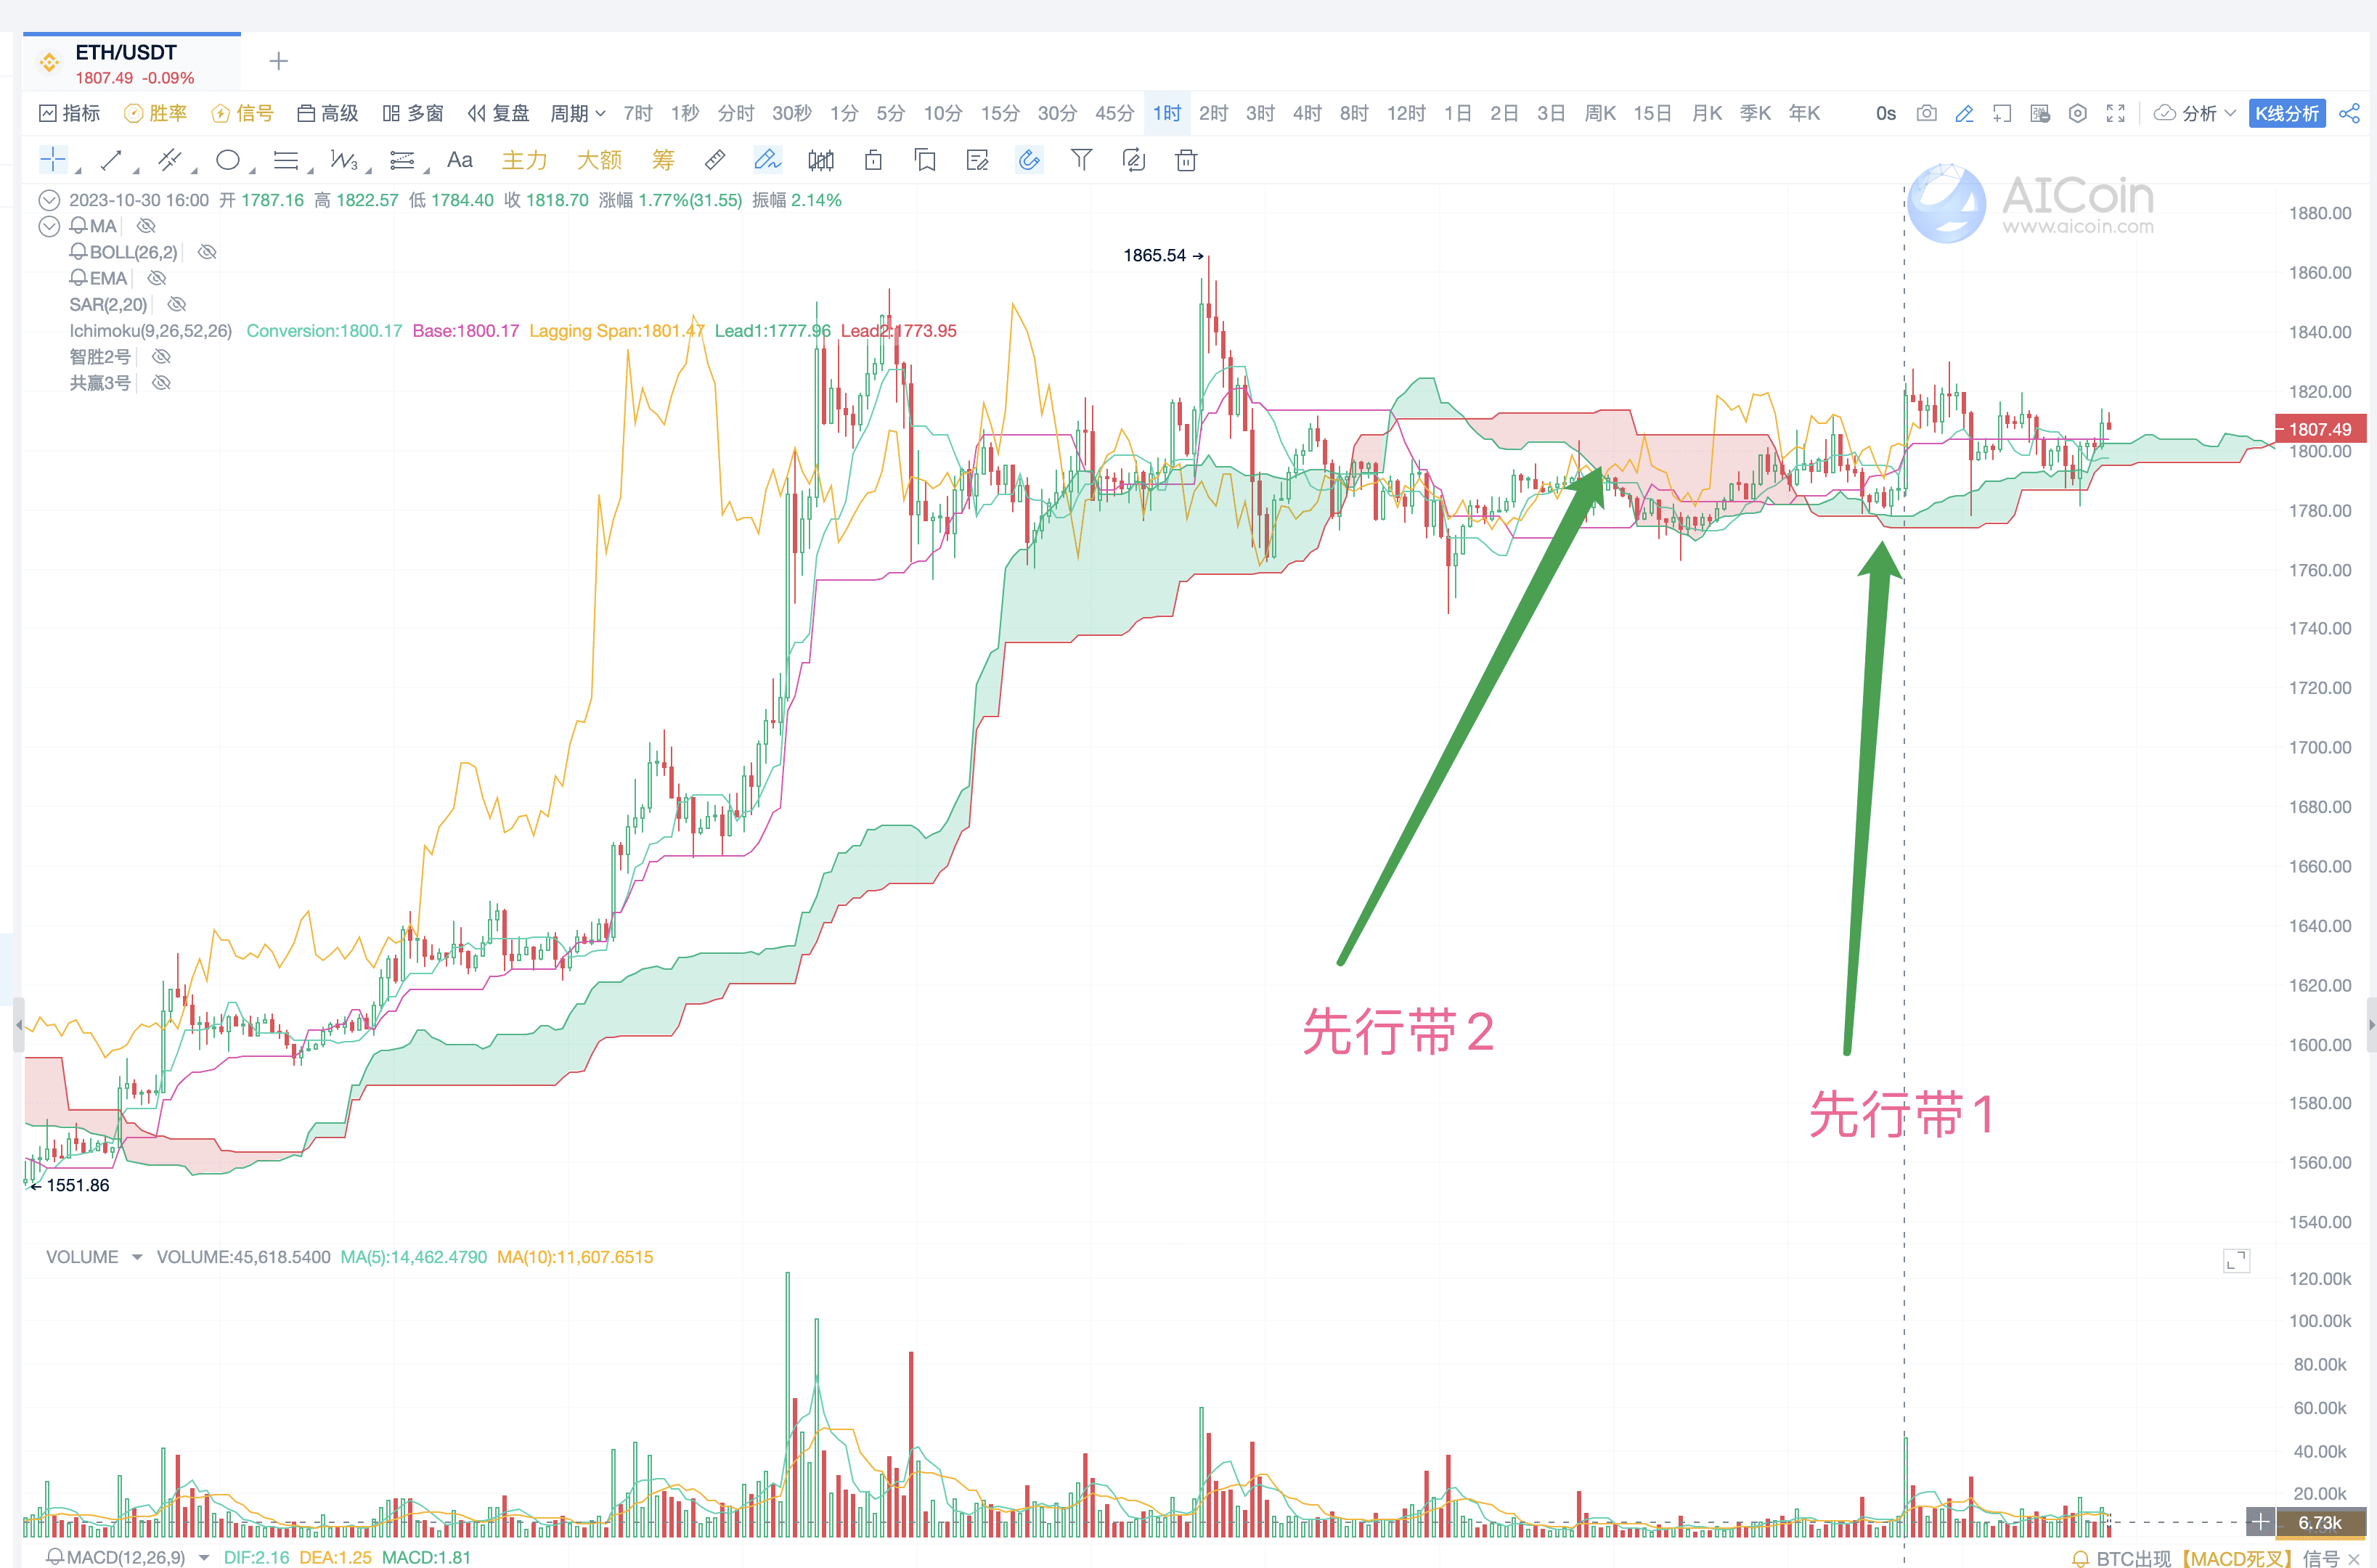
As shown in the figure, Leading Span 1 and Leading Span 2 form an area called the cloud;
The function of the cloud is to form support and resistance for the price. Therefore, it can determine the price trend and reversal.
3. Second Element of Ichimoku Chart: Base Line and Conversion Line
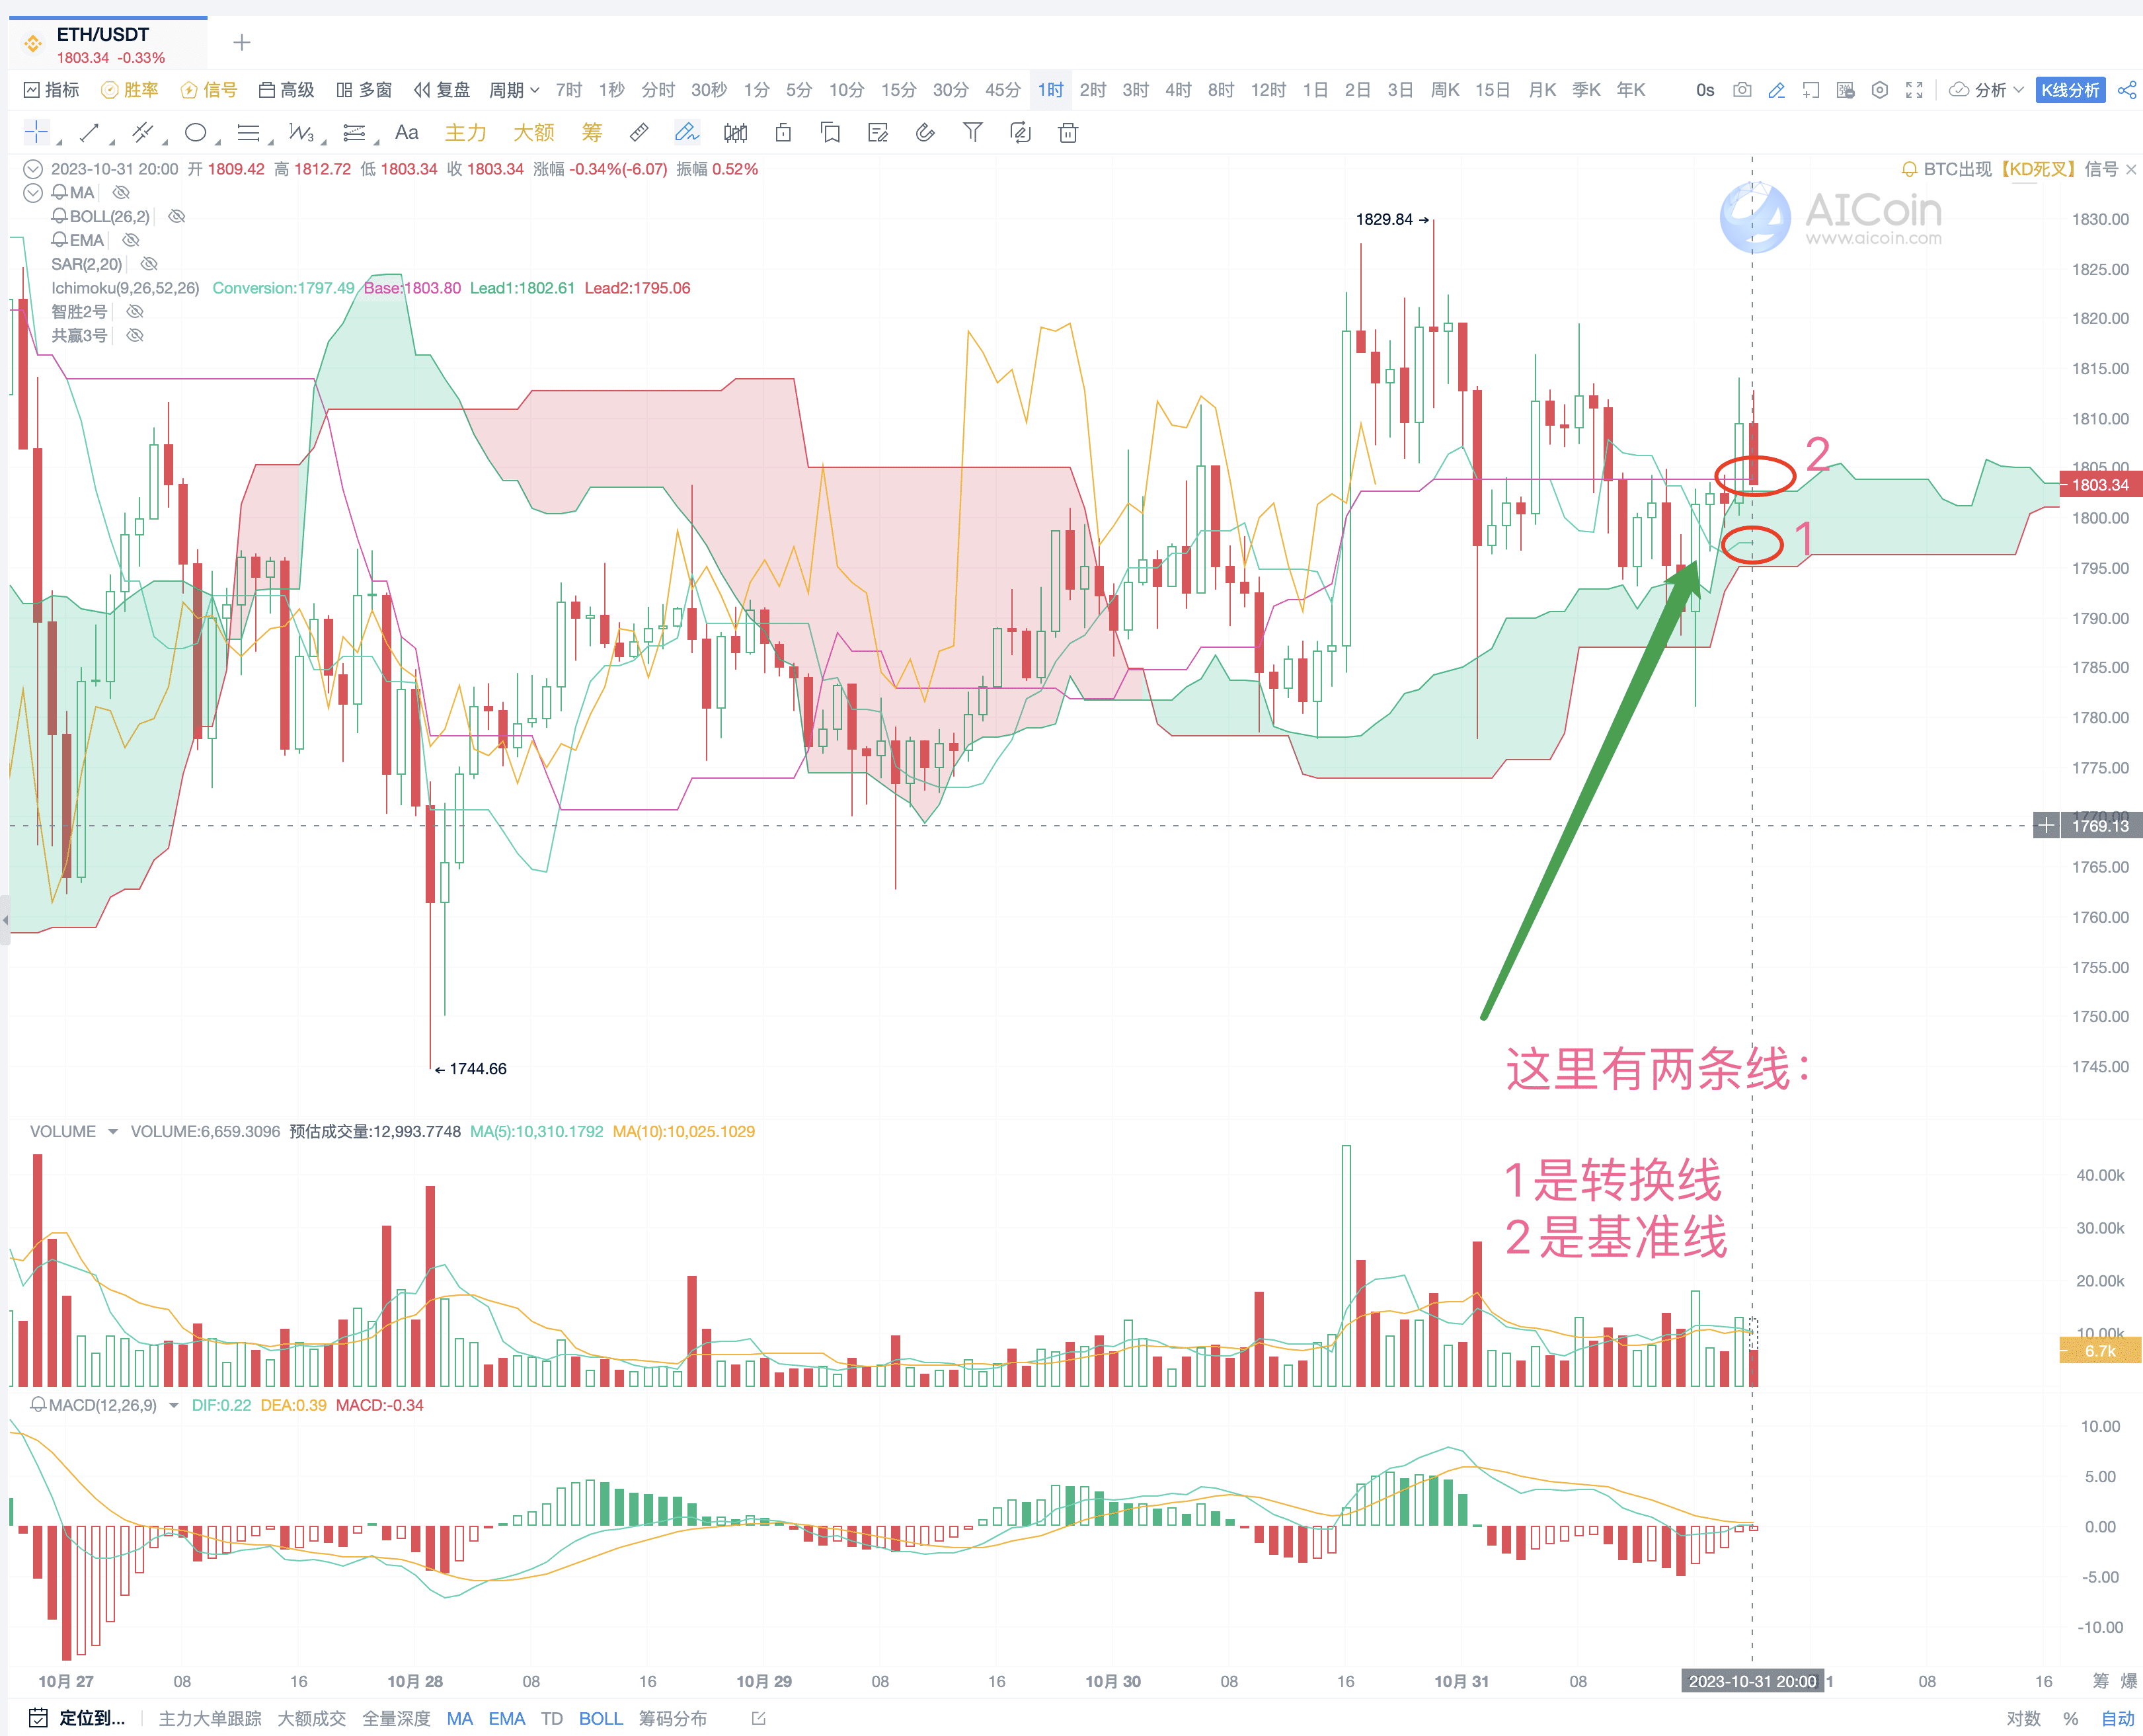
Conversion Line: Because it changes with the price relatively quickly, it is commonly referred to as the fast line.
Base Line: Also changes with the price, so it is commonly referred to as the slow line.
The golden cross and death cross of the fast and slow lines are good positions for entering and exiting corresponding to the price.
4. The Last Element of Ichimoku Chart: Lagging Line
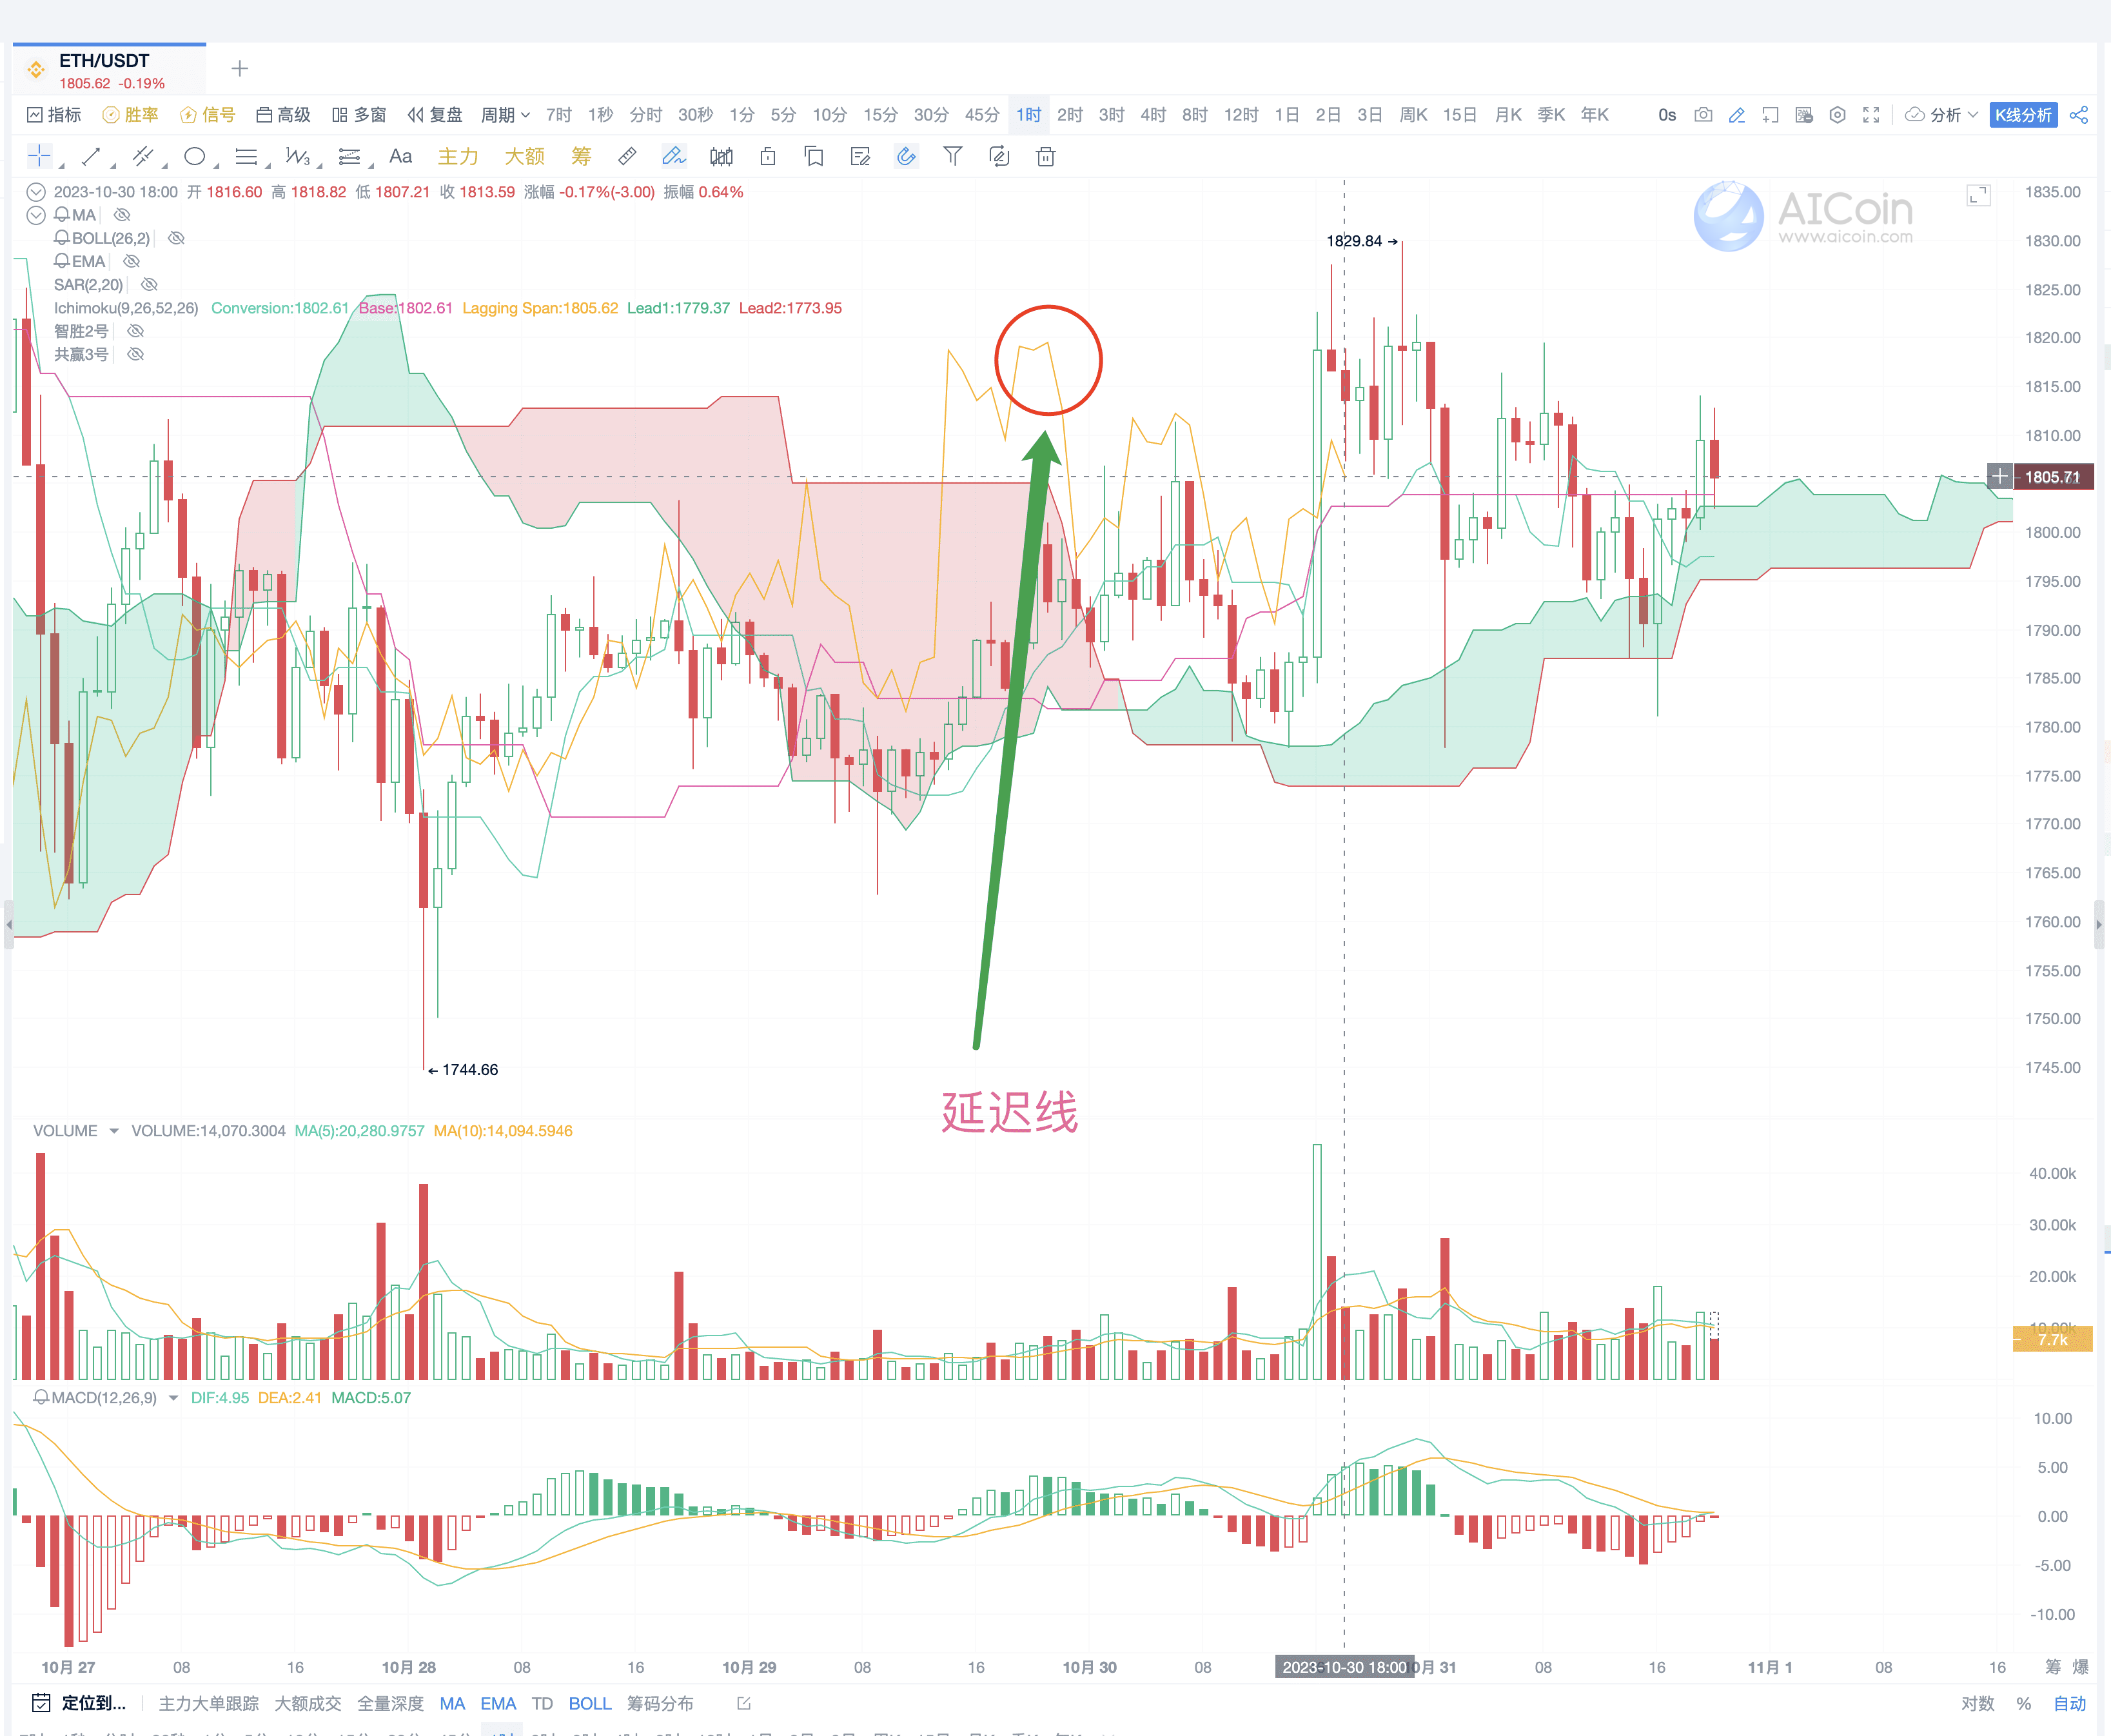
Function: The lagging line is used to confirm trend reversal signals. By tracking the lagging line, the trend situation can be clearly identified.
III. Strategies for Using the Ichimoku Chart
1. Basic Strategy One: Comparison of Cloud and Price (Support and resistance of cloud and price, to initially build the trend)
(1) When the price is above the cloud, it represents a bullish trend;
(2) When the price is below the cloud, it represents a bearish trend.
Especially when the price crosses the cloud from below, it represents the establishment of a bullish trend and can consider entering long positions; conversely, if it crosses the cloud from above, it represents the start of a bearish trend and can consider entering short positions.
Explanation using the 1-hour candlestick chart of ETH:
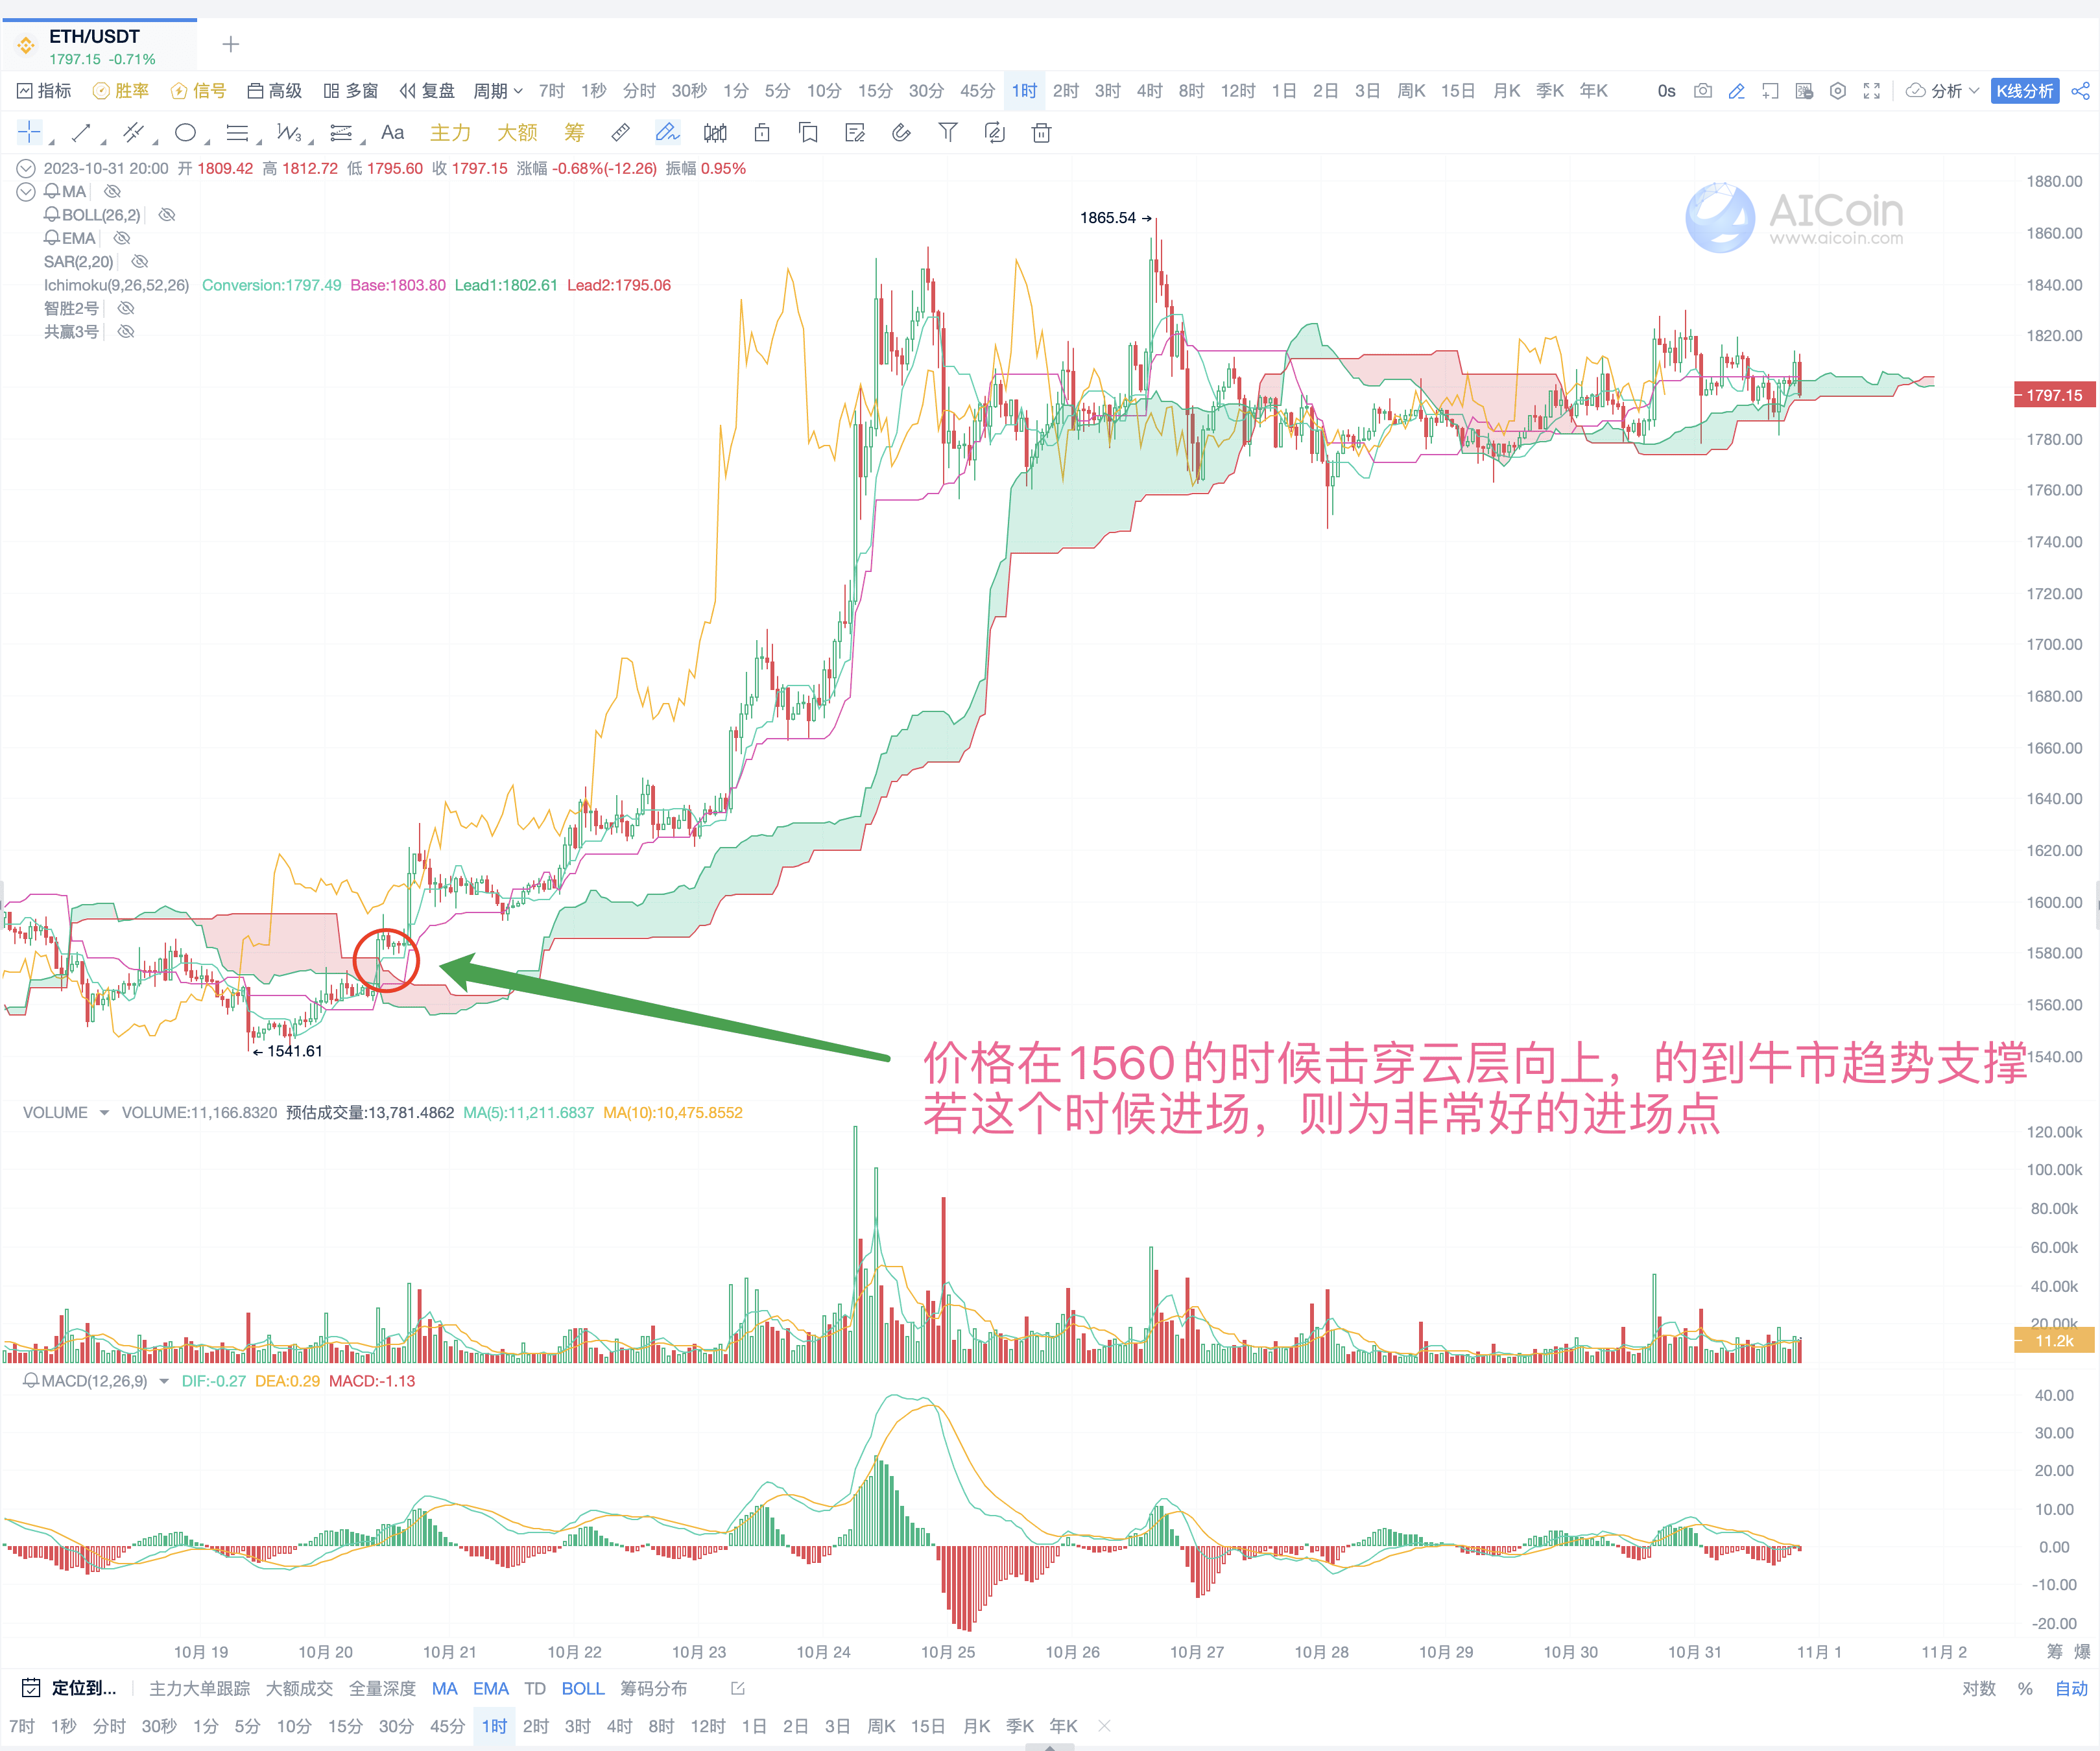
Note: If the price is within the cloud, it represents uncertainty, so it is advisable to wait and see.
2. Basic Strategy Two: Exploiting Signals of the Fast and Slow Lines
(1) When the price is above the cloud, it is a bullish trend;
(2) Combined with the characteristics of our fast and slow lines, in a bullish market, the golden cross is a buying opportunity, and the death cross is a closing opportunity (or wait for a significant profit-taking opportunity when the trend reverses).
Using ETH as an example, the support of this cloud for signal recognition is a long position entry opportunity.
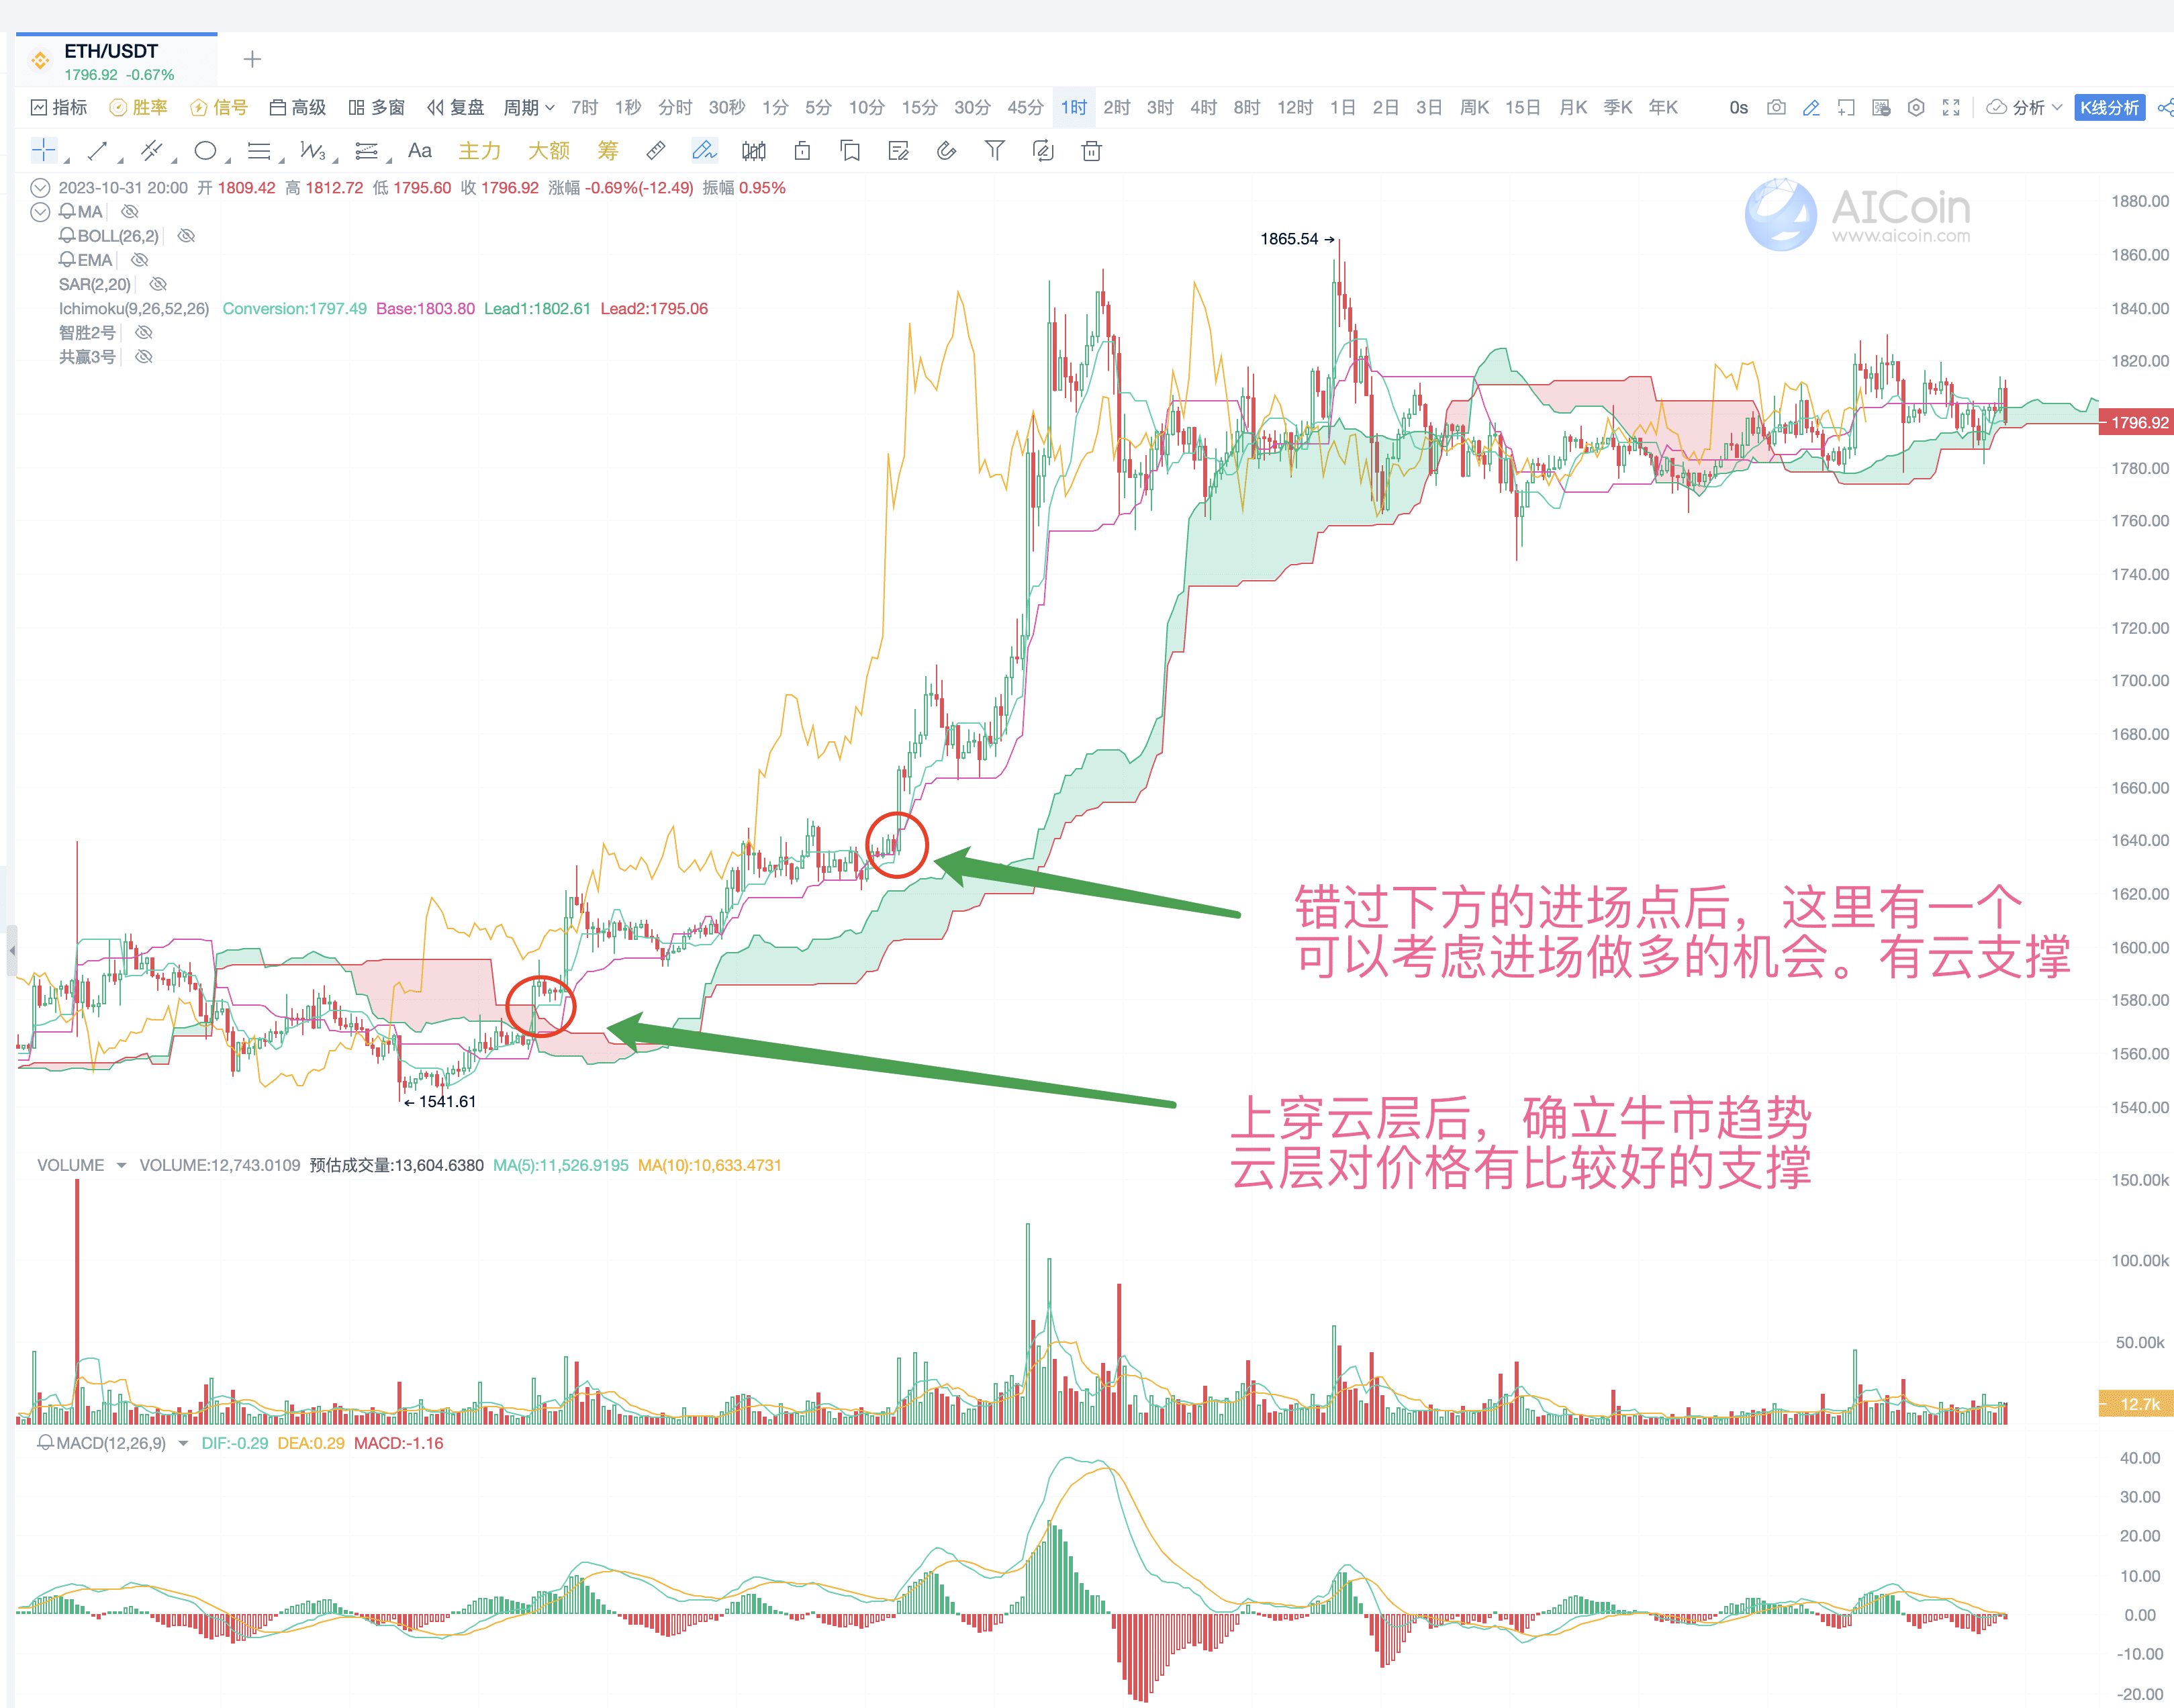
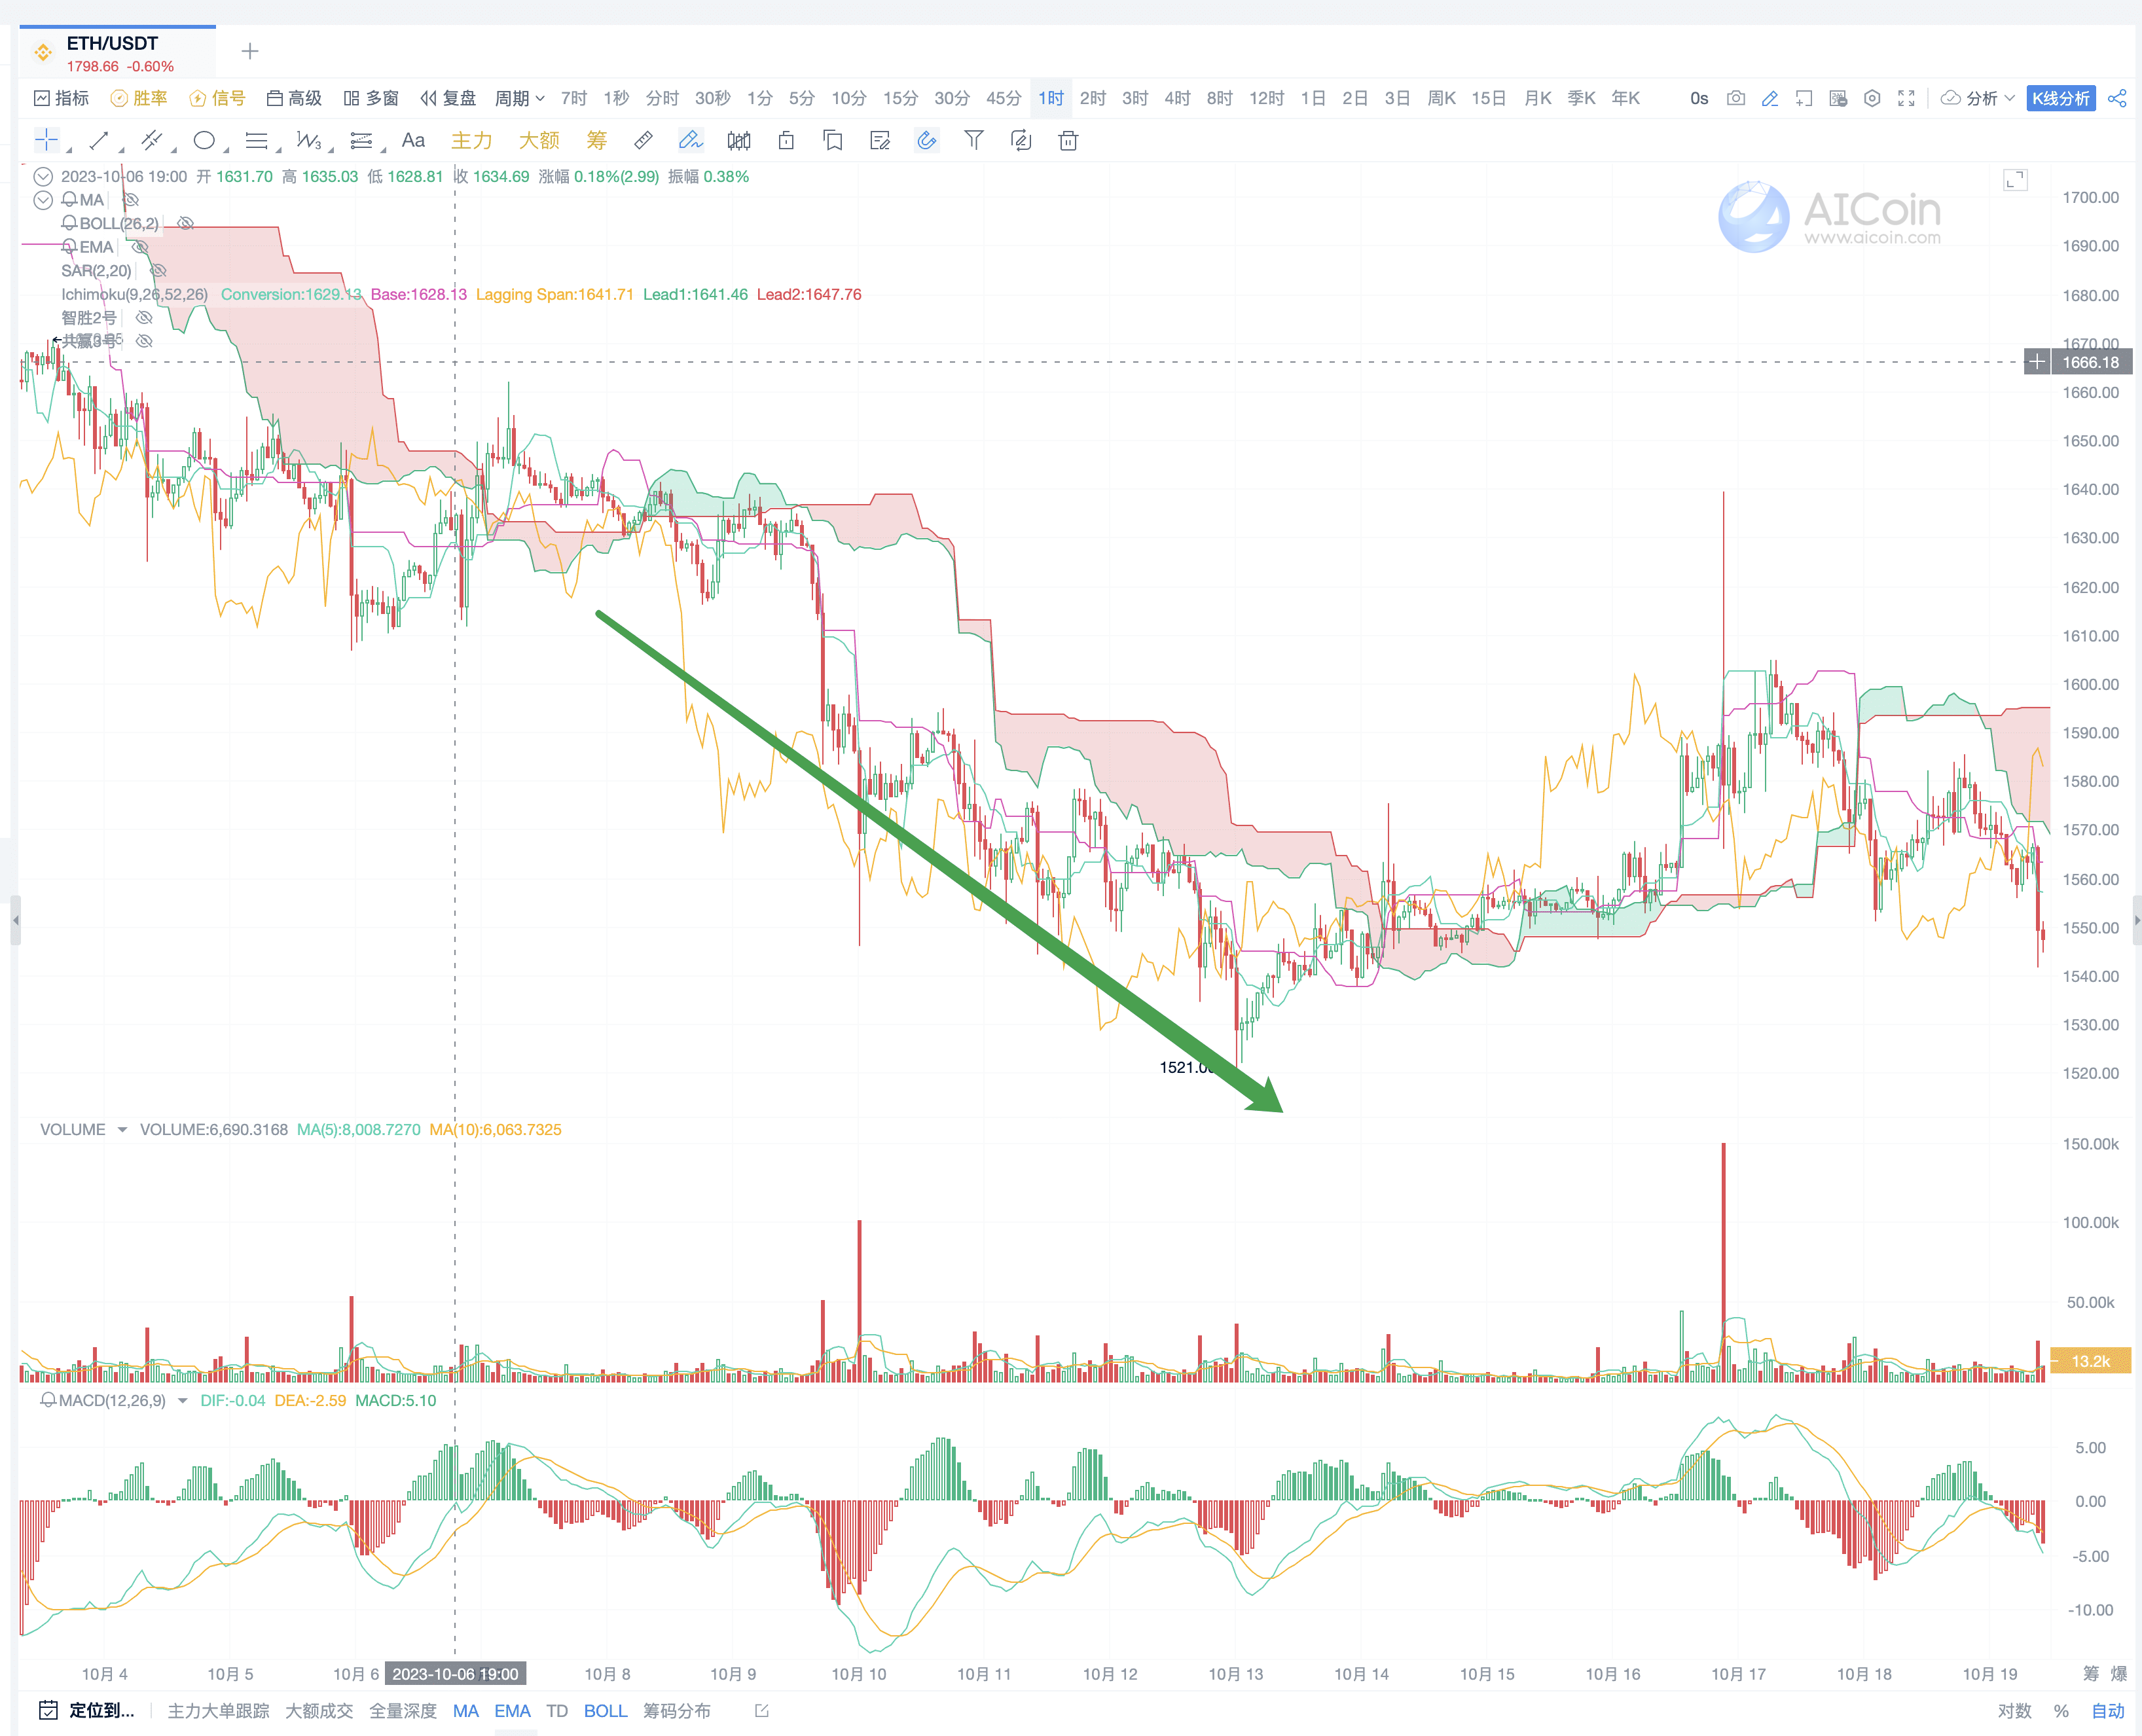
Similarly, there are many opportunities for short positions as well.
Advantages of the strategy: This set of indicators takes into account the support and resistance of the trend, as well as entry and exit points, strength, etc.; it can be operated within the same time period, and as for which time period, it can be decided based on one's own trading habits; to understand the time frame, you can refer to the review of the live broadcast explaining the cross-period trading system: following the major trend, countering the minor trend, and seeking breakthroughs.
3. Basic Strategy Three: Lagging Line
Using the strategy:
(1) When the lagging line is above the cloud, it represents a bullish trend;
(2) When the lagging line is below the cloud, it represents a bearish trend;
(3) If the lagging line is inside the cloud, it is advisable not to operate, because it's foggy inside the cloud and visibility is poor.
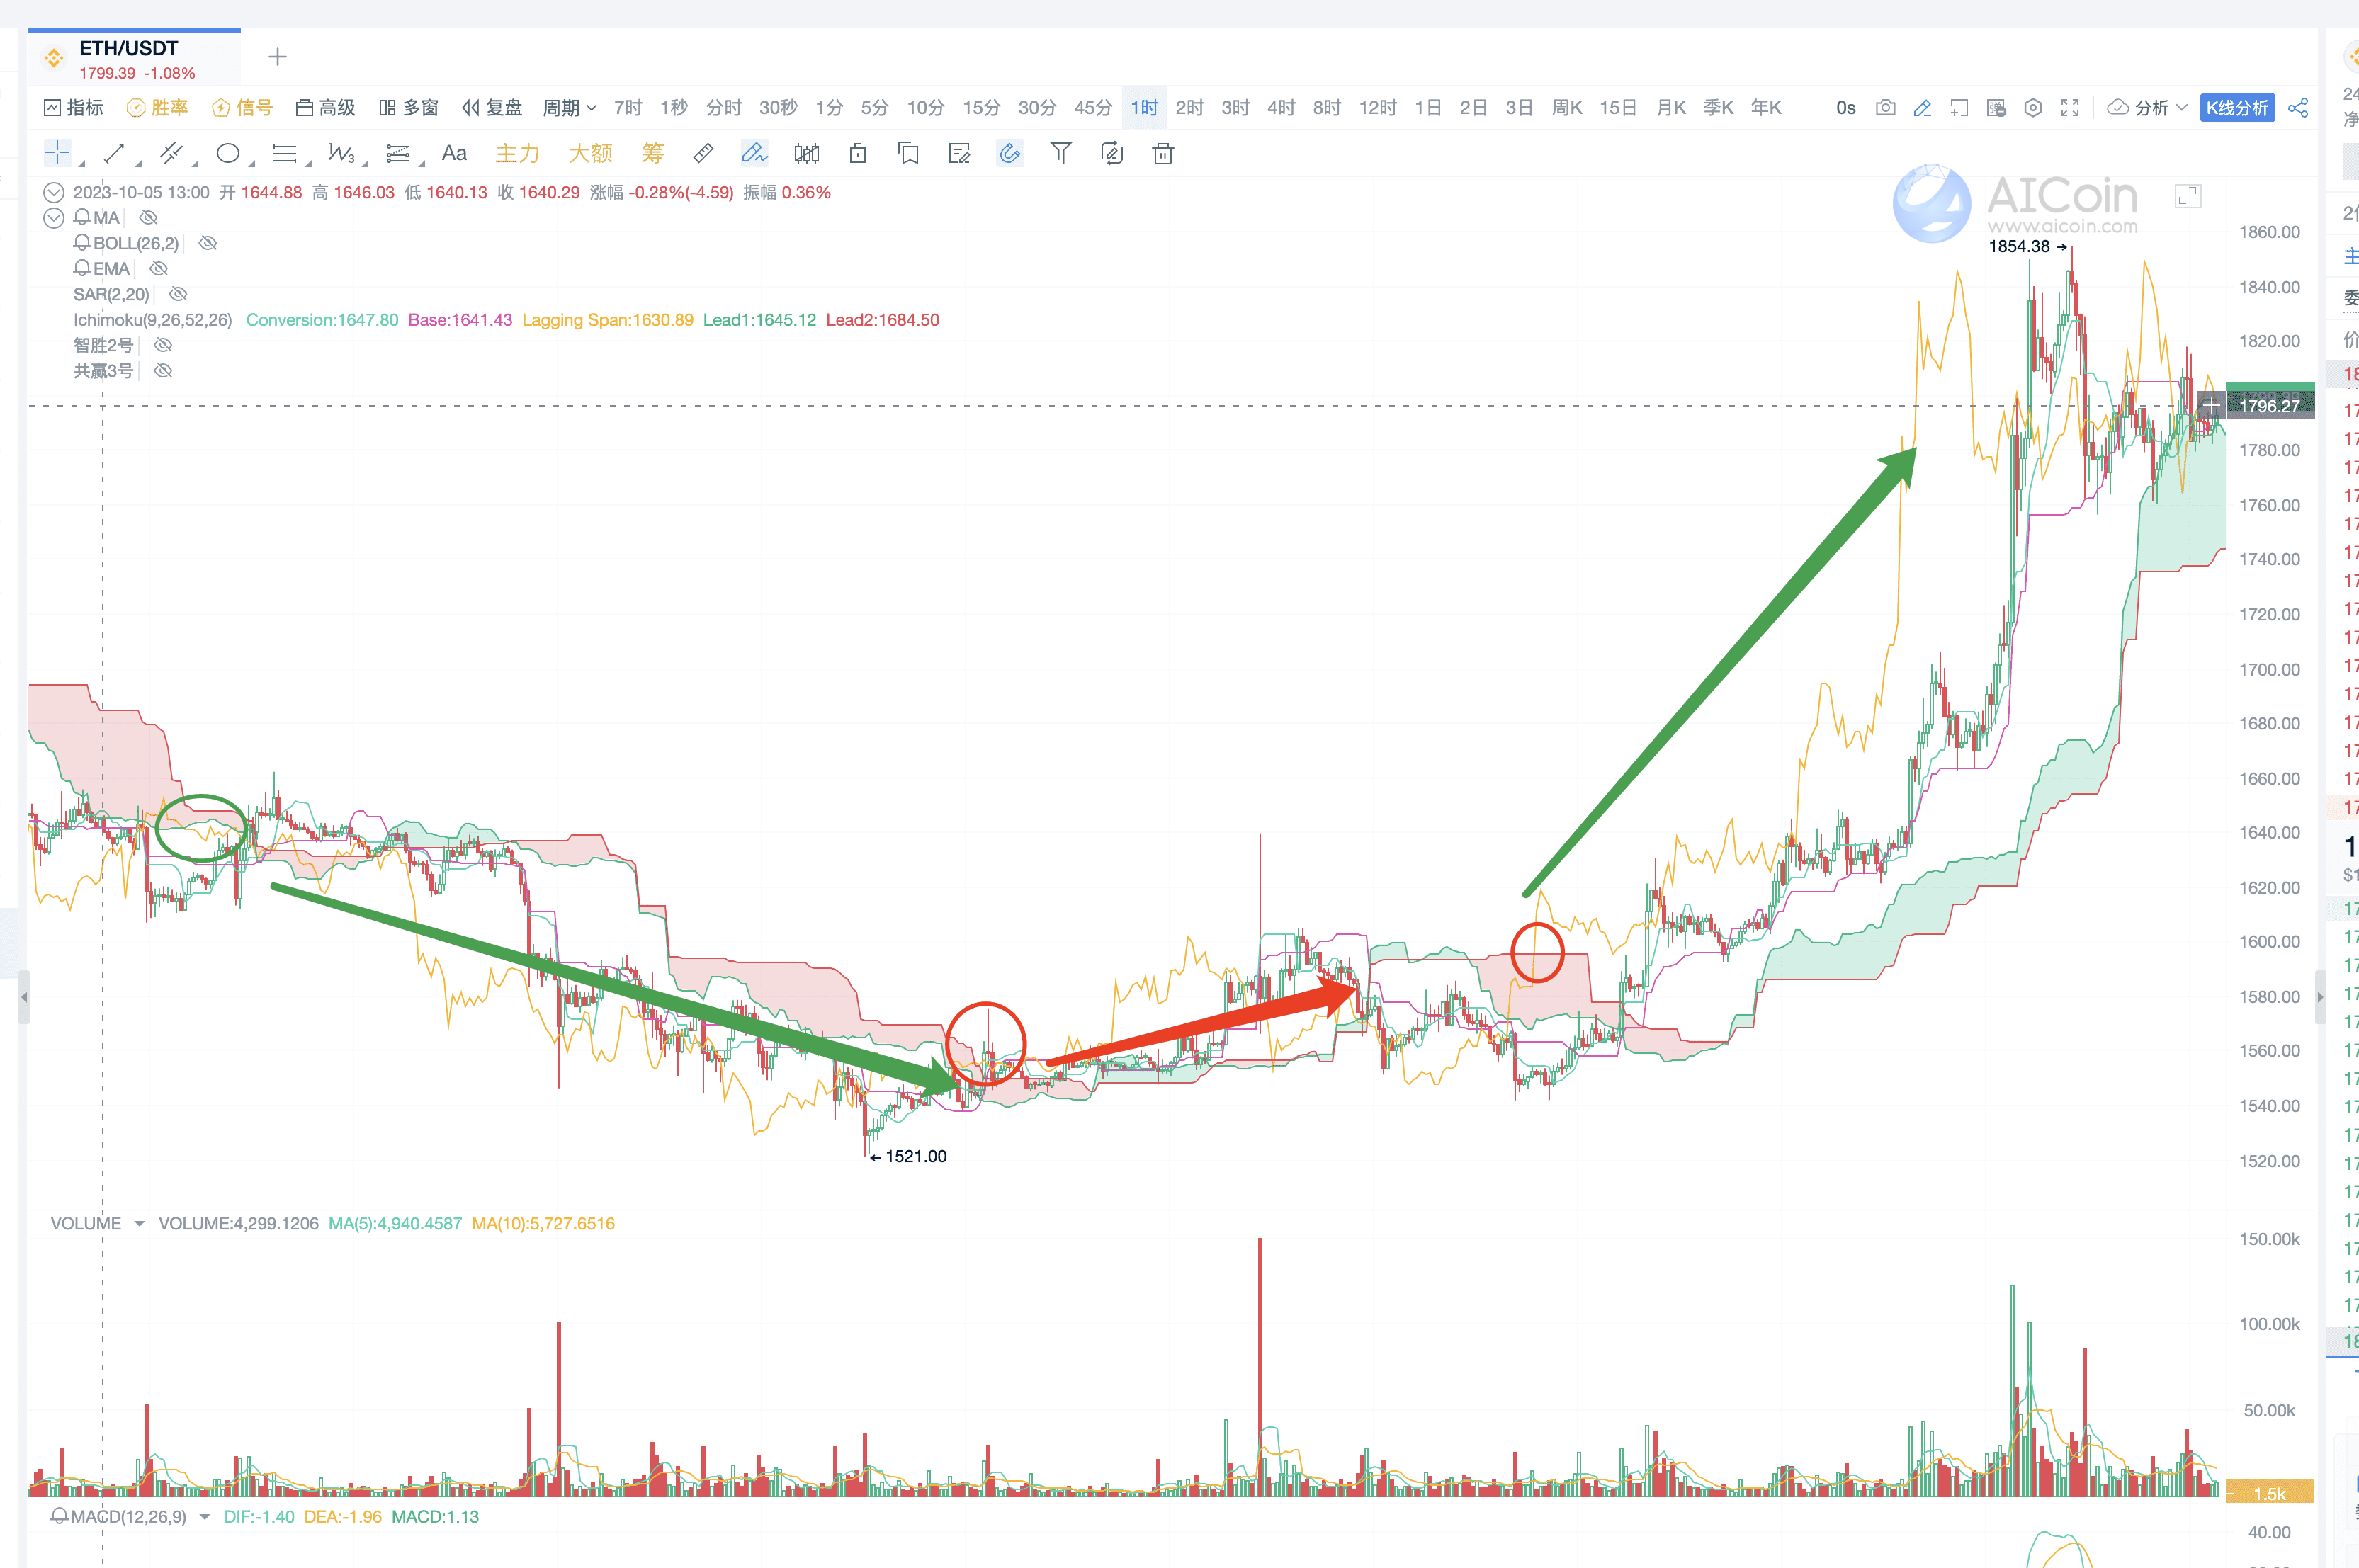
Therefore, bullish and bearish trends also have corresponding signals extended from here; the moment the lagging line crosses above the cloud represents the start of a bullish trend and can be bought here; when it crosses below, it represents a bearish trend and can be sold here.
For ETH analysis, the certainty of the lagging line is very high.
4. Concept of the Two Leading Spans
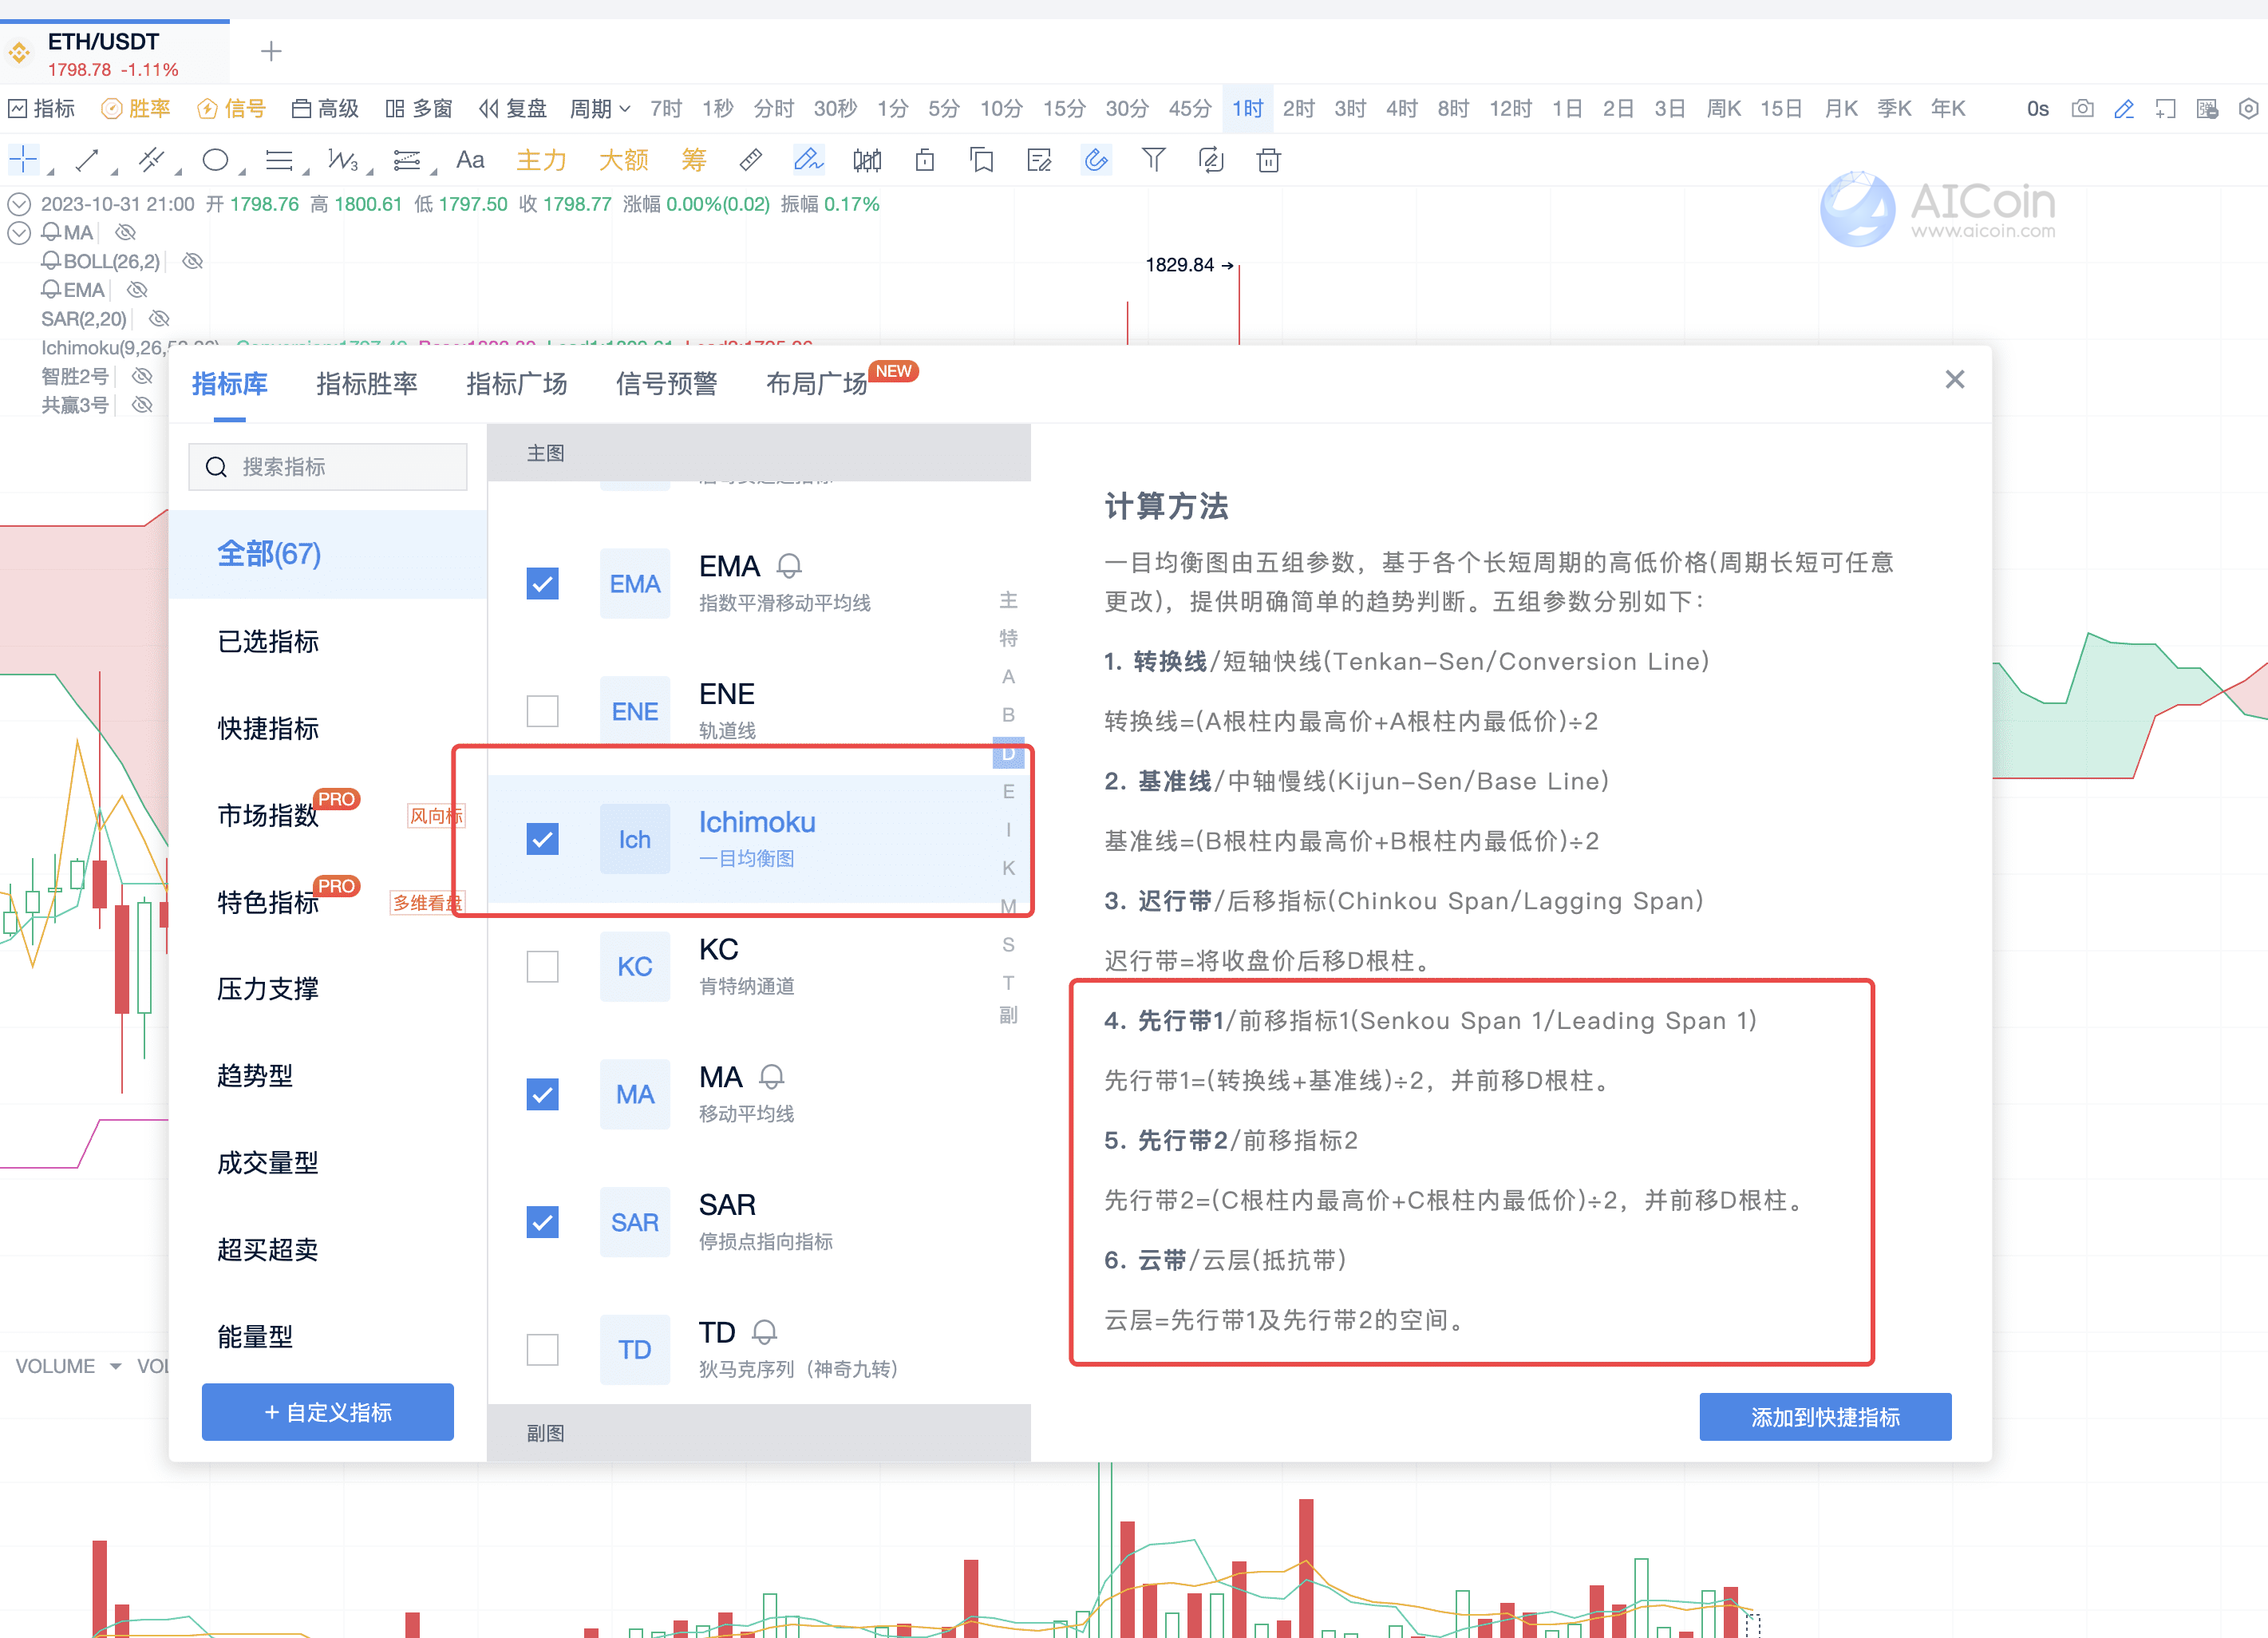 Leading Span 1: Front Cloud
The front cloud not only takes into account stability but also speed. Aggressive big players like to use the front cloud for market judgment.
Leading Span 2: Rear Cloud
After obtaining the stable and fast front cloud, the algorithm for extreme value processing is referenced, that is, extreme value processing is performed on a longer period (52 days) and then shifted 26 periods to the right, thus obtaining a more stable rear cloud.
Stay tuned: AICoin's Smart AI Assistant is online, and future explanations will cover the target profit and stop-loss setting for the Ichimoku chart.
If you want to try using the intelligent analysis of Little A and obtain PRO membership, please visit: https://aicoin.app/vip/chartpro
Recommended Reading
1. "Capturing Trend Market with SAR, 3 Signals to Grasp Reversal Points"
2. "A Trick to Identify High-Quality Shiba Inu Coins"
3. "Exploring Web3 Investment Opportunities, Mining Hot Coins"
For more live content, please follow AICoin's "News/Information-Live Review" section, and feel free to download AICoin PC End.
Leading Span 1: Front Cloud
The front cloud not only takes into account stability but also speed. Aggressive big players like to use the front cloud for market judgment.
Leading Span 2: Rear Cloud
After obtaining the stable and fast front cloud, the algorithm for extreme value processing is referenced, that is, extreme value processing is performed on a longer period (52 days) and then shifted 26 periods to the right, thus obtaining a more stable rear cloud.
Stay tuned: AICoin's Smart AI Assistant is online, and future explanations will cover the target profit and stop-loss setting for the Ichimoku chart.
If you want to try using the intelligent analysis of Little A and obtain PRO membership, please visit: https://aicoin.app/vip/chartpro
Recommended Reading
1. "Capturing Trend Market with SAR, 3 Signals to Grasp Reversal Points"
2. "A Trick to Identify High-Quality Shiba Inu Coins"
3. "Exploring Web3 Investment Opportunities, Mining Hot Coins"
For more live content, please follow AICoin's "News/Information-Live Review" section, and feel free to download AICoin PC End.免责声明:本文章仅代表作者个人观点,不代表本平台的立场和观点。本文章仅供信息分享,不构成对任何人的任何投资建议。用户与作者之间的任何争议,与本平台无关。如网页中刊载的文章或图片涉及侵权,请提供相关的权利证明和身份证明发送邮件到support@aicoin.com,本平台相关工作人员将会进行核查。


