Without a doubt, TRB became the star of the gainers' list again yesterday. In summary, the bulls made a profit, the bears were liquidated, and arbitrage was very profitable!
First, let's talk about the arbitrage situation with the least risk, where both types of arbitrage can generate profits.
Arbitrage of funding rates between spot and perpetual contracts has an annualized funding rate of an astonishing 3285%. DeFi's APY has never seen such a high rate. Settlement occurs every 8 hours, with a 3% profit three times a day, allowing for an arbitrage profit of around 12% over the past three days. With $10,000, you can achieve a risk-free profit of $1,200. Especially at midnight and 8 am last night, the funding rate reached its peak, providing an opportunity for arbitrage.
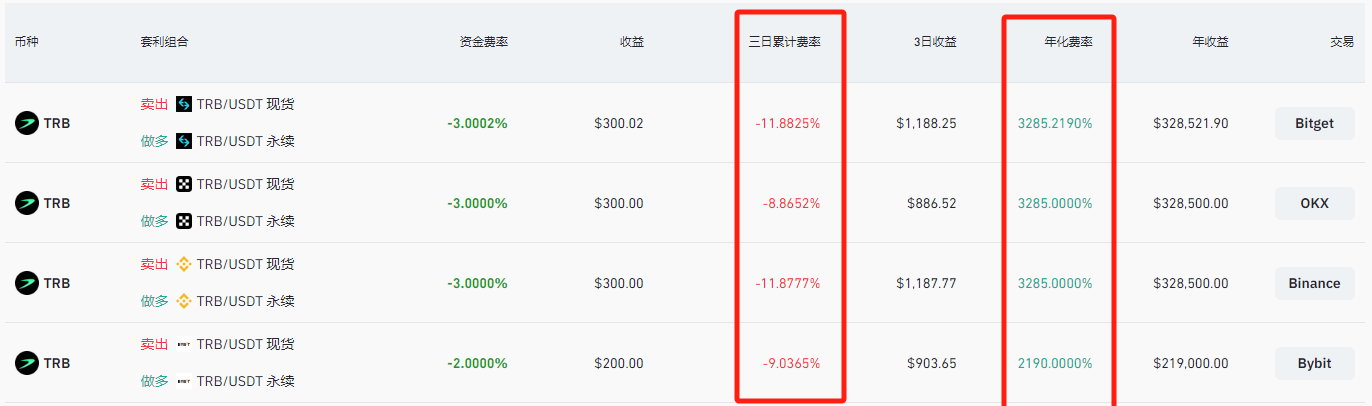
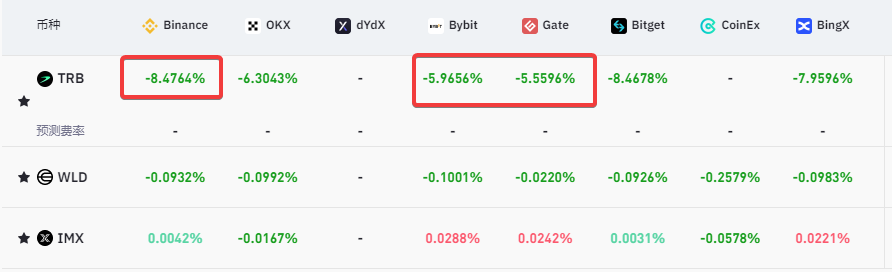
The second type is arbitrage between different exchanges based on funding rates. Over the past day, there has been an arbitrage space of around 3% between several exchanges. Arbitrage between different exchanges can be leveraged, meaning you can amplify the risk-free profit of 3 by 10 times or more. The difficulties and risks have been mentioned in previous articles and will not be discussed here.
Next, let's analyze TRB's position changes and other data.
It's quite rare that TRB has maintained a negative funding rate for a month. This indicates a long-term significant arbitrage space and price difference between futures and spot, with spot prices consistently higher than futures on the same exchange. Additionally, there are price differences between different exchanges, increasing the difficulty of arbitrage and meaning you cannot operate at market price. (For example, at the current price, there is a 0.3 price difference between TRB spot and contract prices on Binance, and a $1.2 price difference between Binance and OKEx's TRB perpetual contracts.)
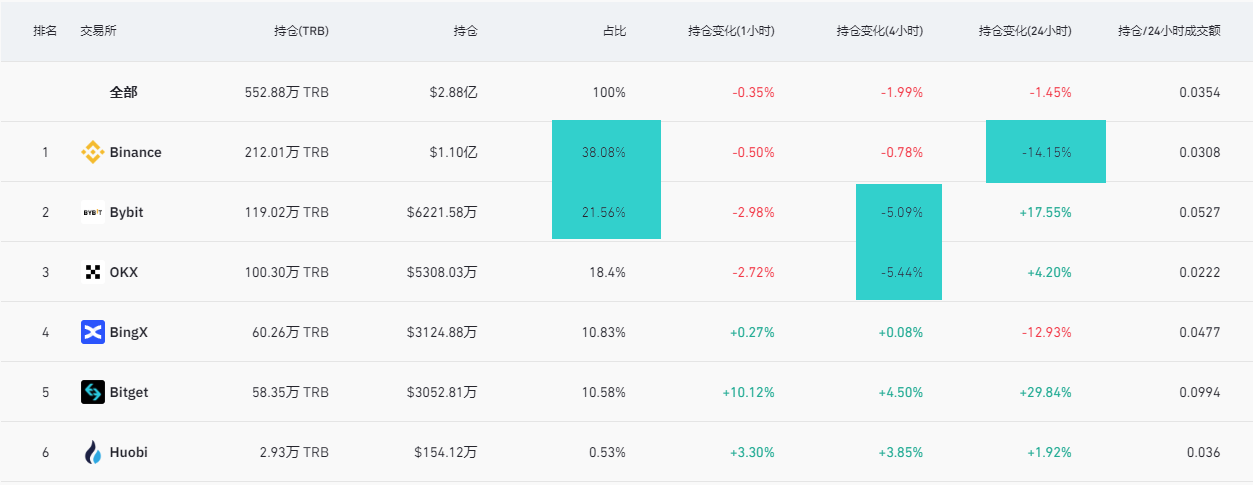
Due to the long-term rate difference between Bybit and other exchanges, the contract position ratio has reached 21.5%. Binance, OKEx, and Bybit have the highest TRB position ratios, reaching 80%. Currently, the TRB positions on these three major exchanges have significantly decreased.
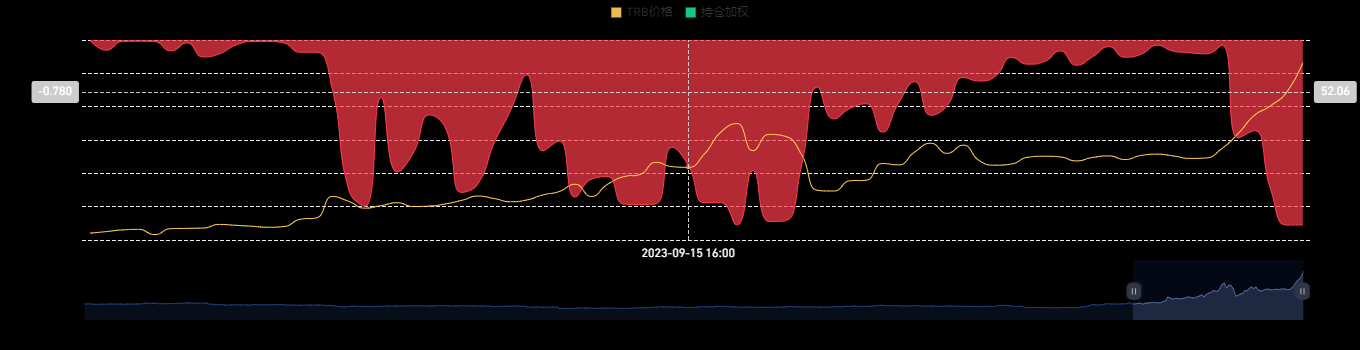
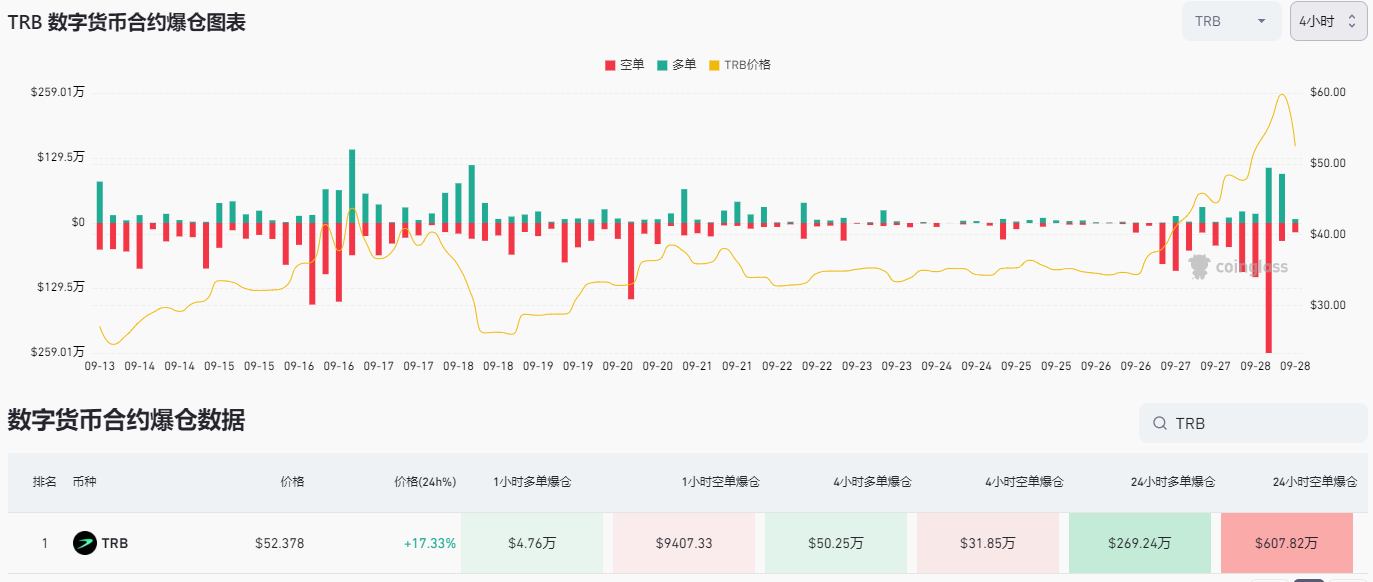
In the past 24 hours, TRB has risen by 17.3%. Long positions were liquidated for $6.07 million, while short positions were liquidated for only $2.69 million, with most of the short liquidations occurring after a recent price drop.
The liquidation heatmap shows that the high liquidity area is near $41, and potential liquidation levels are highly concentrated in a specific price range, indicating that the price may move towards that area.
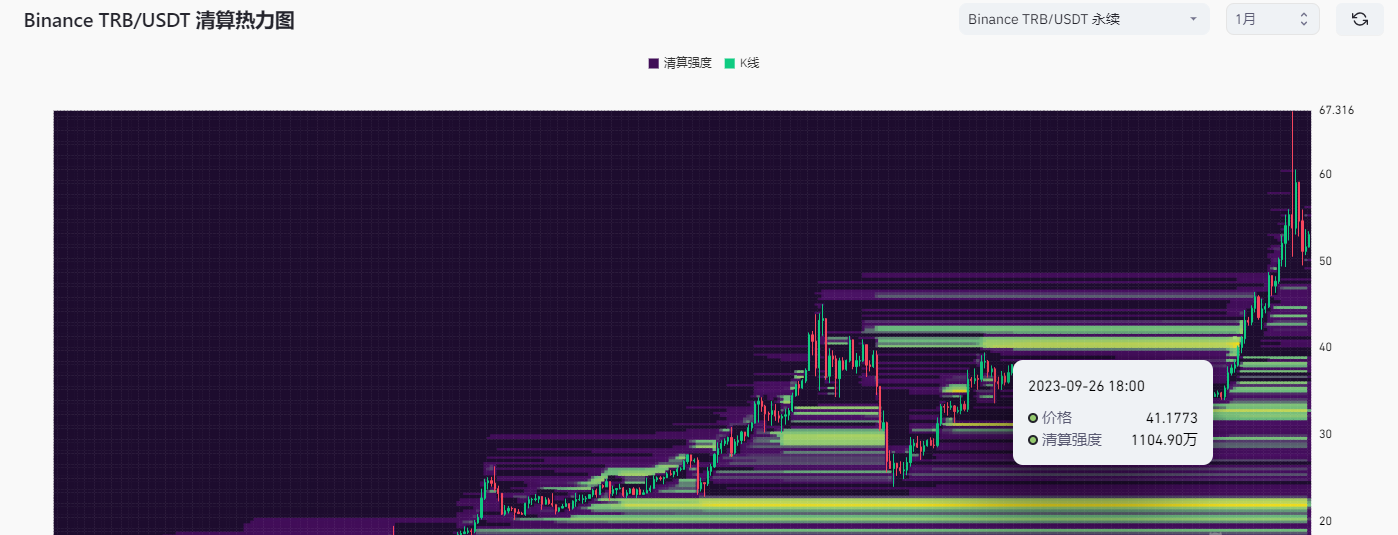
The VPVR shows a high liquidity range below $40. Given the significant decrease in positions, even below the high point on the 16th, the market is expected to continue to weaken, possibly returning to the high liquidity range. The previous high point around $43 may form support and resistance interchange.
For a weak market, we should pay attention to the resistance levels above. The liquidation map shows that chips are concentrated in the $54–$56 range. If a weak market appears in this area, characterized by short candlesticks and low trading volume, RSI divergence, etc., this resistance level may cause the price to drop to around $40.
Original link: https://t.co/raSBeMRAIx
Note: All content represents the author's personal views and is not investment advice. It should not be interpreted in any way as tax, accounting, legal, business, financial, or regulatory advice. Before making any investment decisions, you should seek independent legal and financial advice, including advice on tax consequences.
For more content, follow: KeplerResearch on WeChat and @kepler008 on Twitter.
免责声明:本文章仅代表作者个人观点,不代表本平台的立场和观点。本文章仅供信息分享,不构成对任何人的任何投资建议。用户与作者之间的任何争议,与本平台无关。如网页中刊载的文章或图片涉及侵权,请提供相关的权利证明和身份证明发送邮件到support@aicoin.com,本平台相关工作人员将会进行核查。


