On the evening of September 26th, AICoin researchers conducted a live graphic and textual sharing on "MACD Signals and Fibonacci" in the AICoin PC End-Group Chat-Live. Here is a summary of the live content.
Classic Usage 1: DIF Crossing Zero Axis Strategy
Indicator Selection: DIF line of MACD
Period Selection: 15 minutes, 45 minutes, 1 hour, 4 hours, 8 hours
Usage Maxim: DIF crossing above zero axis indicates bullish trend; DIF crossing below zero axis indicates bearish trend
1. Example: Using 15-minute ETH for illustration
Bullish Example

Bearish Example

2. Auxiliary Analysis of ETH with Combined Indicators - Chip and Fibonacci
First, Chip Distribution
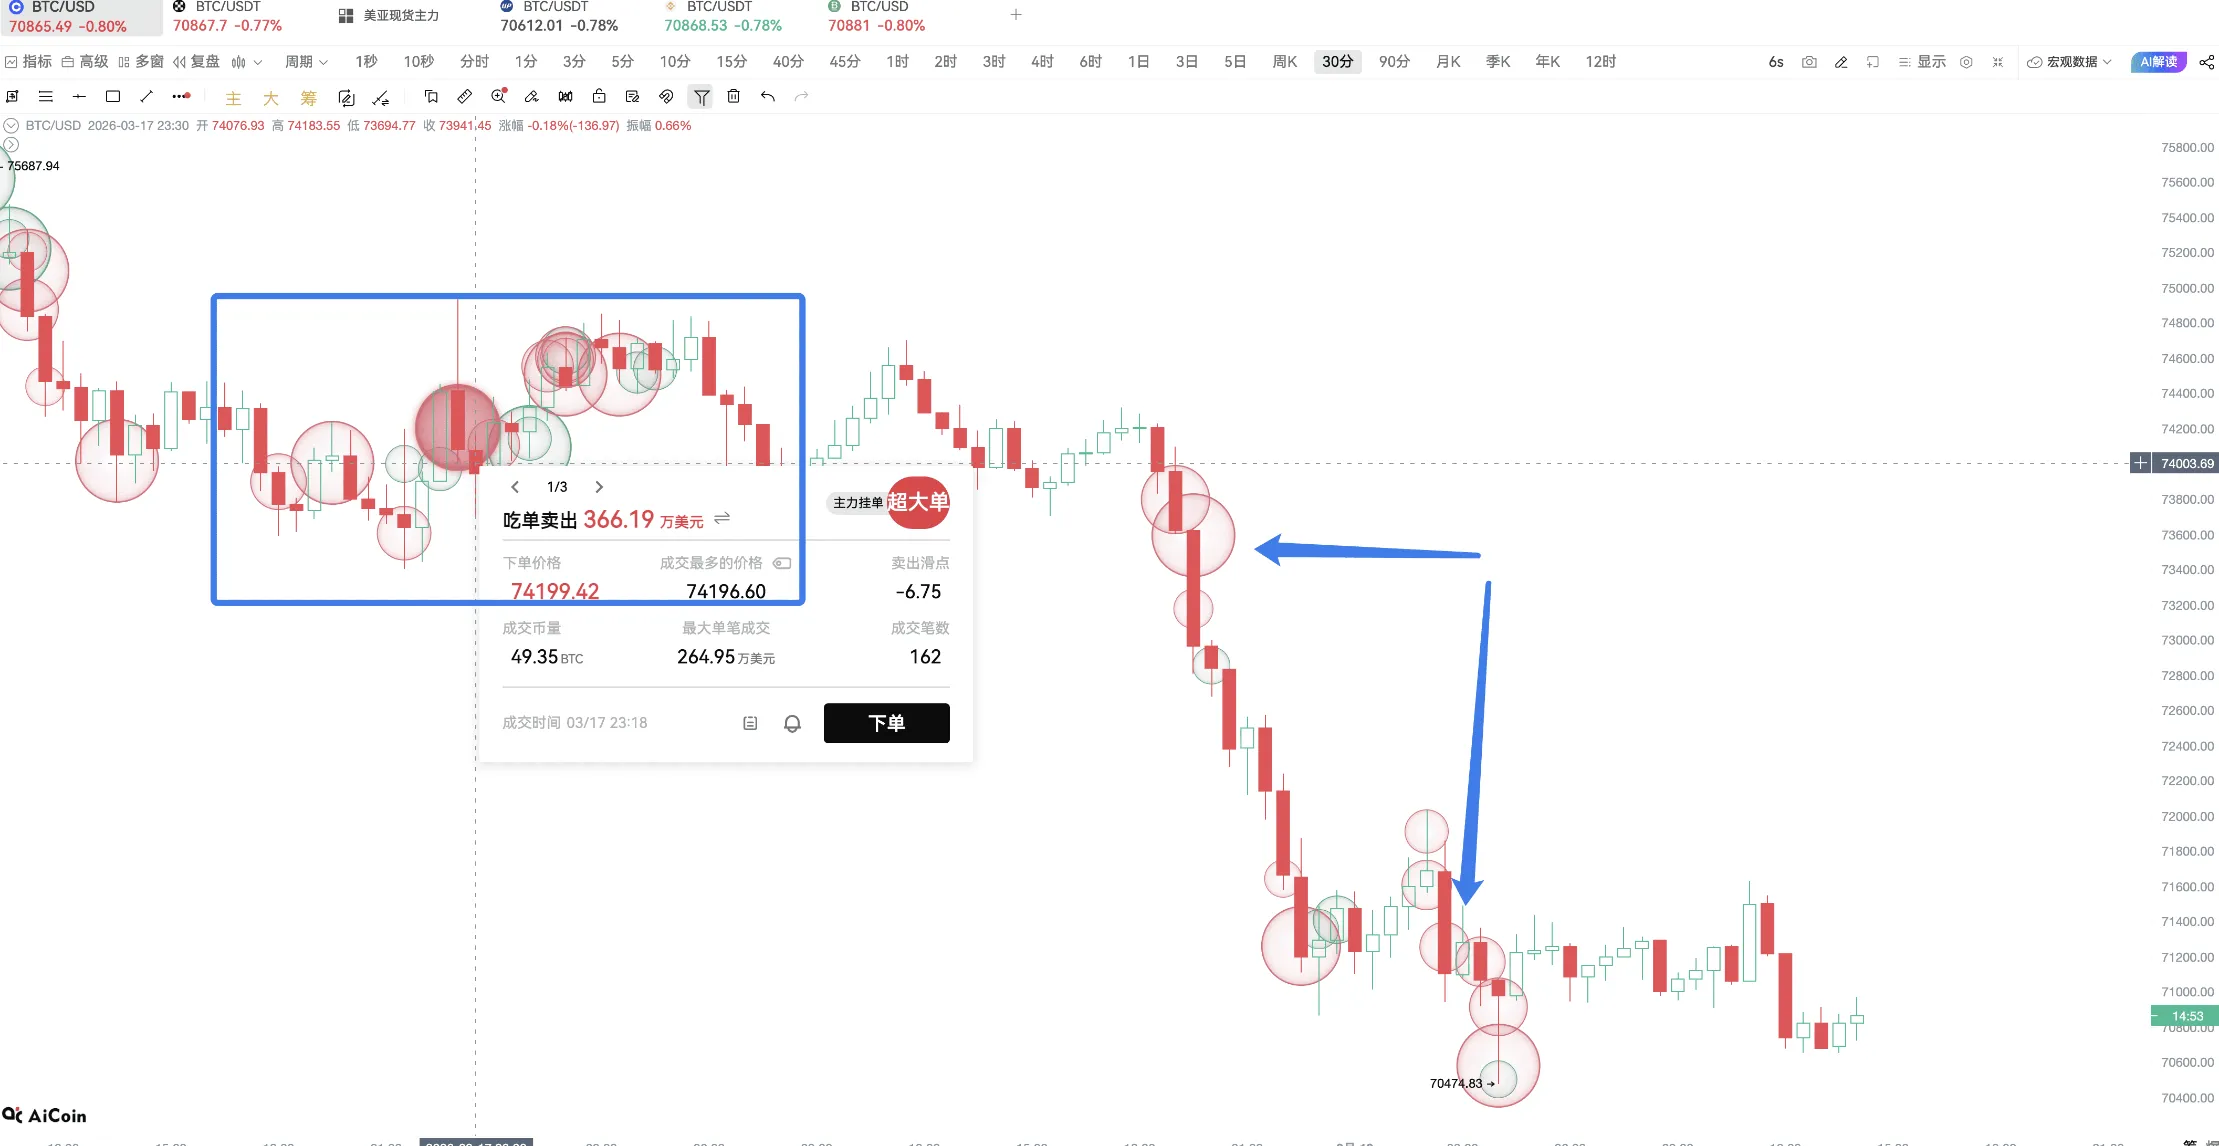
Taking ETH as an example, in the following image, ETH is suppressed by the chip peak, and the market is striving to hold this strong position.

In the 15-minute ETH chart below, if this position is not held, it will move towards another chip peak position below.

Chip distribution truly reflects the market's fund situation. Combined with trend indicators like MACD, it has a very high success rate.
Get the same chip: https://aicoin.app/vip/chartpro
Second, Fibonacci Retracement Lines
1. Select to use Fibonacci lines.

2. Draw Fibonacci - Connect the lowest and highest points of this trend.

3. Why not select the previous low point as the lowest point of Fibonacci?

The reason is simple, because its downtrend has not ended yet. According to judgment, the reversal of this trend is because the DIF line has not started to cross above the 0 axis. After crossing above the 0 axis, it will be an opportunity to look for a bullish trend.
4. The Fibonacci low point can be considered as the low point before the DIF line crosses above the 0 axis.

- Reasons for not moving at this position by combining the Fibonacci retracement analysis

Explanation: This upward trend is still relatively strong. Returning to 0.382 can stop it. Analysis: In this 15-minute period, we can continue to focus on the opportunity for the DIF to cross above the 0 axis. If it crosses near 0.382, it is a good entry opportunity.
Stop-loss point: The stop-loss point is selected at the low point of this oscillation range.
6. The latest real-time attention, Fibonacci and MACD's DIF zero axis situation, as expected, may cross above the 0 axis, which we can pay more attention to.

The signal recognition of the DIF line, combined with the use of indicators, ends here. AICoin provides chip support to identify support and resistance, and provides Fibonacci to identify support and resistance.
Classic Usage 2: MACD Divergence Signal Points
Usage Maxim: When the trend of the k-line peaks higher and higher, but the trend of MACD peaks lower and lower, it is a top divergence; when the trend of the k-line peaks lower and lower, but the trend of MACD peaks higher and higher, it is a bottom divergence.
Conclusion: Bottom divergence indicates bullish trend; top divergence indicates bearish trend.
Signal Characteristics: Divergence is actually a signal that leans a little to the left, because the price is still moving in the original direction, but the indicator has started to reverse.
Combining MACD Divergence Signal Analysis with ETH

In fact, in the 4-hour period, ETH is in the stage of bottom divergence.

Signal alerts can display divergence signals on the k-line and support alerts, making it easy for you to identify divergence signals: https://aicoin.app/vip/signal
3. Q&A Session
1. What is the value of the MACD moving period?
The recommended parameters here are default, 12, 26, 9.
2. How to obtain the lowest and highest points?
The choice of low and high points generally only requires selecting the lowest point of a trend, and it is preferable to use the shadow.
3. Do I need to be a member to see the chip distribution?
Chip distribution is very useful and is an important indicator for identifying market support and pressure. If you haven't used it before, there should be a one-week free trial available. You can try it out.
4. Where can I see the DIF?
In the upper left corner of the indicator library, select the MACD indicator, and the green line is the DIF line.
5. Where can I find the bottom and top divergence signals?
Divergence signals are available to signal alert members.
Recommended Reading
Perfect Combination of Indicators, Chip Distribution, and Fibonacci Sequence
Enhancing Entry Confidence with MA Signals and Fibonacci Mutual Verification
Trend Trading Strategy for 45-Minute Periods, Easily Capturing Market Trends
For more live content, please follow AICoin's "News/Information-Live Review" section. Feel free to download AICoin PC End.
免责声明:本文章仅代表作者个人观点,不代表本平台的立场和观点。本文章仅供信息分享,不构成对任何人的任何投资建议。用户与作者之间的任何争议,与本平台无关。如网页中刊载的文章或图片涉及侵权,请提供相关的权利证明和身份证明发送邮件到support@aicoin.com,本平台相关工作人员将会进行核查。