Important Note: Update AICoin PC version (V2.7.10) or above: https://a1coin.info/zh-CN/download, and you can experience the liquidation chart.
1 What is a Liquidation Chart
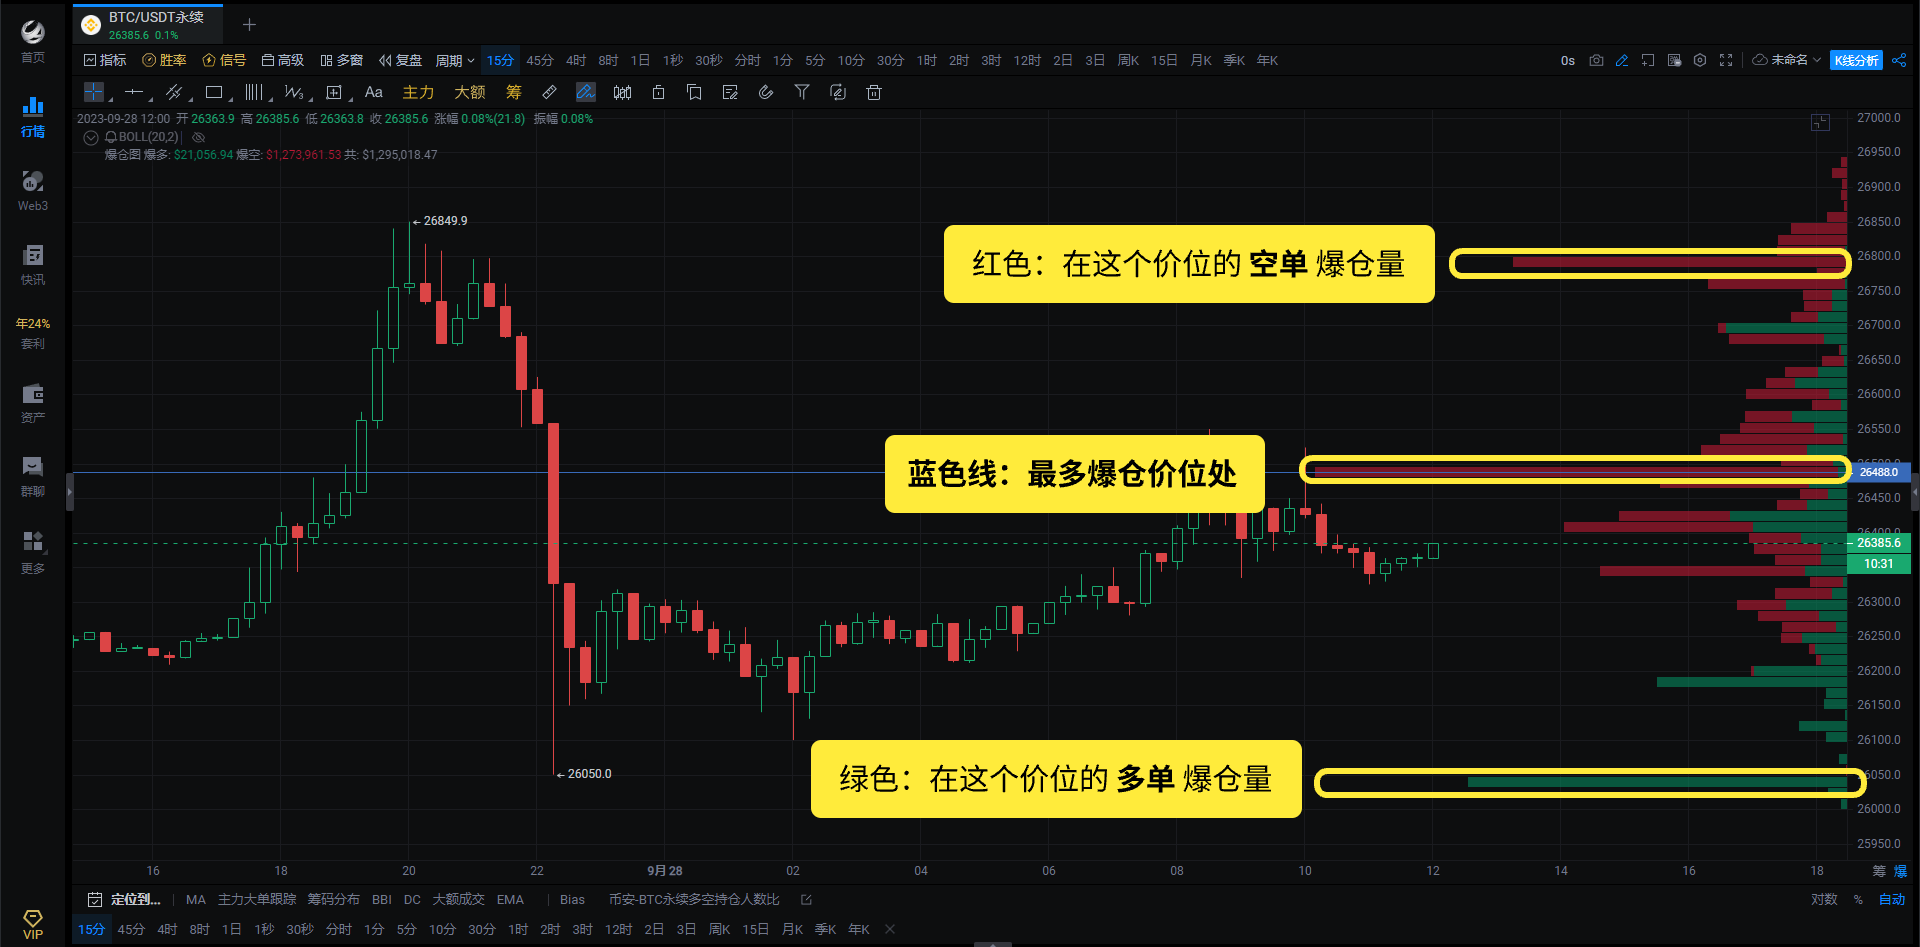
The liquidation chart is based on the statistical data of the AICoin team, displaying the liquidation volume of a certain currency's contract (valued in USD) at different time periods such as nearly 1 hour, 4 hours, 24 hours, etc., according to price distribution. Through the liquidation chart, you can easily observe the liquidation data at different price levels and distinguish whether it is a long position or a short position liquidation.
*Currently only supports USDT spot or USDT perpetual trading pairs for BTC and ETH

2 How to Use the Liquidation Chart
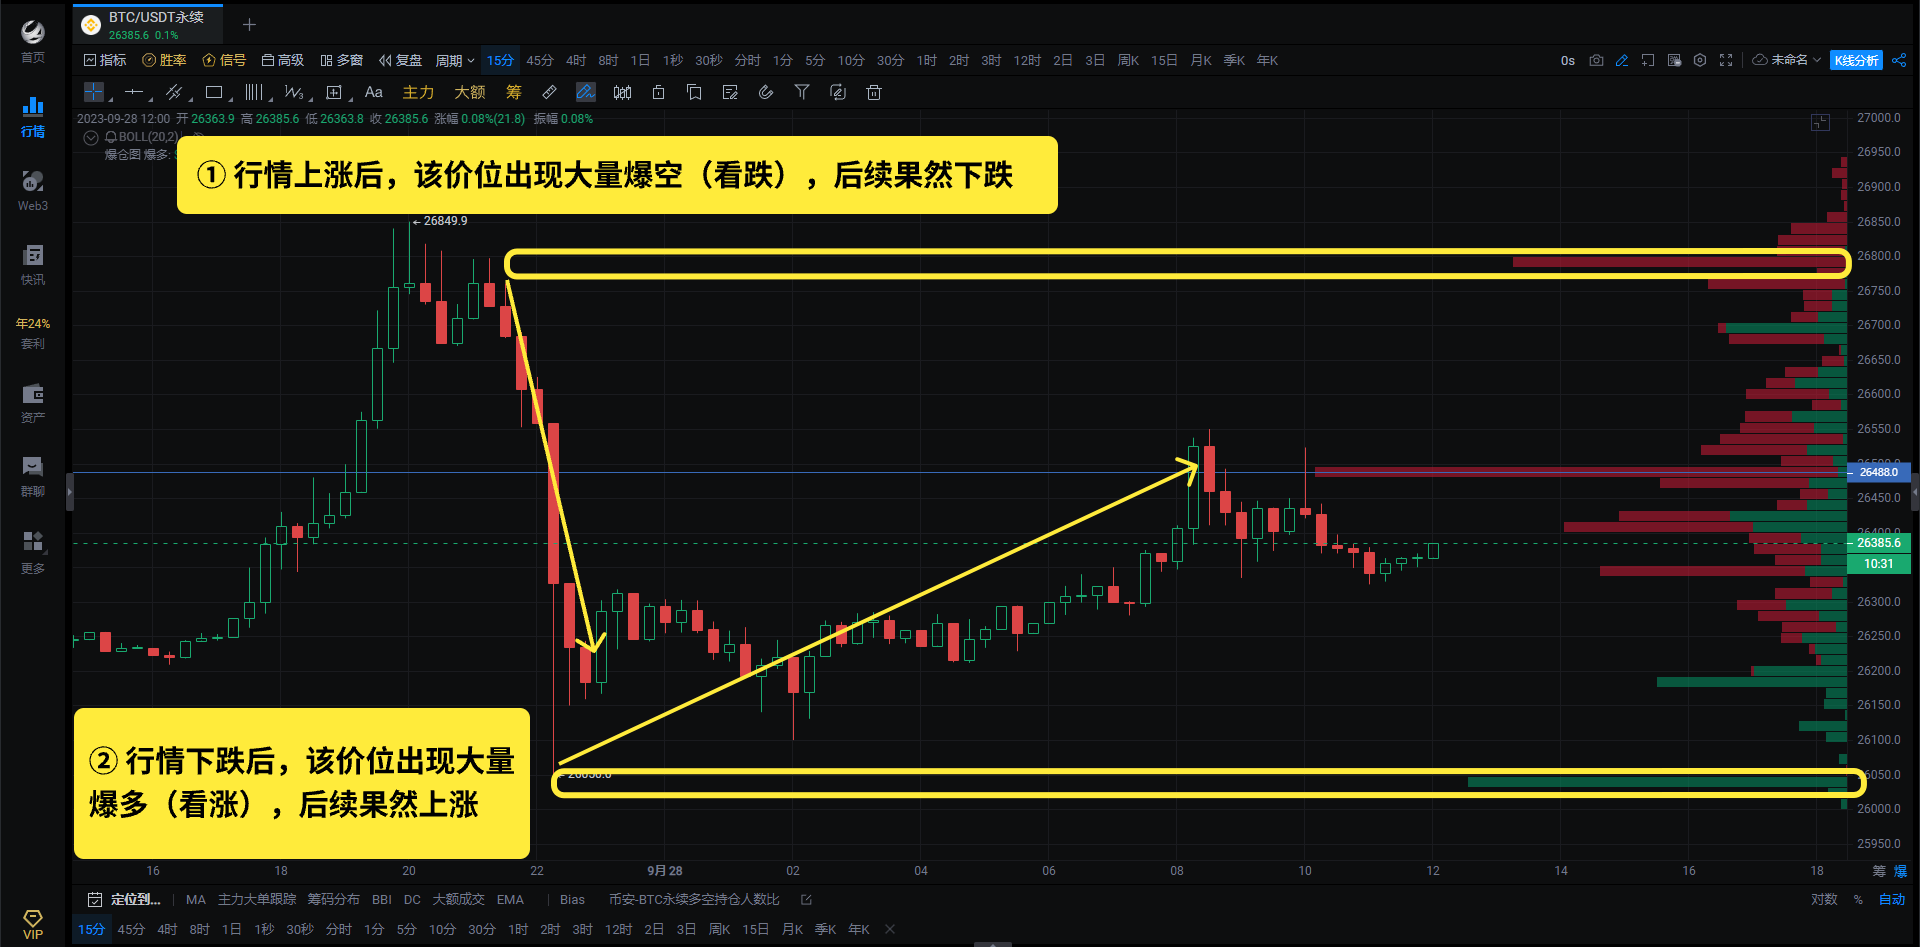
The liquidation chart can be used for identifying market reversals:
- When the price is falling, after a large number of long positions are liquidated, the price often reverses and rises.
- When the price is rising, after a large number of short positions are liquidated, the price often reverses and falls.

3 How to Set Up the Liquidation Chart
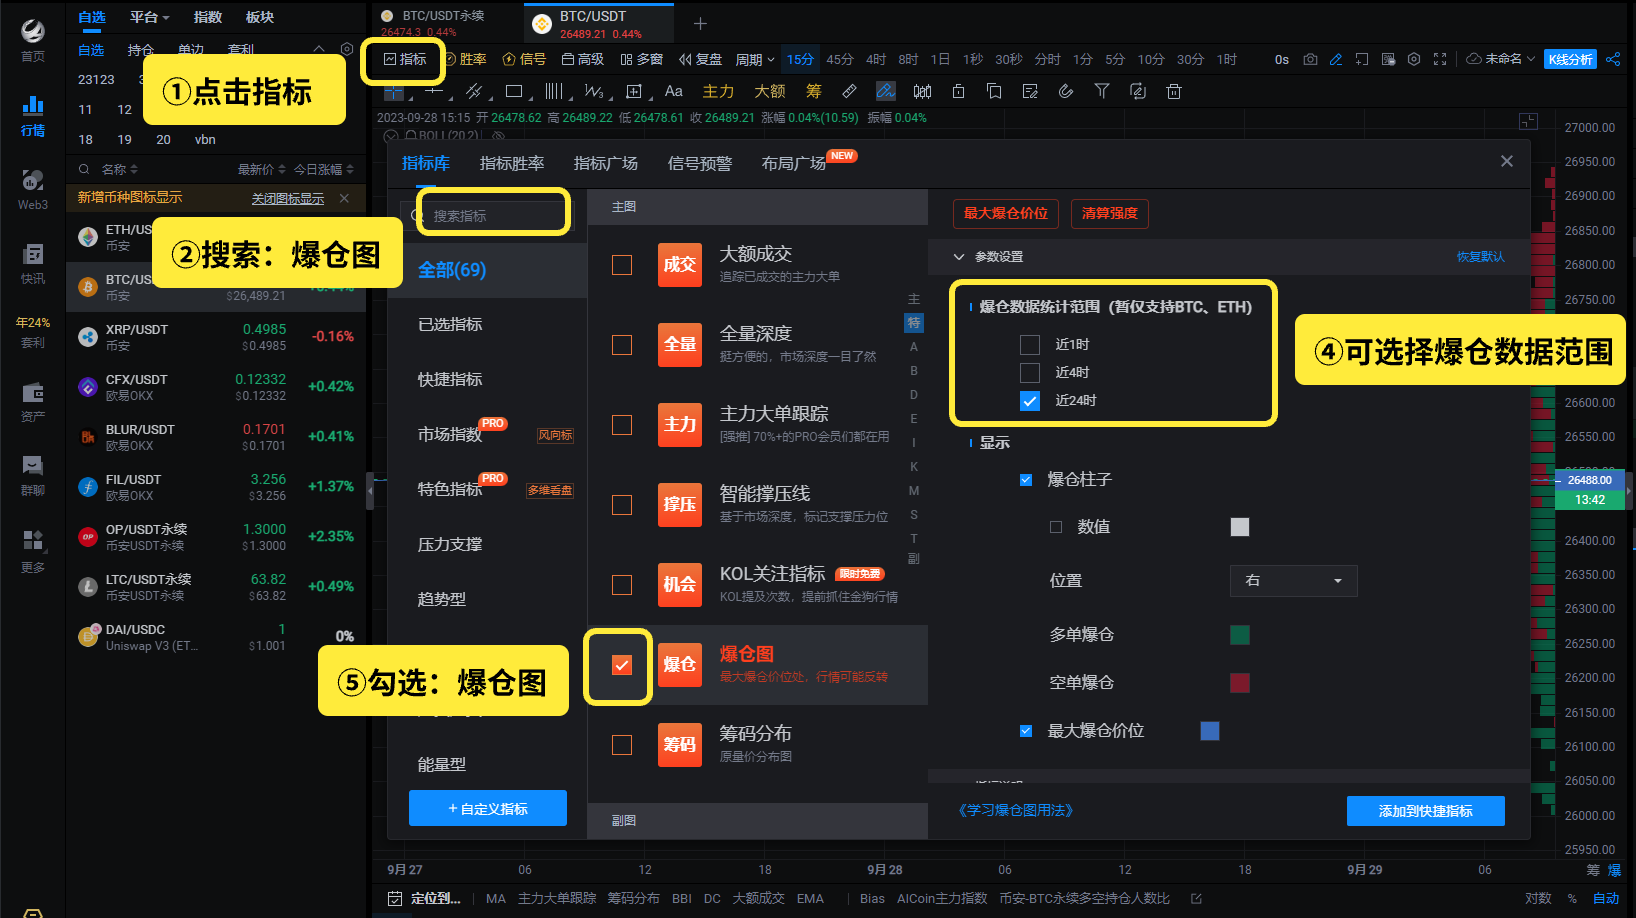
Click on [PC End-Indicators-Search for Liquidation Chart] to use

Sometimes, trading is just a simple matter. With the liquidation chart, you will have more trading opportunities.
If you are interested in the liquidation chart, you can open a PRO membership to try it out: https://aicoin.app/vip/chartpro
The PRO version of K-line is a toolset specially developed for traders, containing 30+ exclusive benefits, and we are constantly adding new exclusive benefits according to market demand.
免责声明:本文章仅代表作者个人观点,不代表本平台的立场和观点。本文章仅供信息分享,不构成对任何人的任何投资建议。用户与作者之间的任何争议,与本平台无关。如网页中刊载的文章或图片涉及侵权,请提供相关的权利证明和身份证明发送邮件到support@aicoin.com,本平台相关工作人员将会进行核查。


