On the evening of September 19th, AICoin researchers conducted a live graphic and text sharing session on "EMA Signals and Fibonacci" in the AICoin PC-end Group Chat Live. Here is a summary of the live content.
I. EMA Signal
(1) Last week, the research institute shared content related to "MA Signals and Fibonacci"
In-depth analysis: https://aicoin.app/article/365513.html
MA signals are effective on the 15-minute and 45-minute charts.
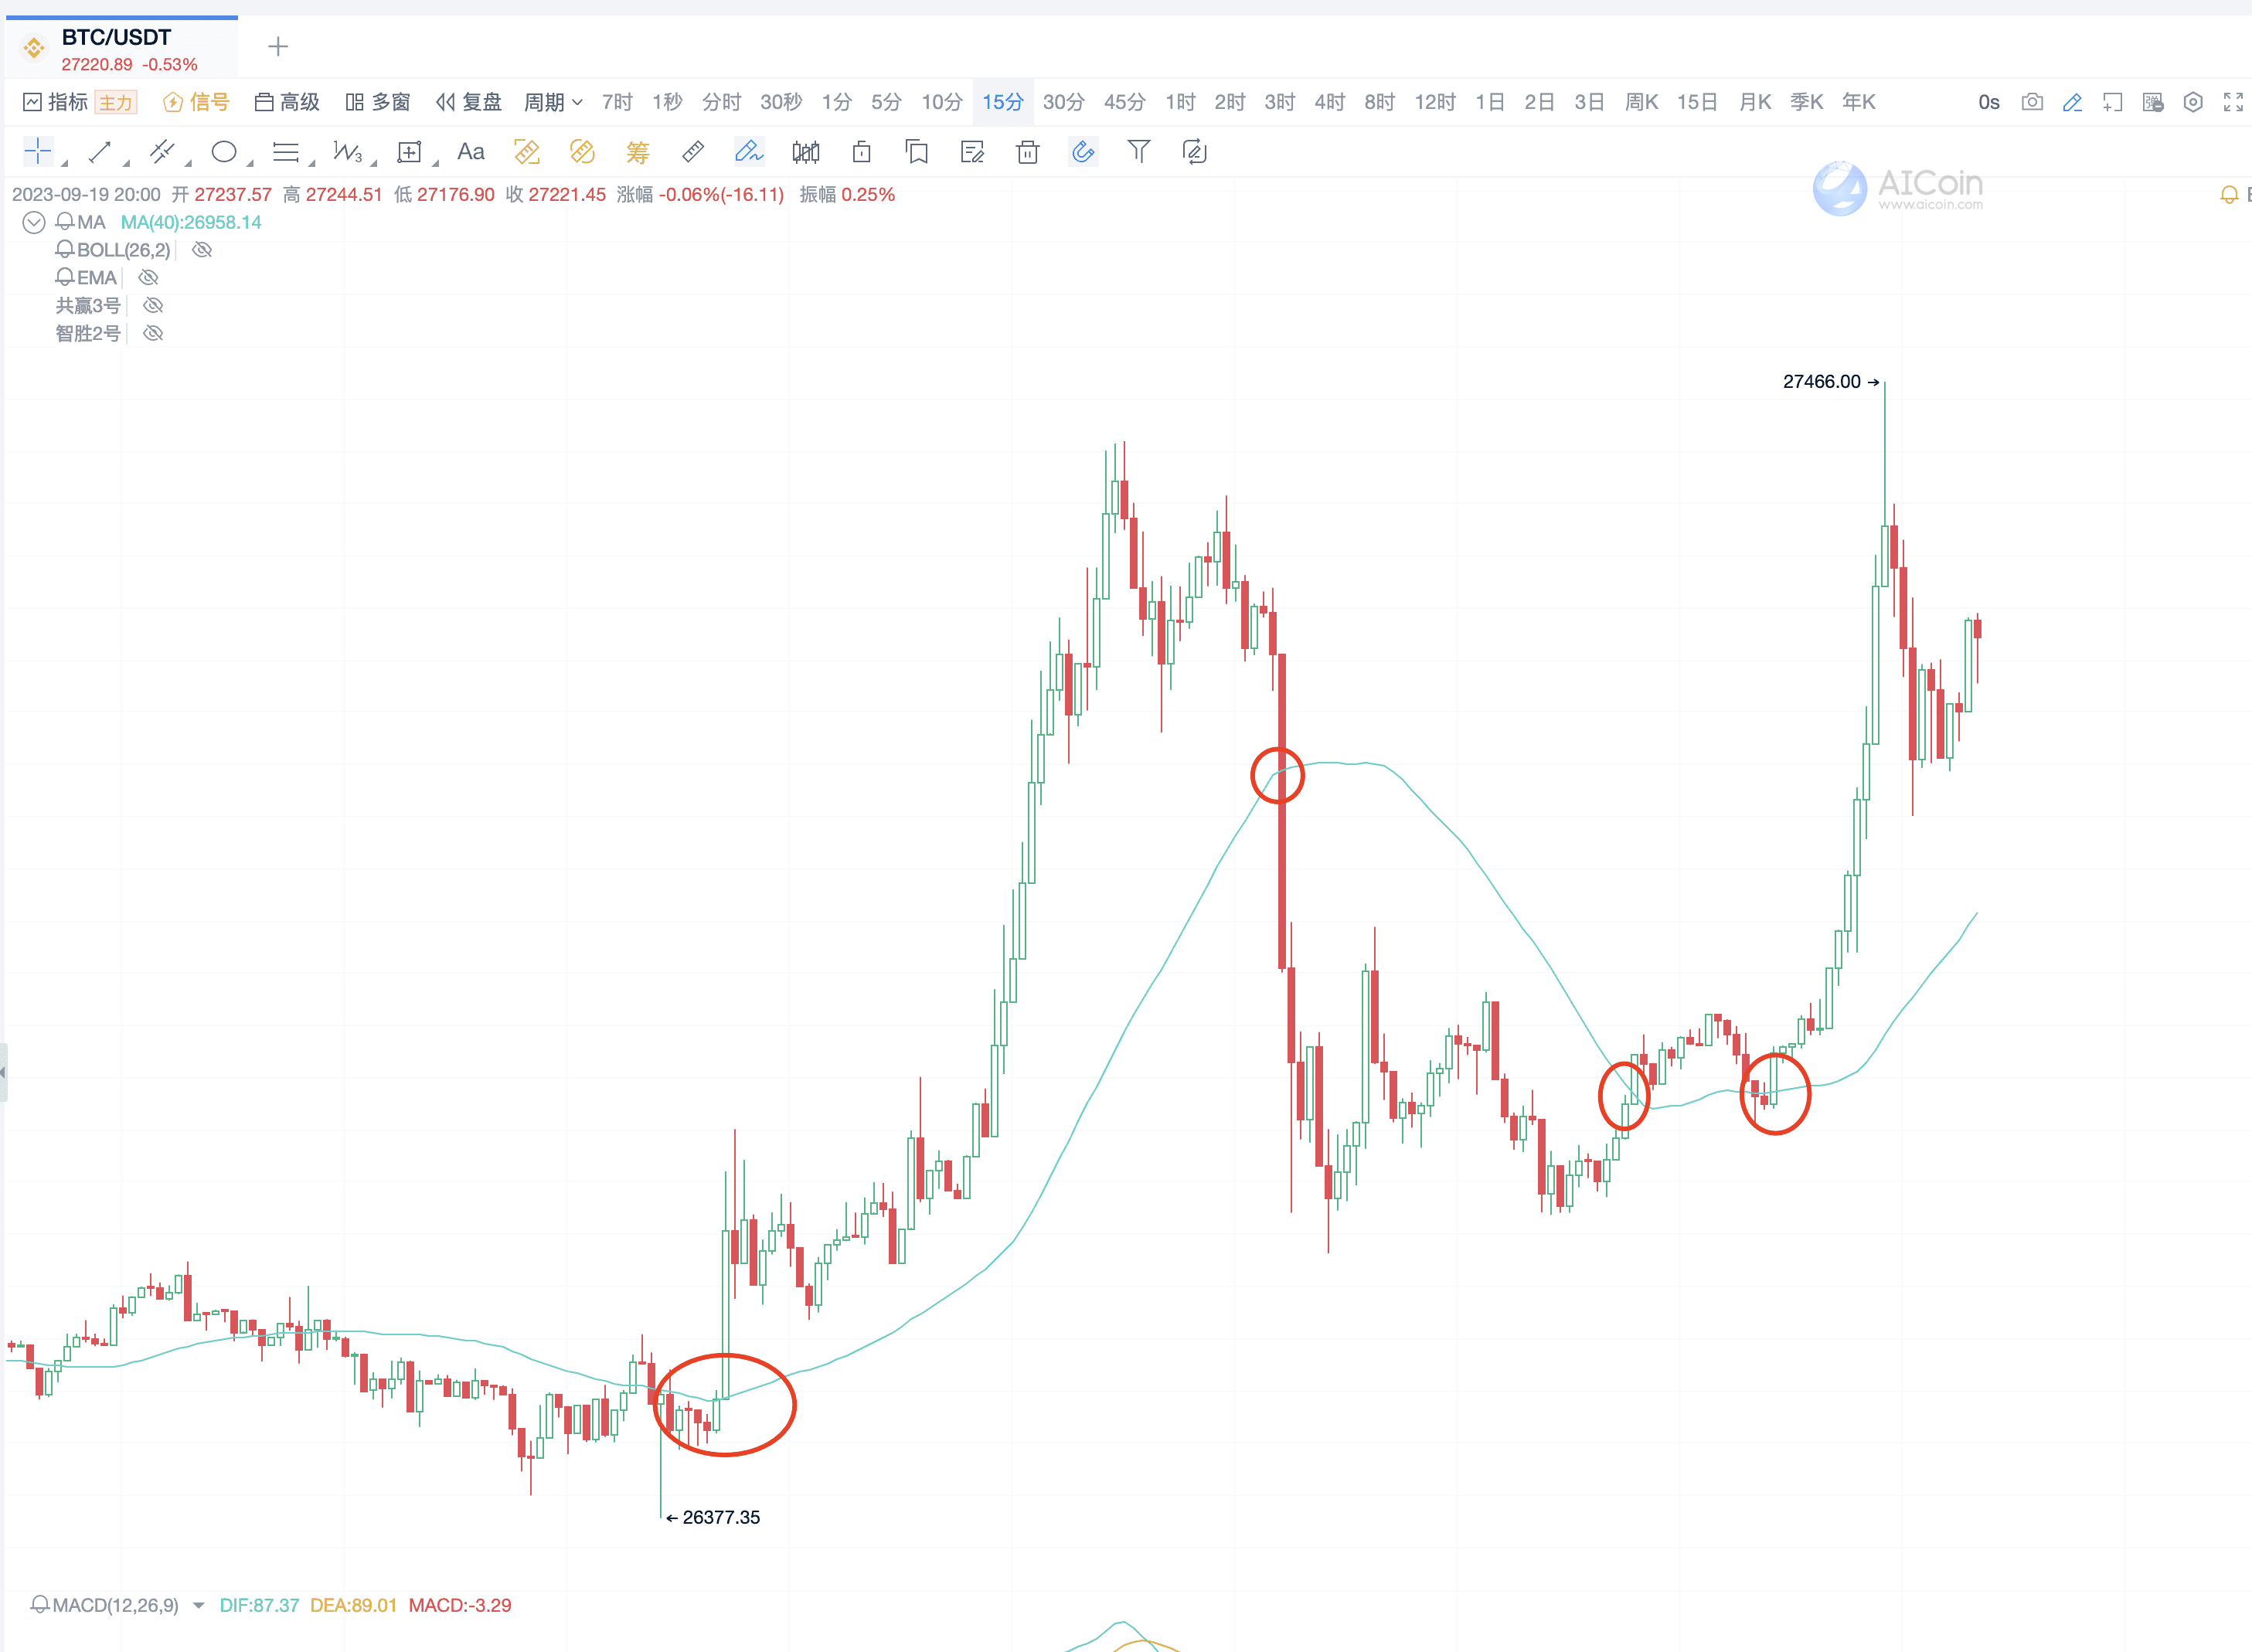
(2) EMA Tactics
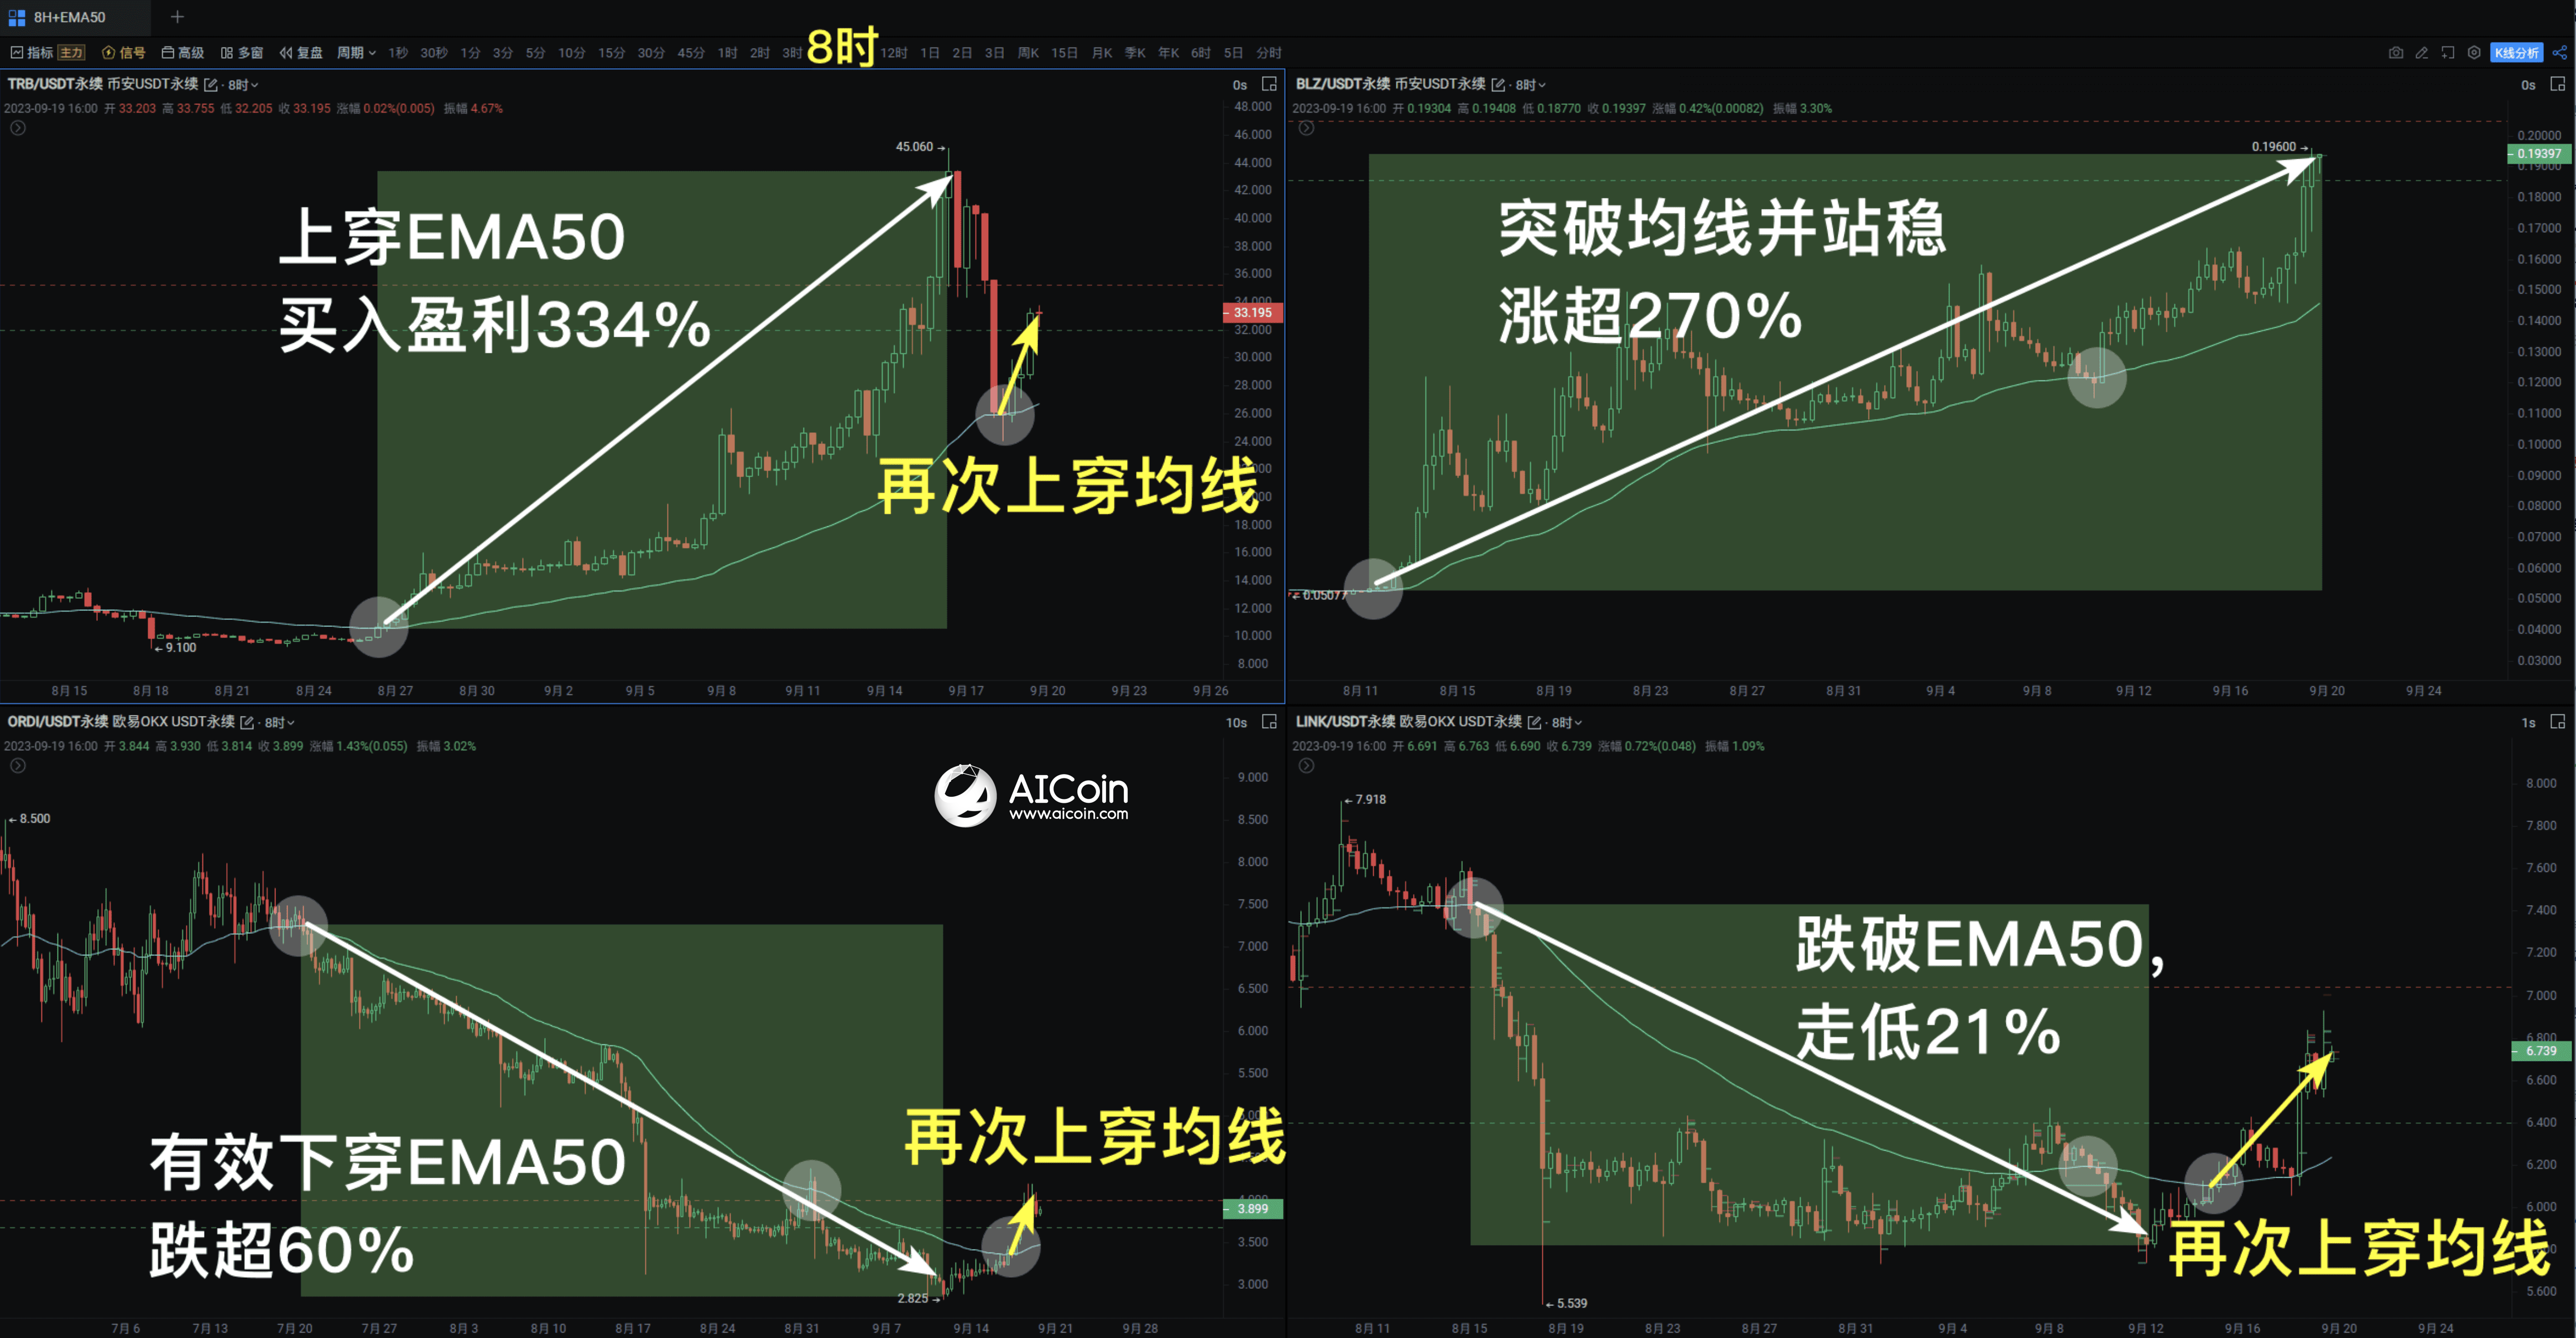
Indicator: EMA
Parameters: 50
Auxiliary Indicator: Chip Distribution
Period: 8 hours
Usage:
① Price crosses above EMA, bullish; if it holds the support of chip distribution, strongly bullish
② Price crosses below EMA, bearish; if there is chip pressure above, strongly bearish
Example
① BLZ
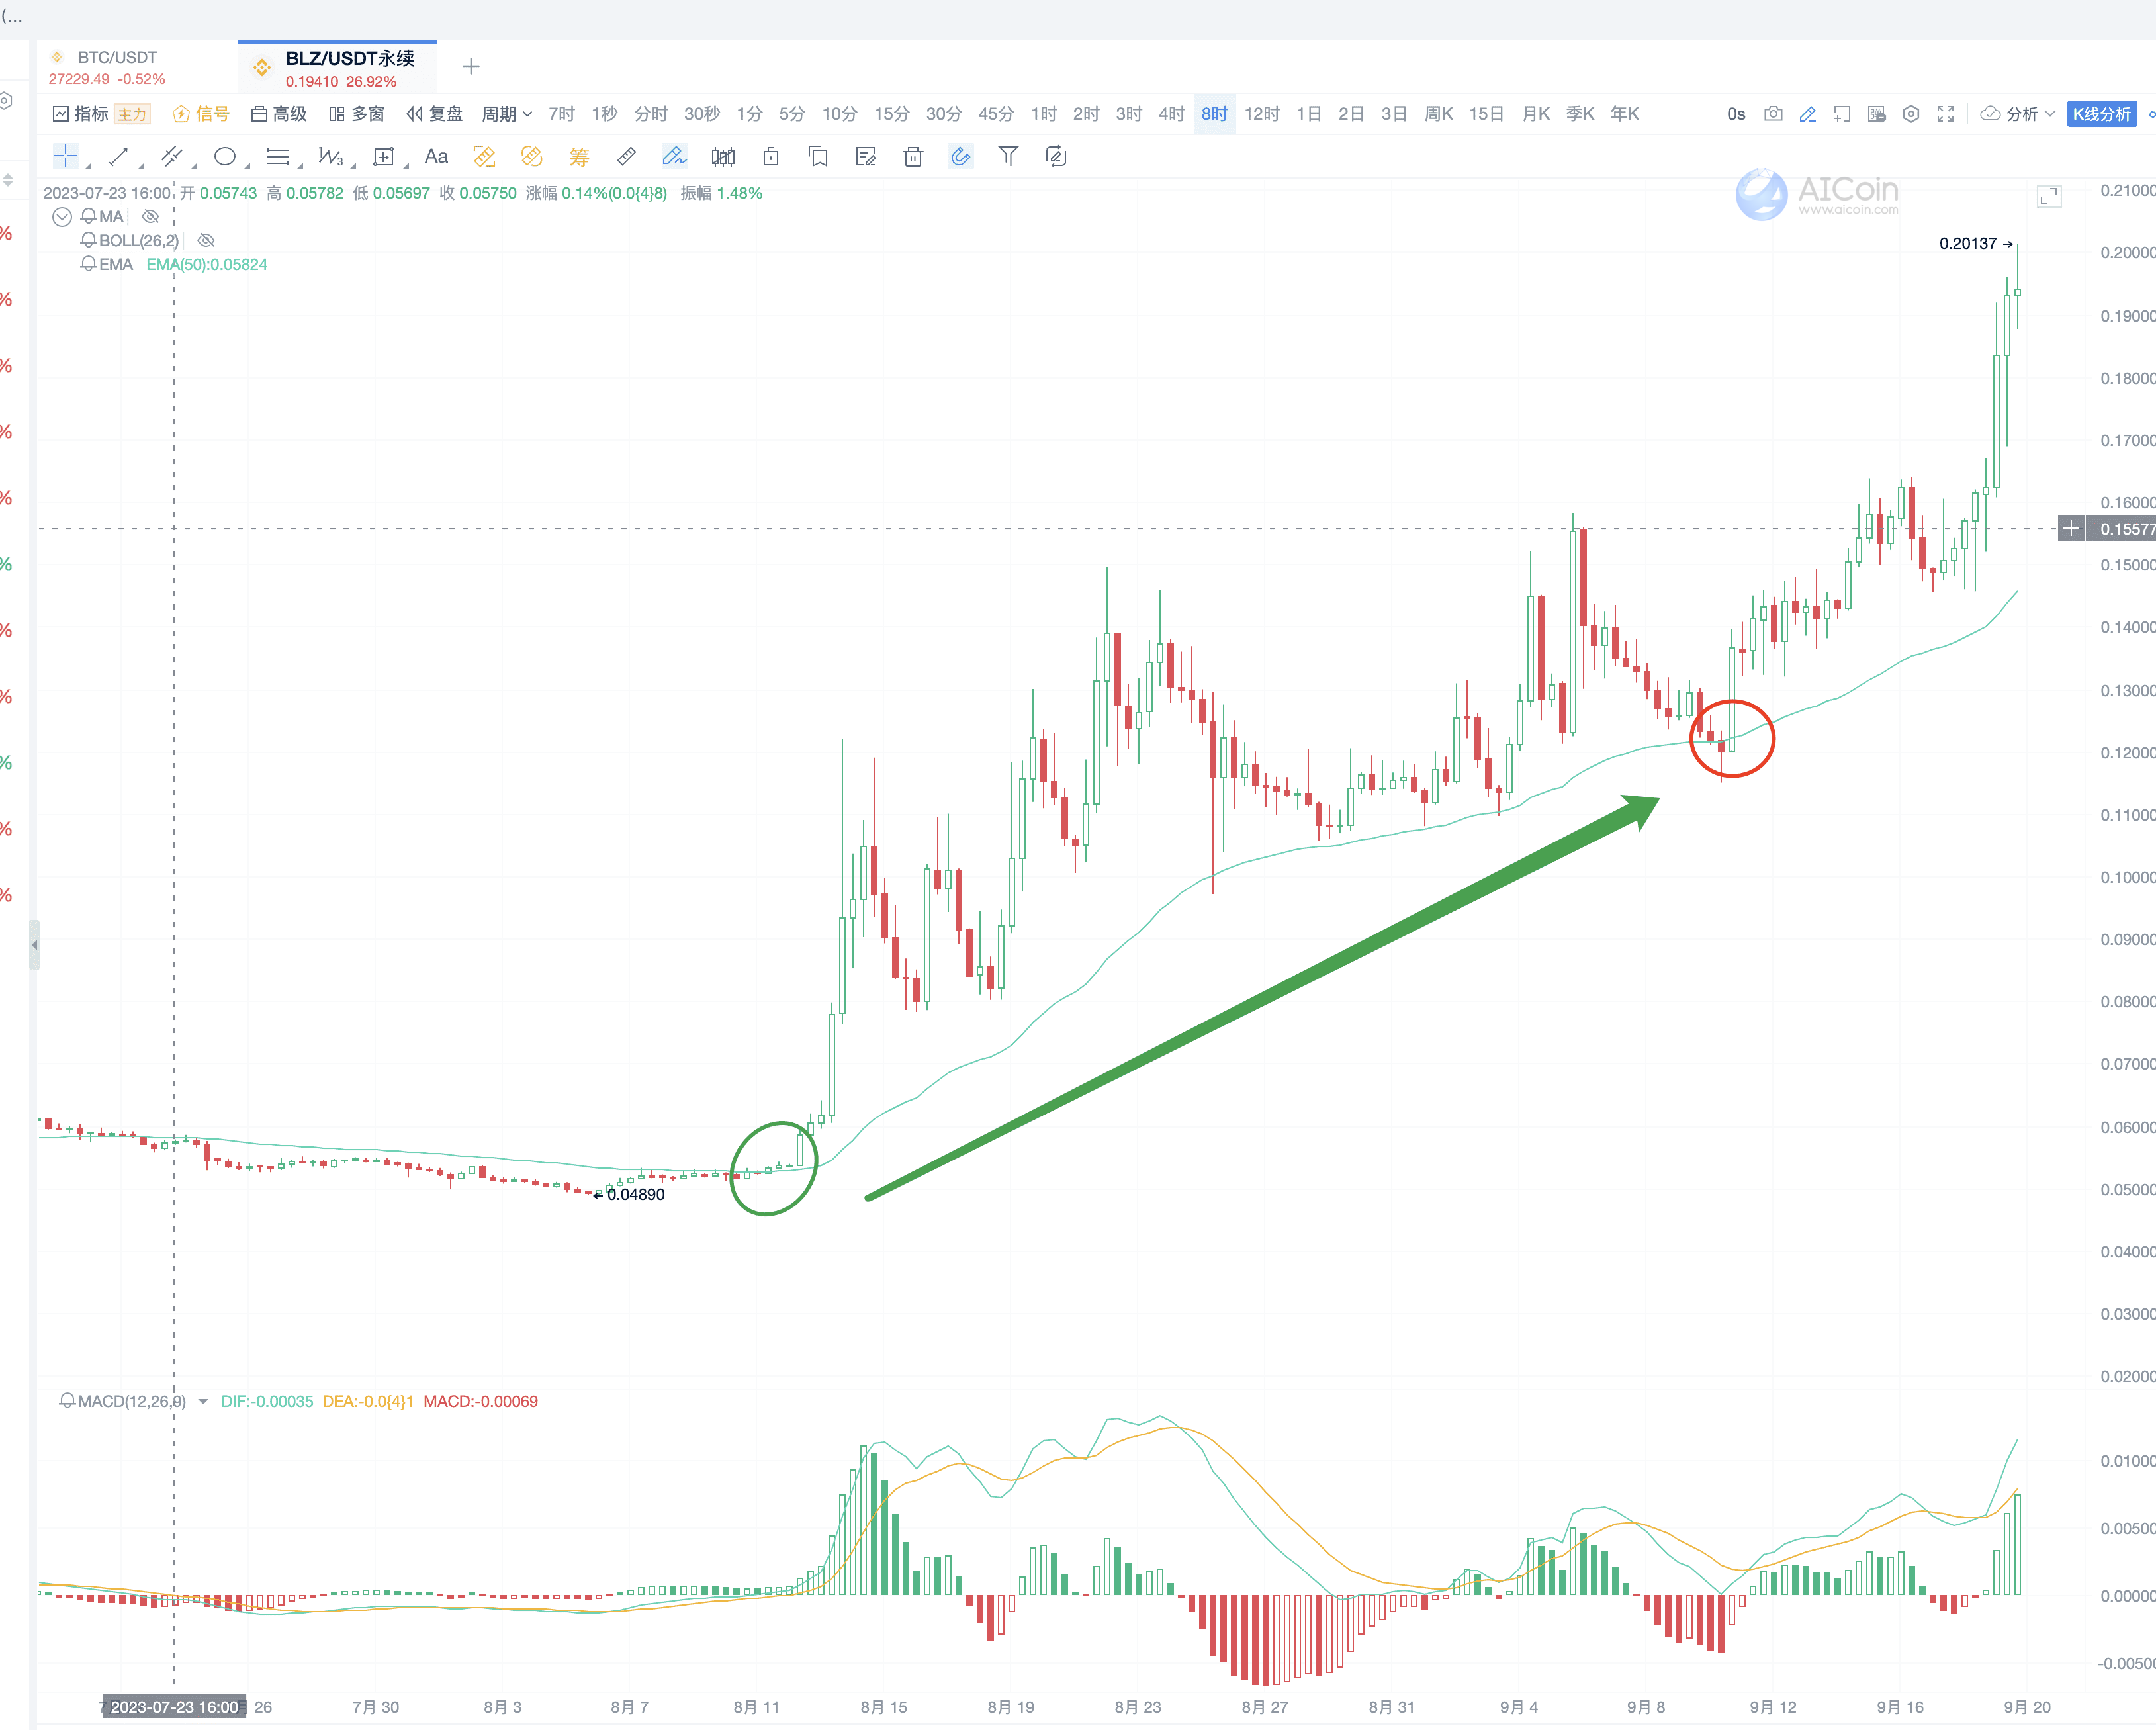
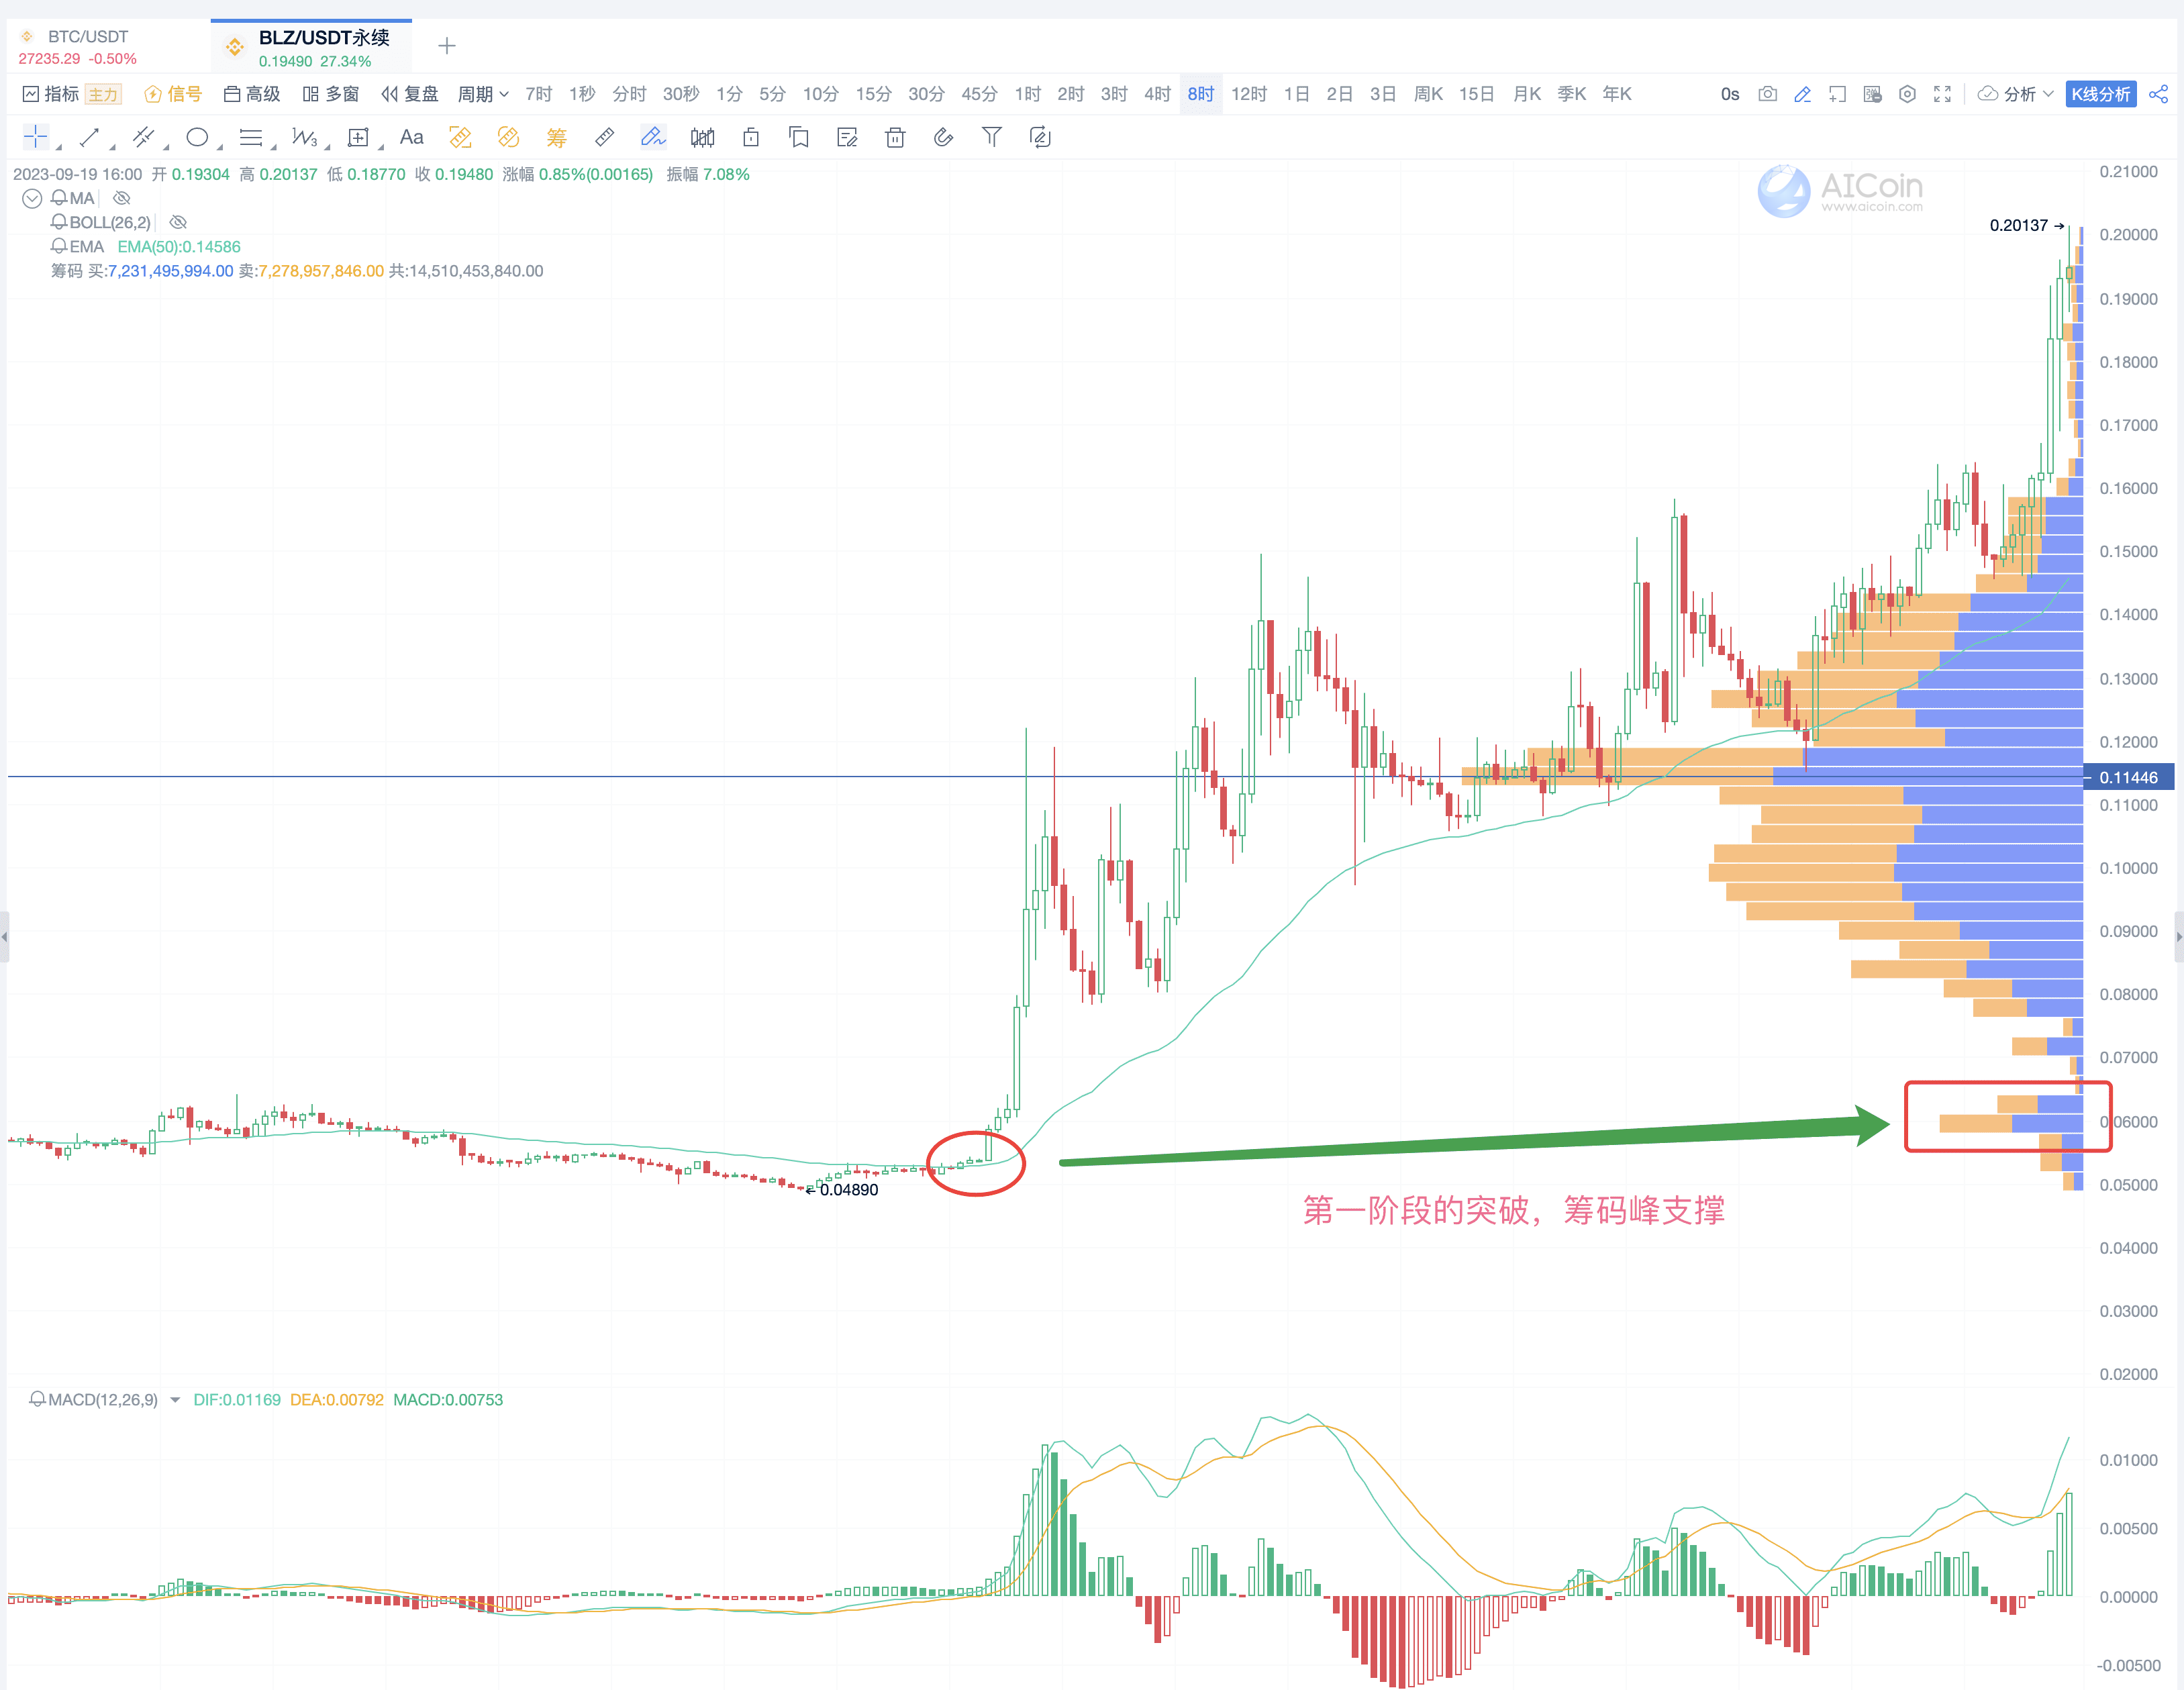
In the first phase breakthrough, the chip peak received support from related funds.
In the second phase pullback, it continued to hold above EMA50, also with strong chip peak support.
Why is it a pullback? Because the BLZ price probed the chip peak, immediately pulled back, forming a strong morning star.
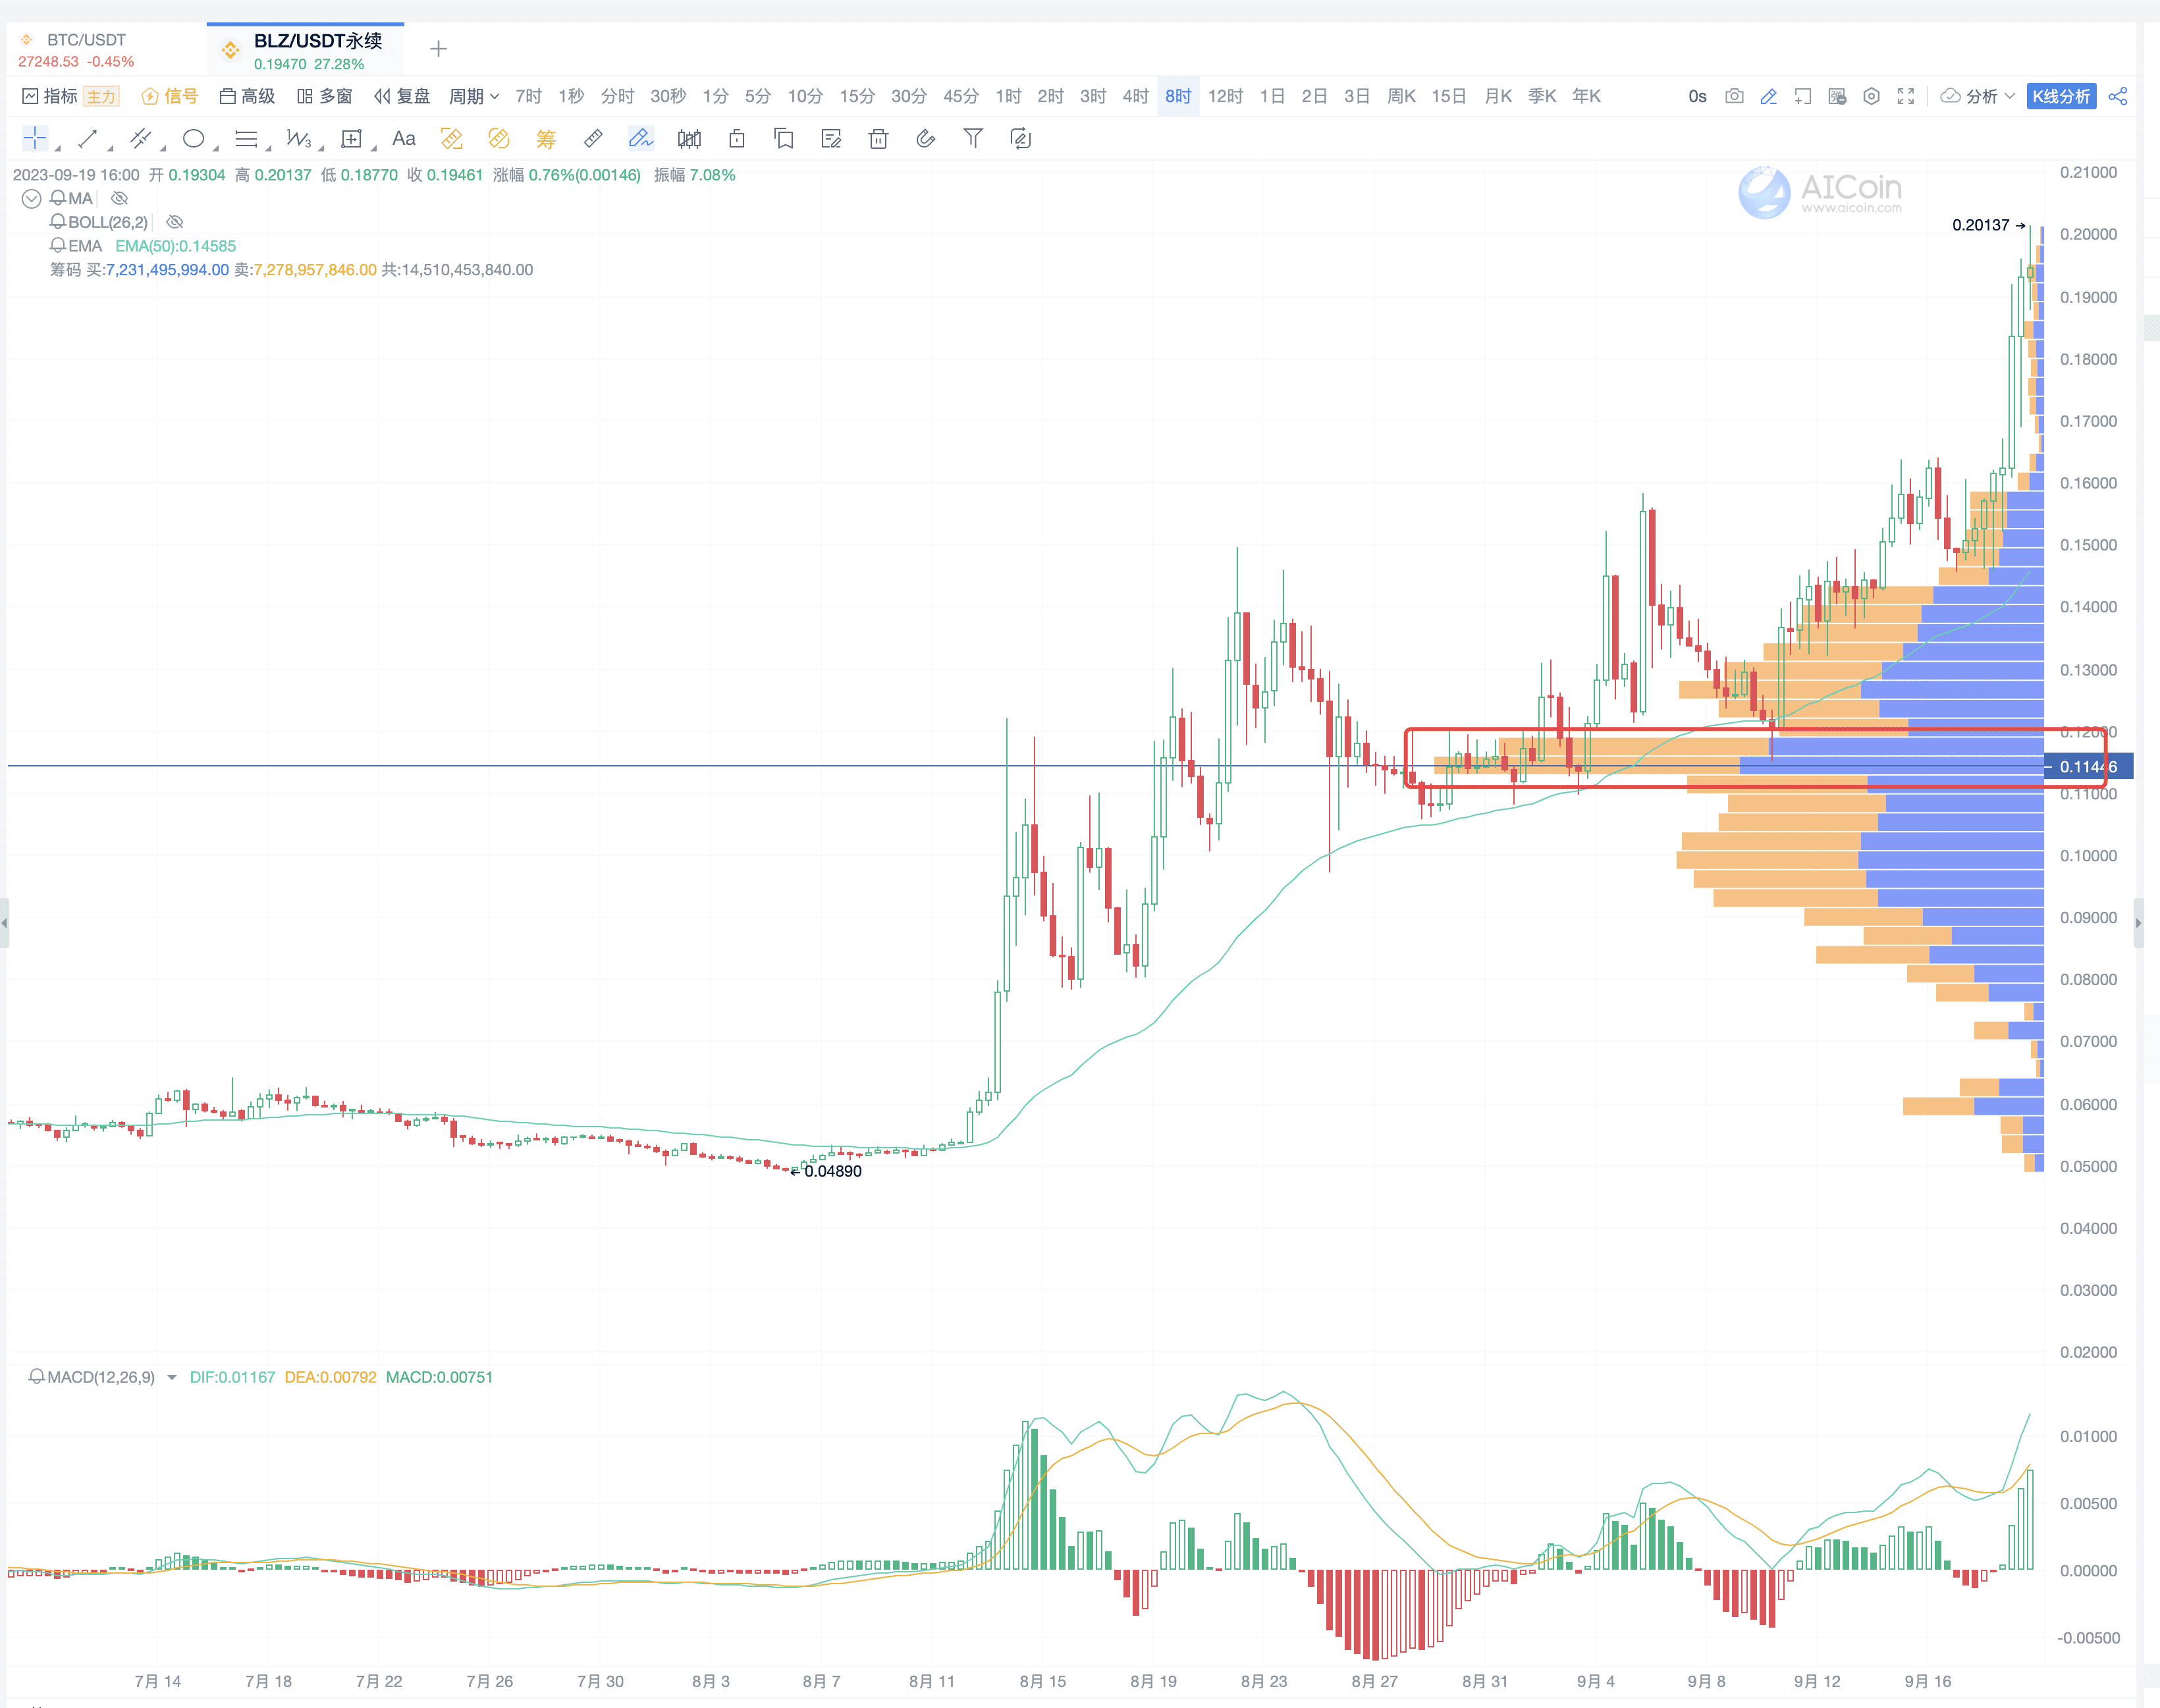
Use Fibonacci tools to verify the support level of chip distribution.
Step 1: Fibonacci tool position;
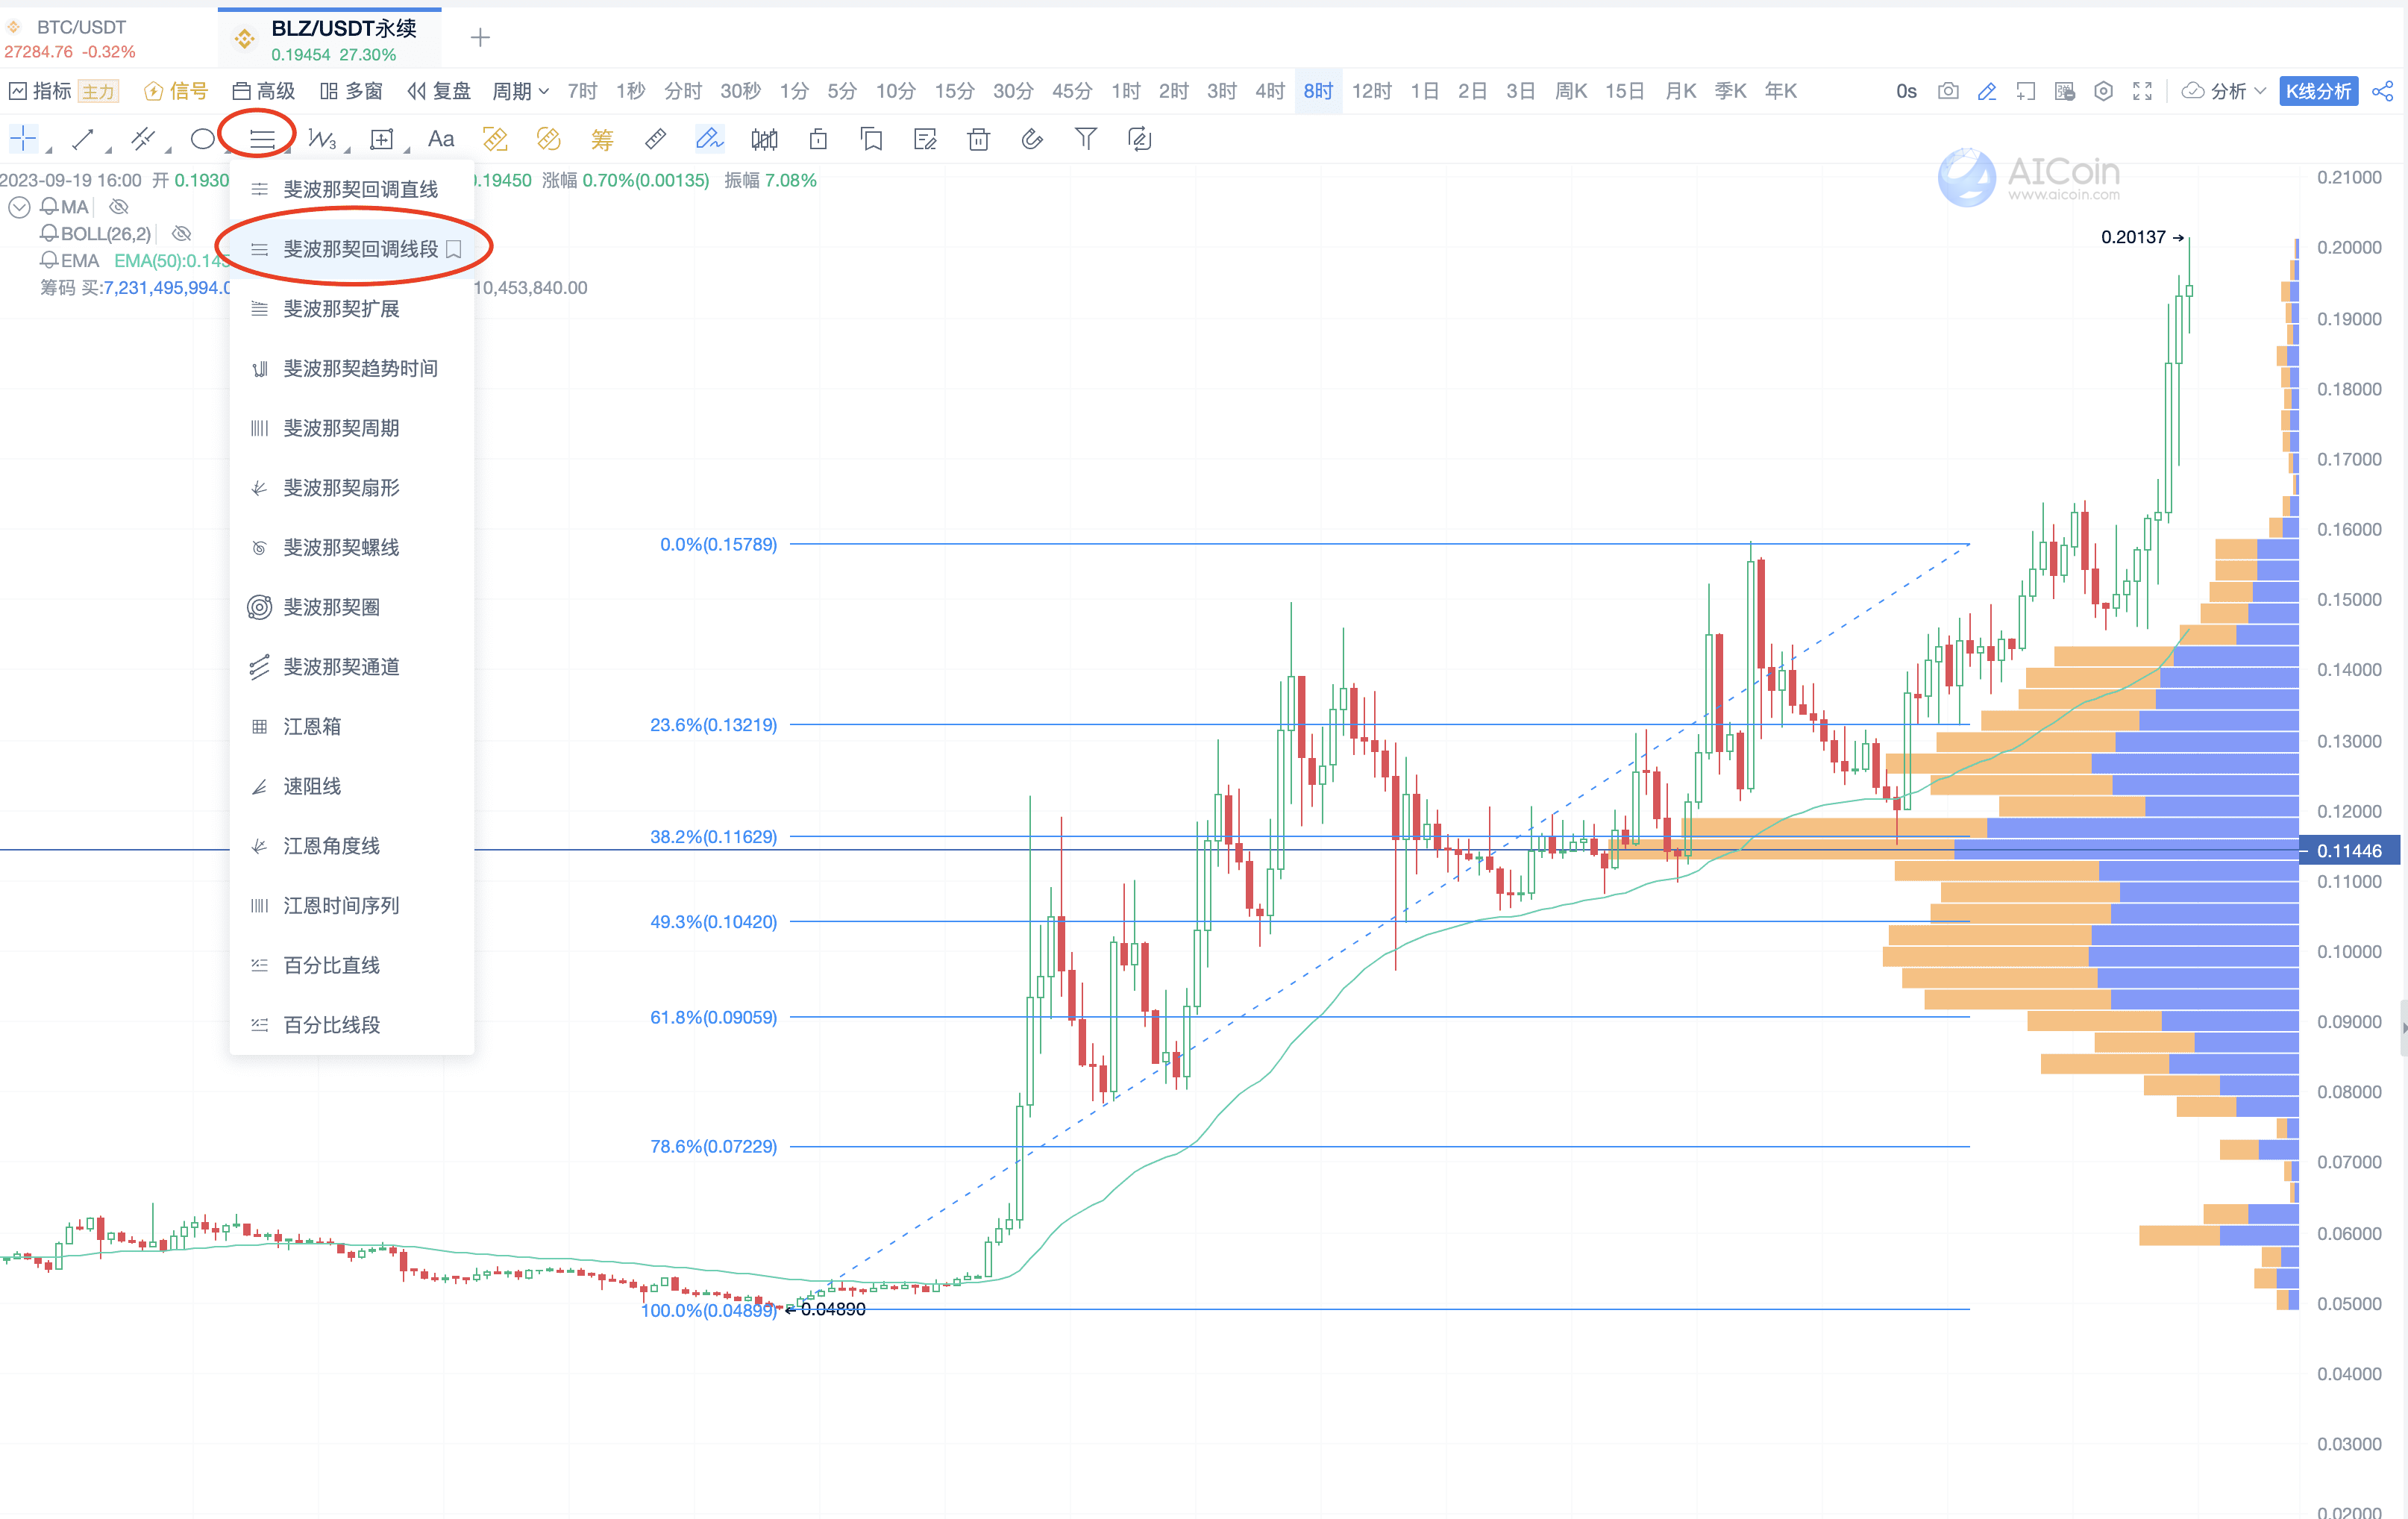
Step 2: Select high and low points;
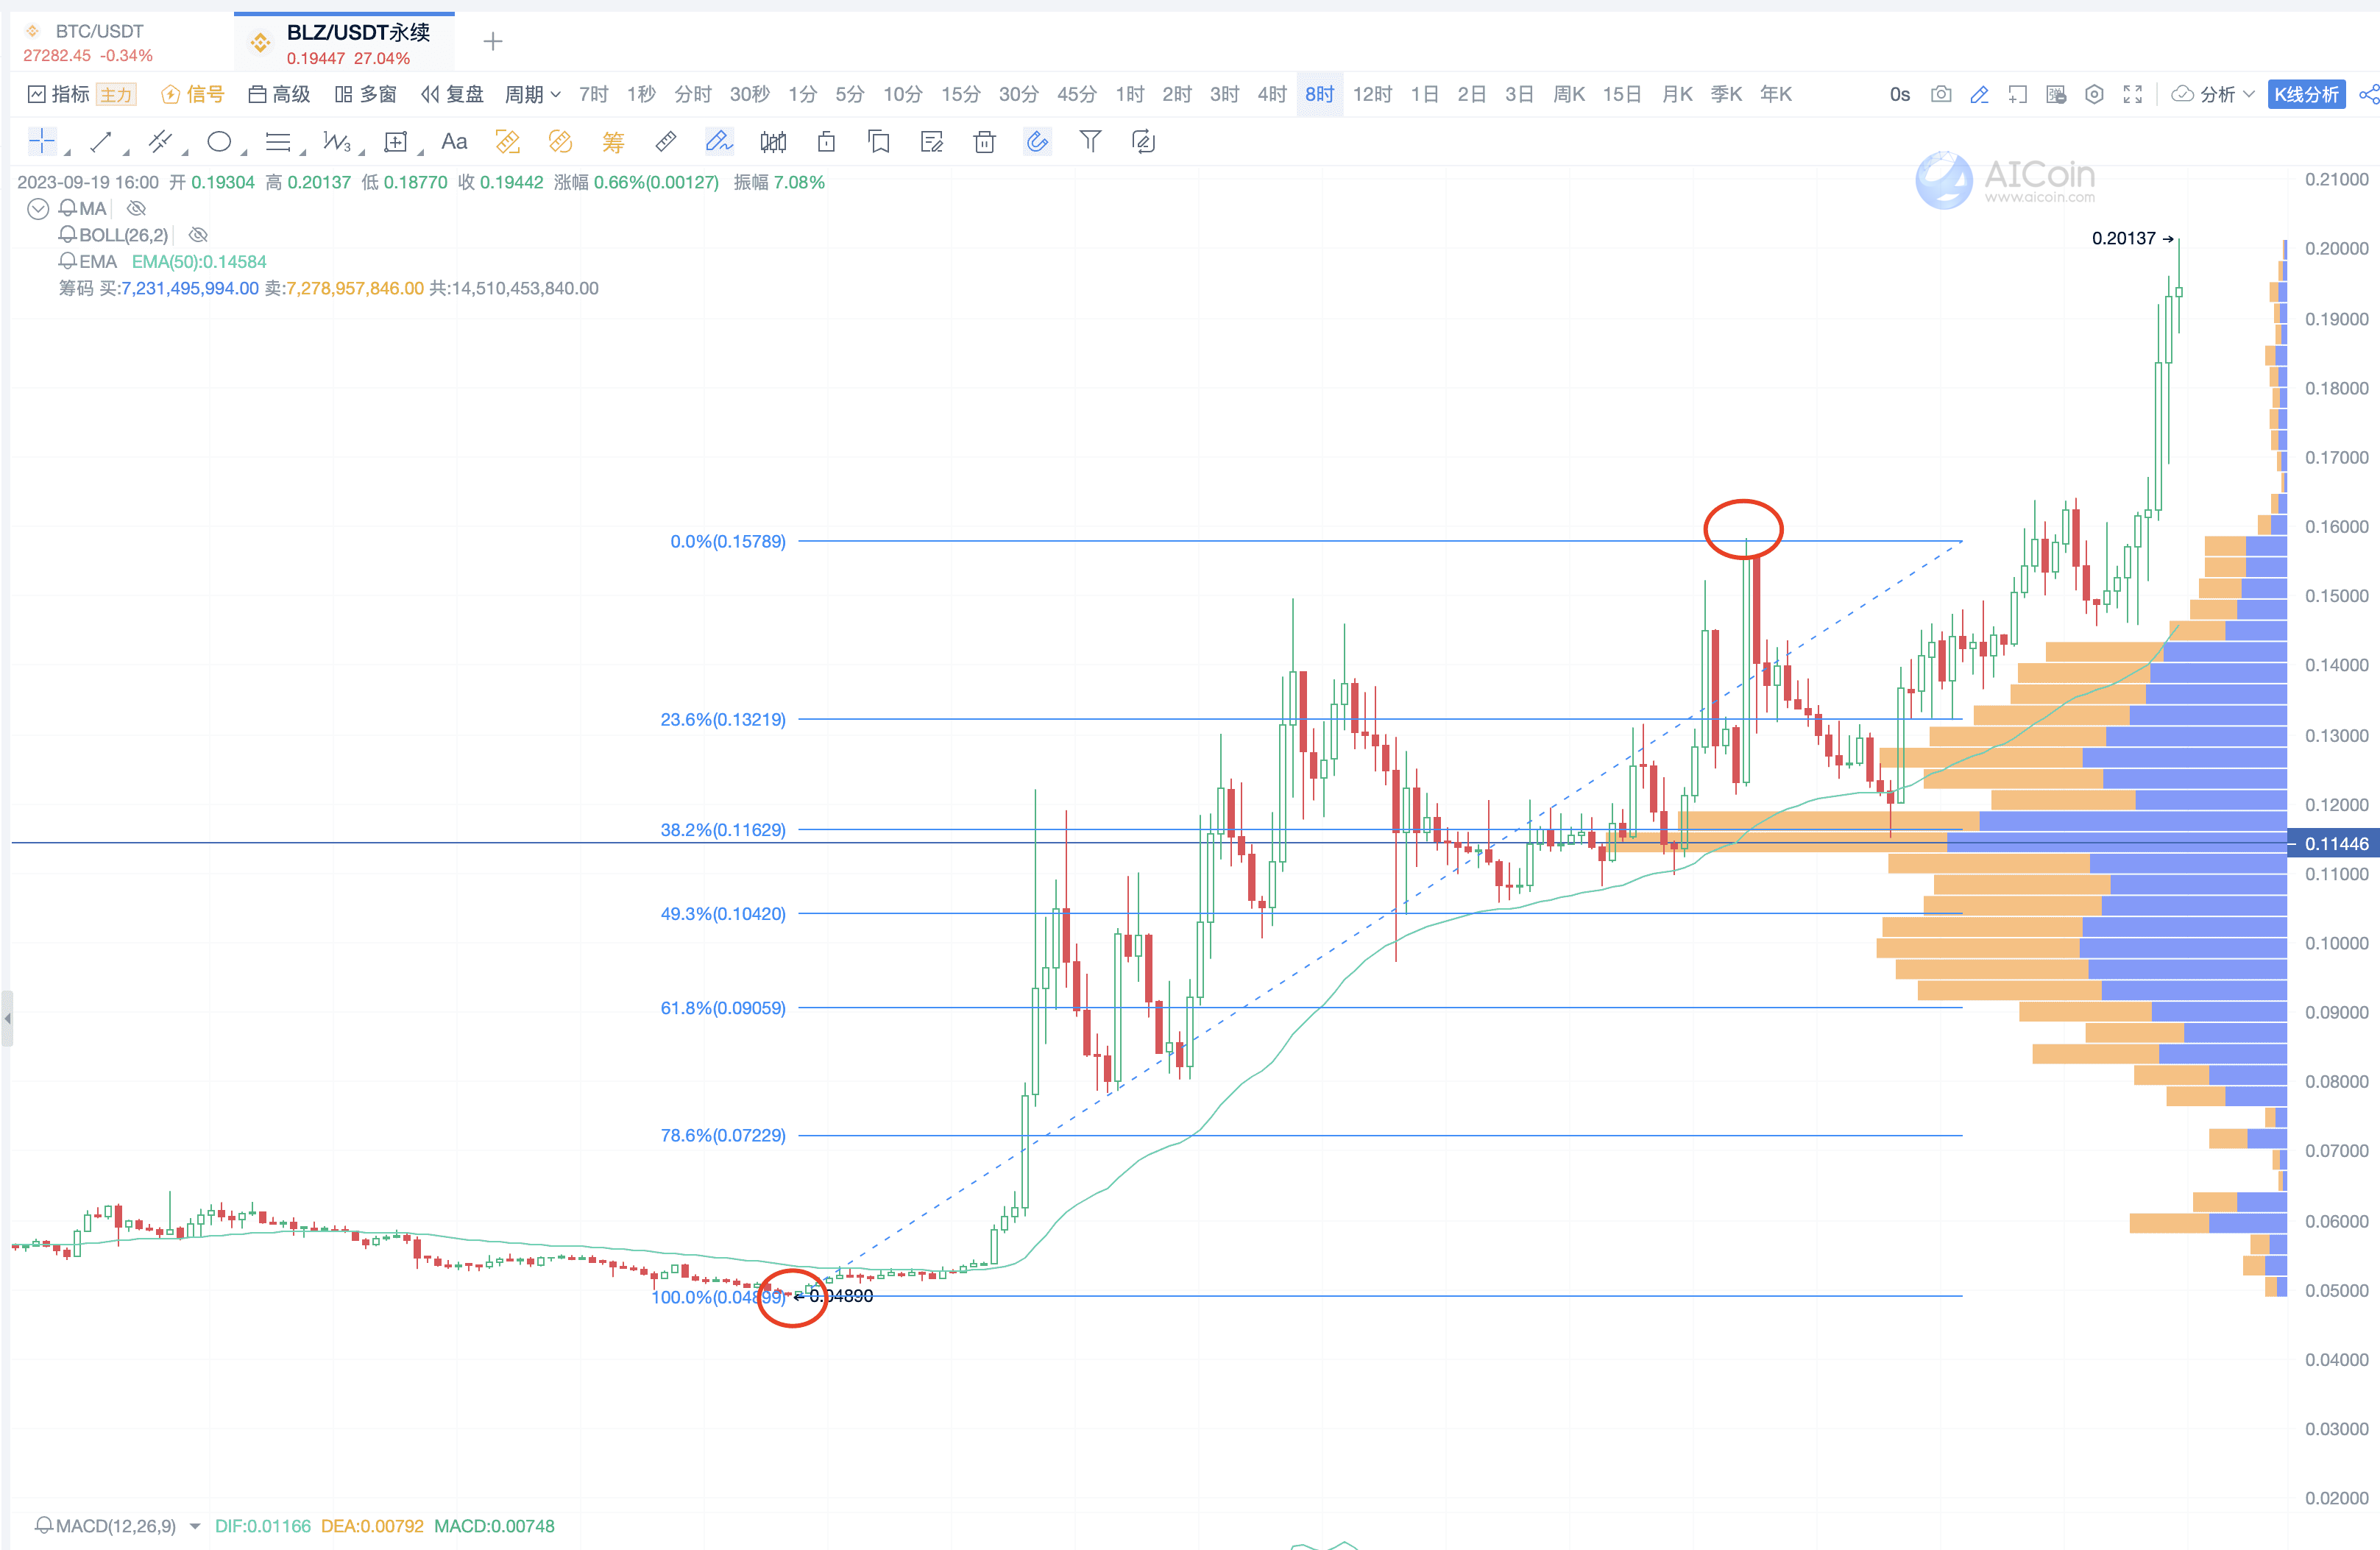
At the 0.382 position, it happens to be the position of the chip peak, the market's main capital peak is exactly at this key position.
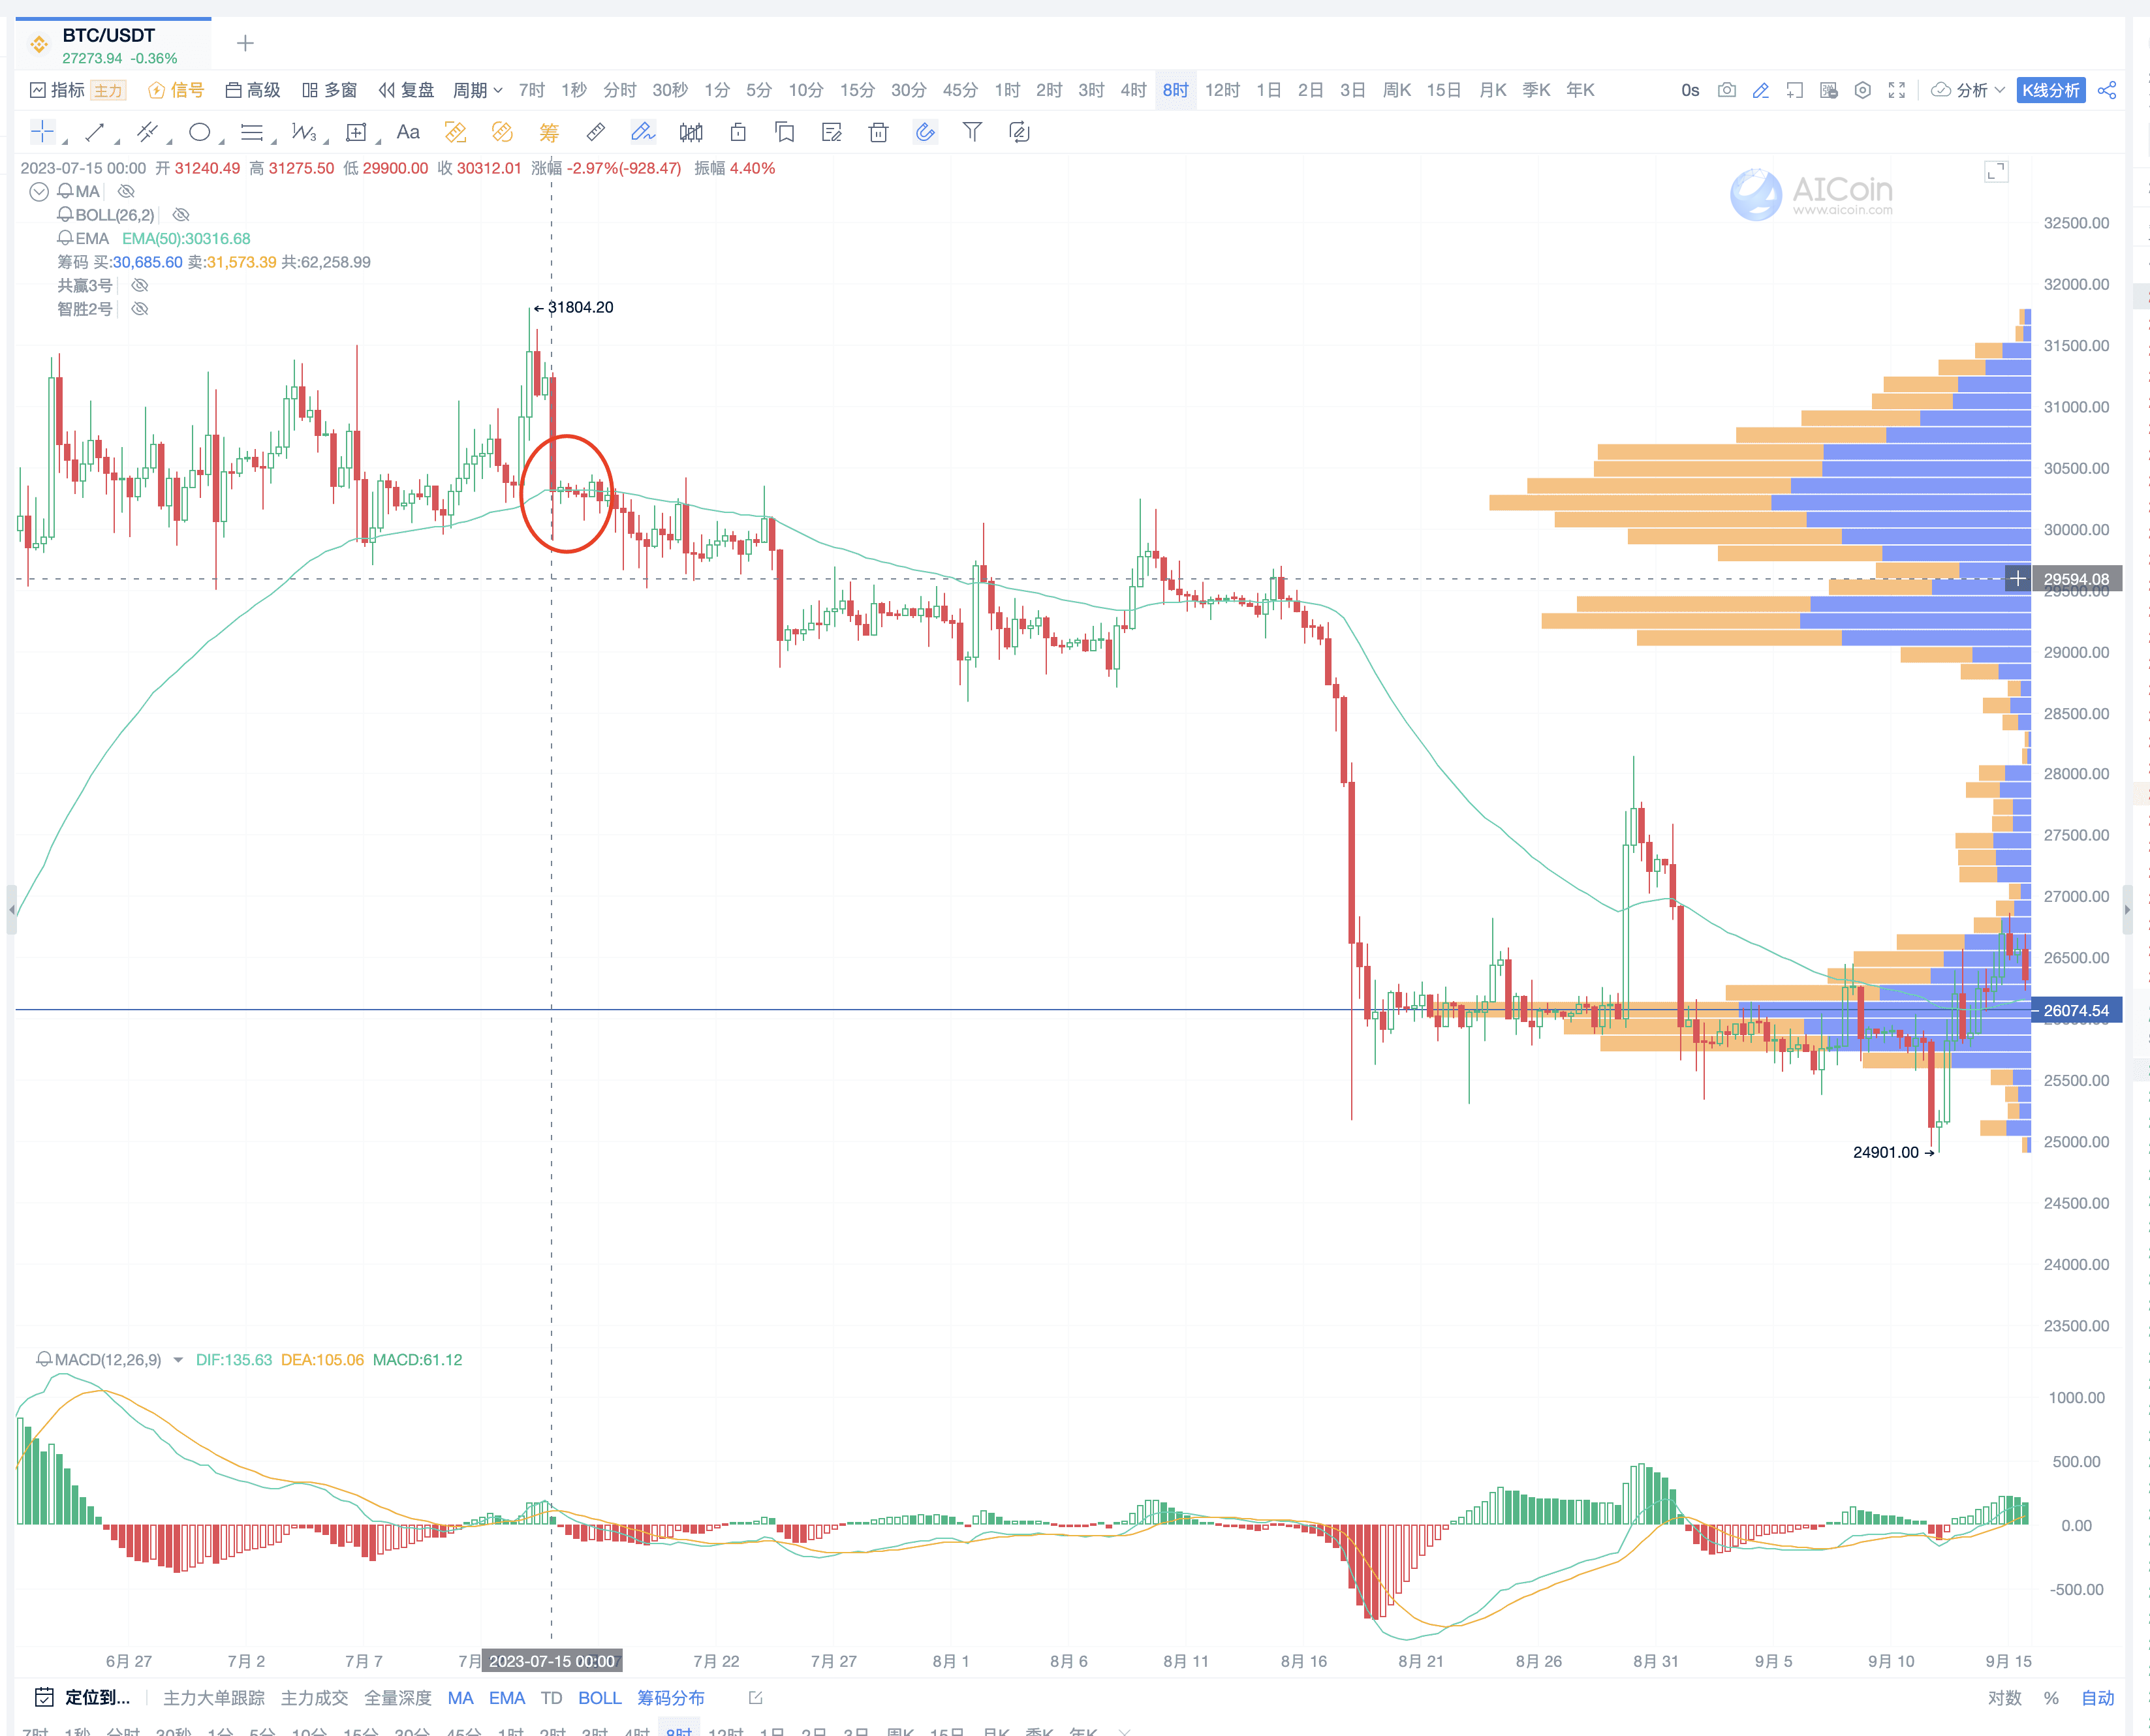
The above chart can be described as a perfect signal point, why perfect?
① Price shows a top divergence;
② Price just fell below the 8-hour EMA50;
③ When it fell, there was chip peak pressure on the right side.
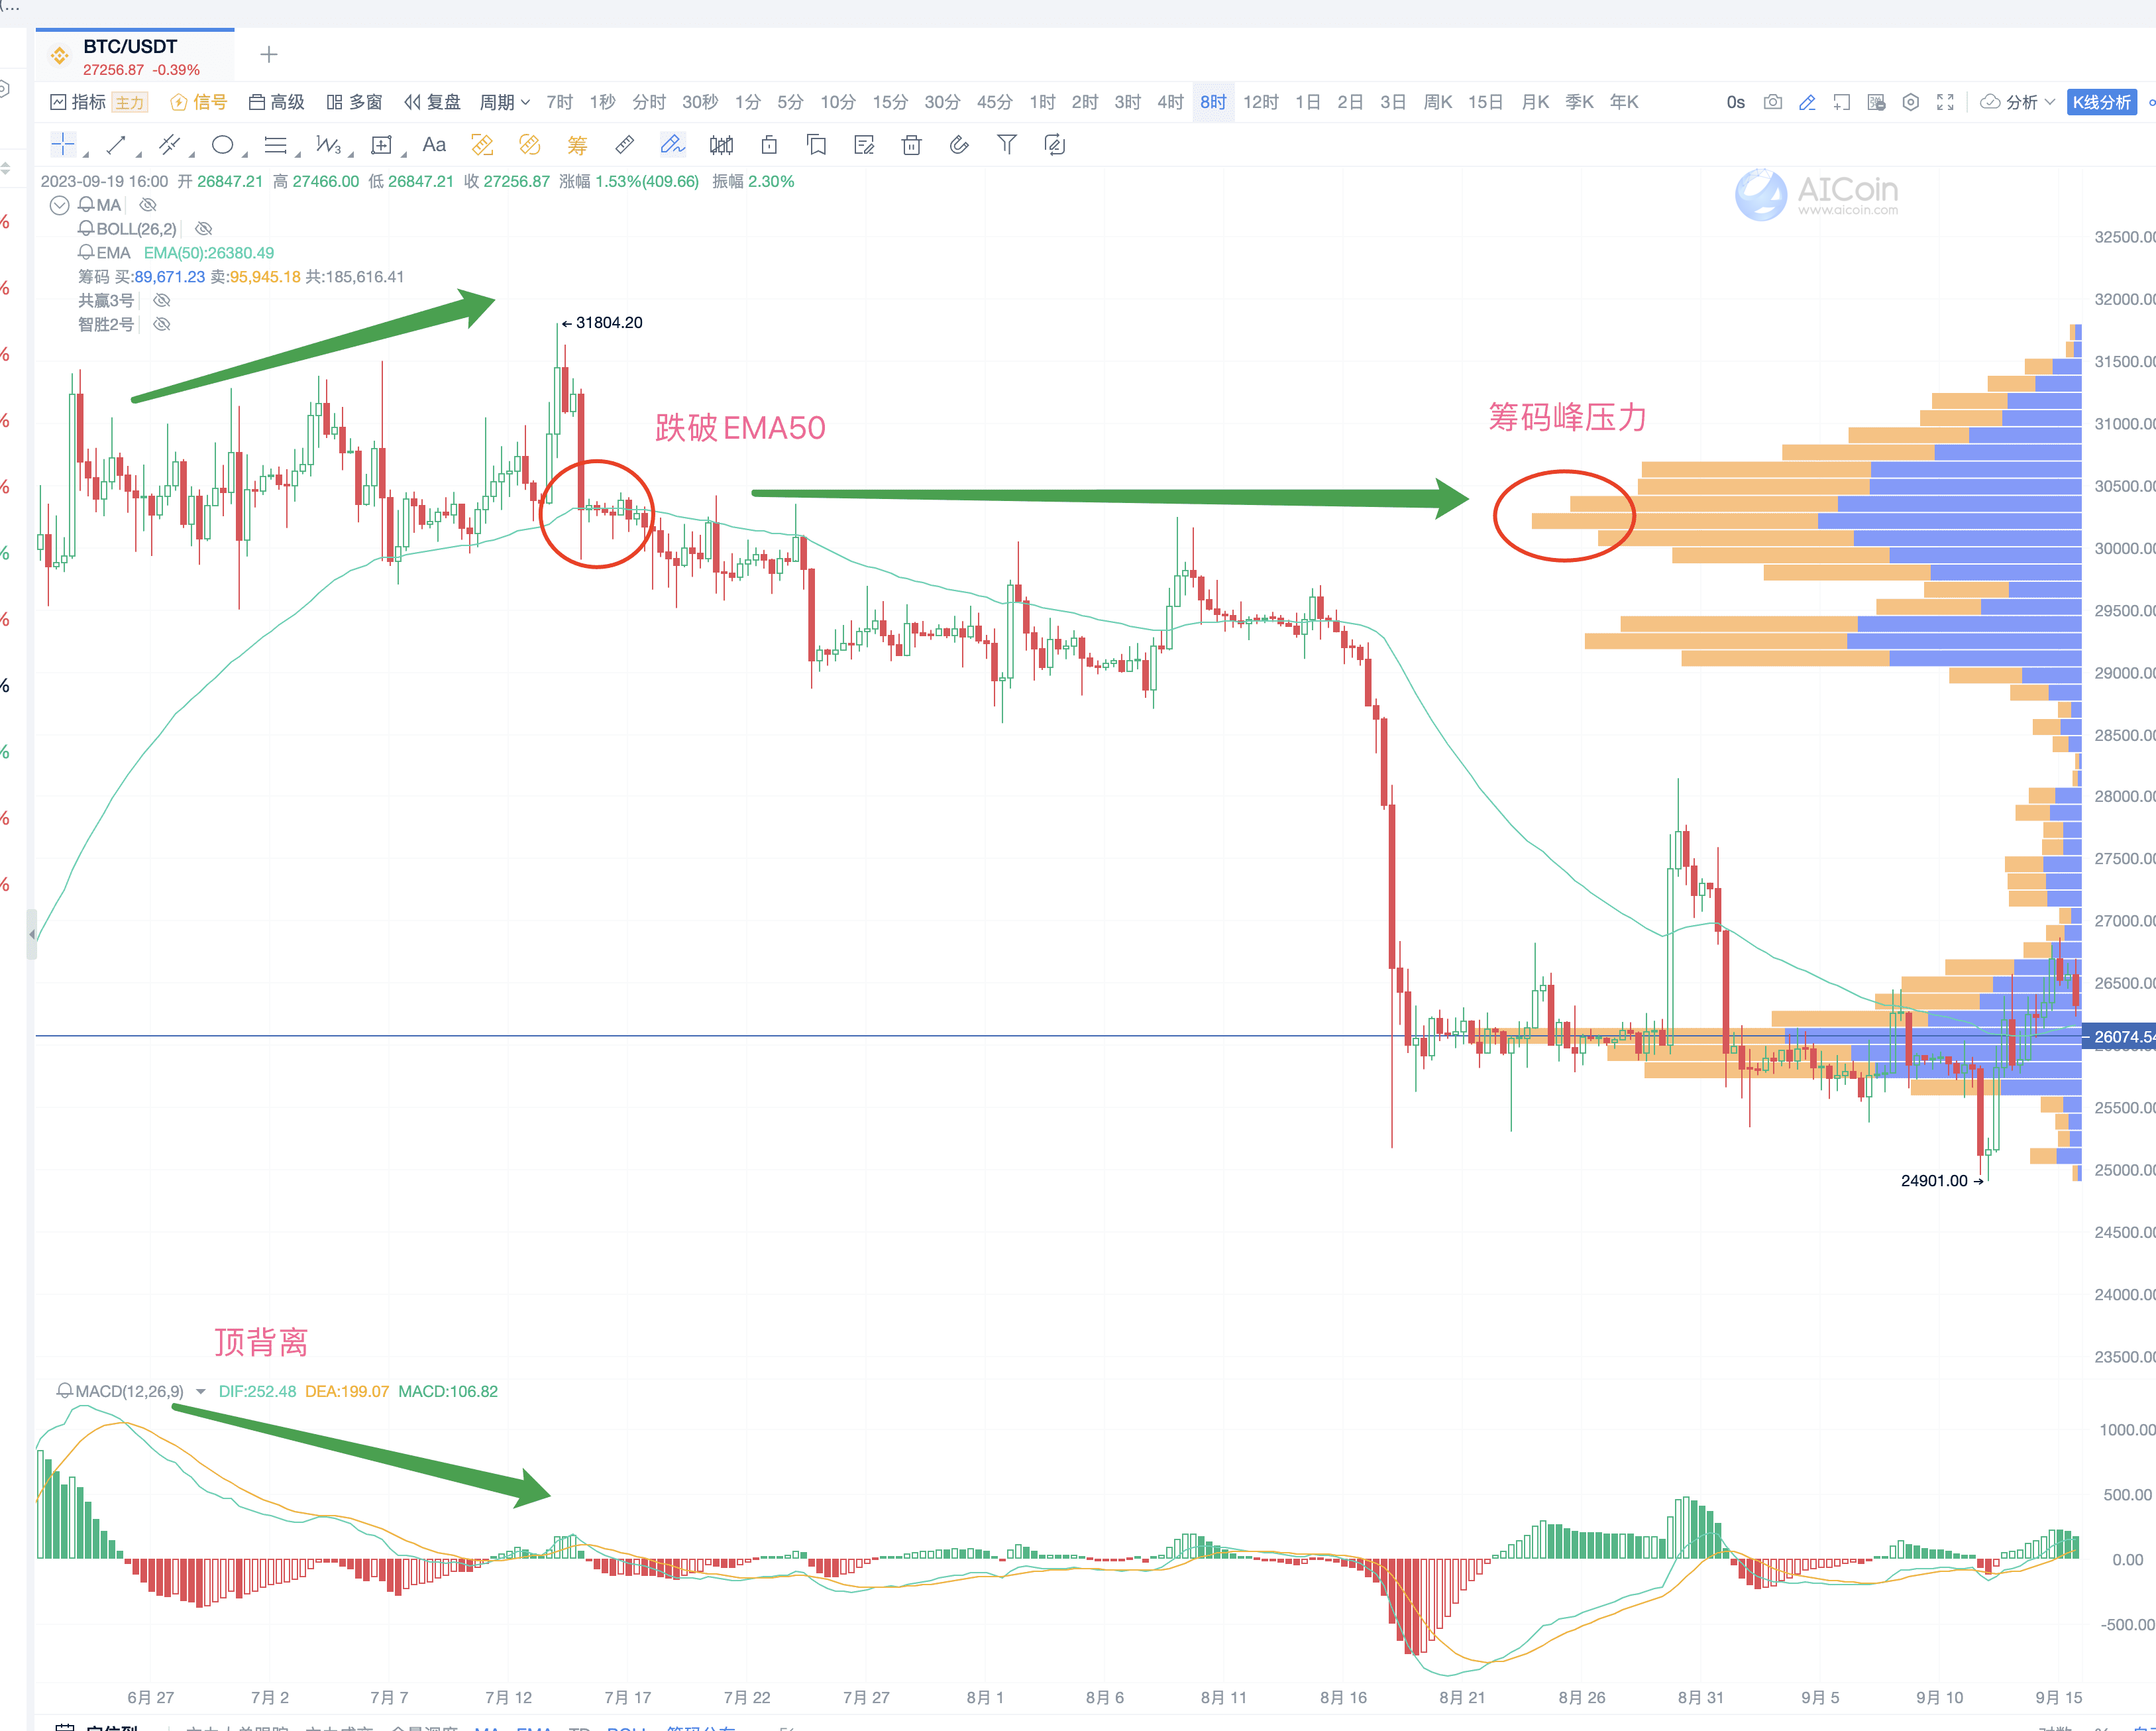
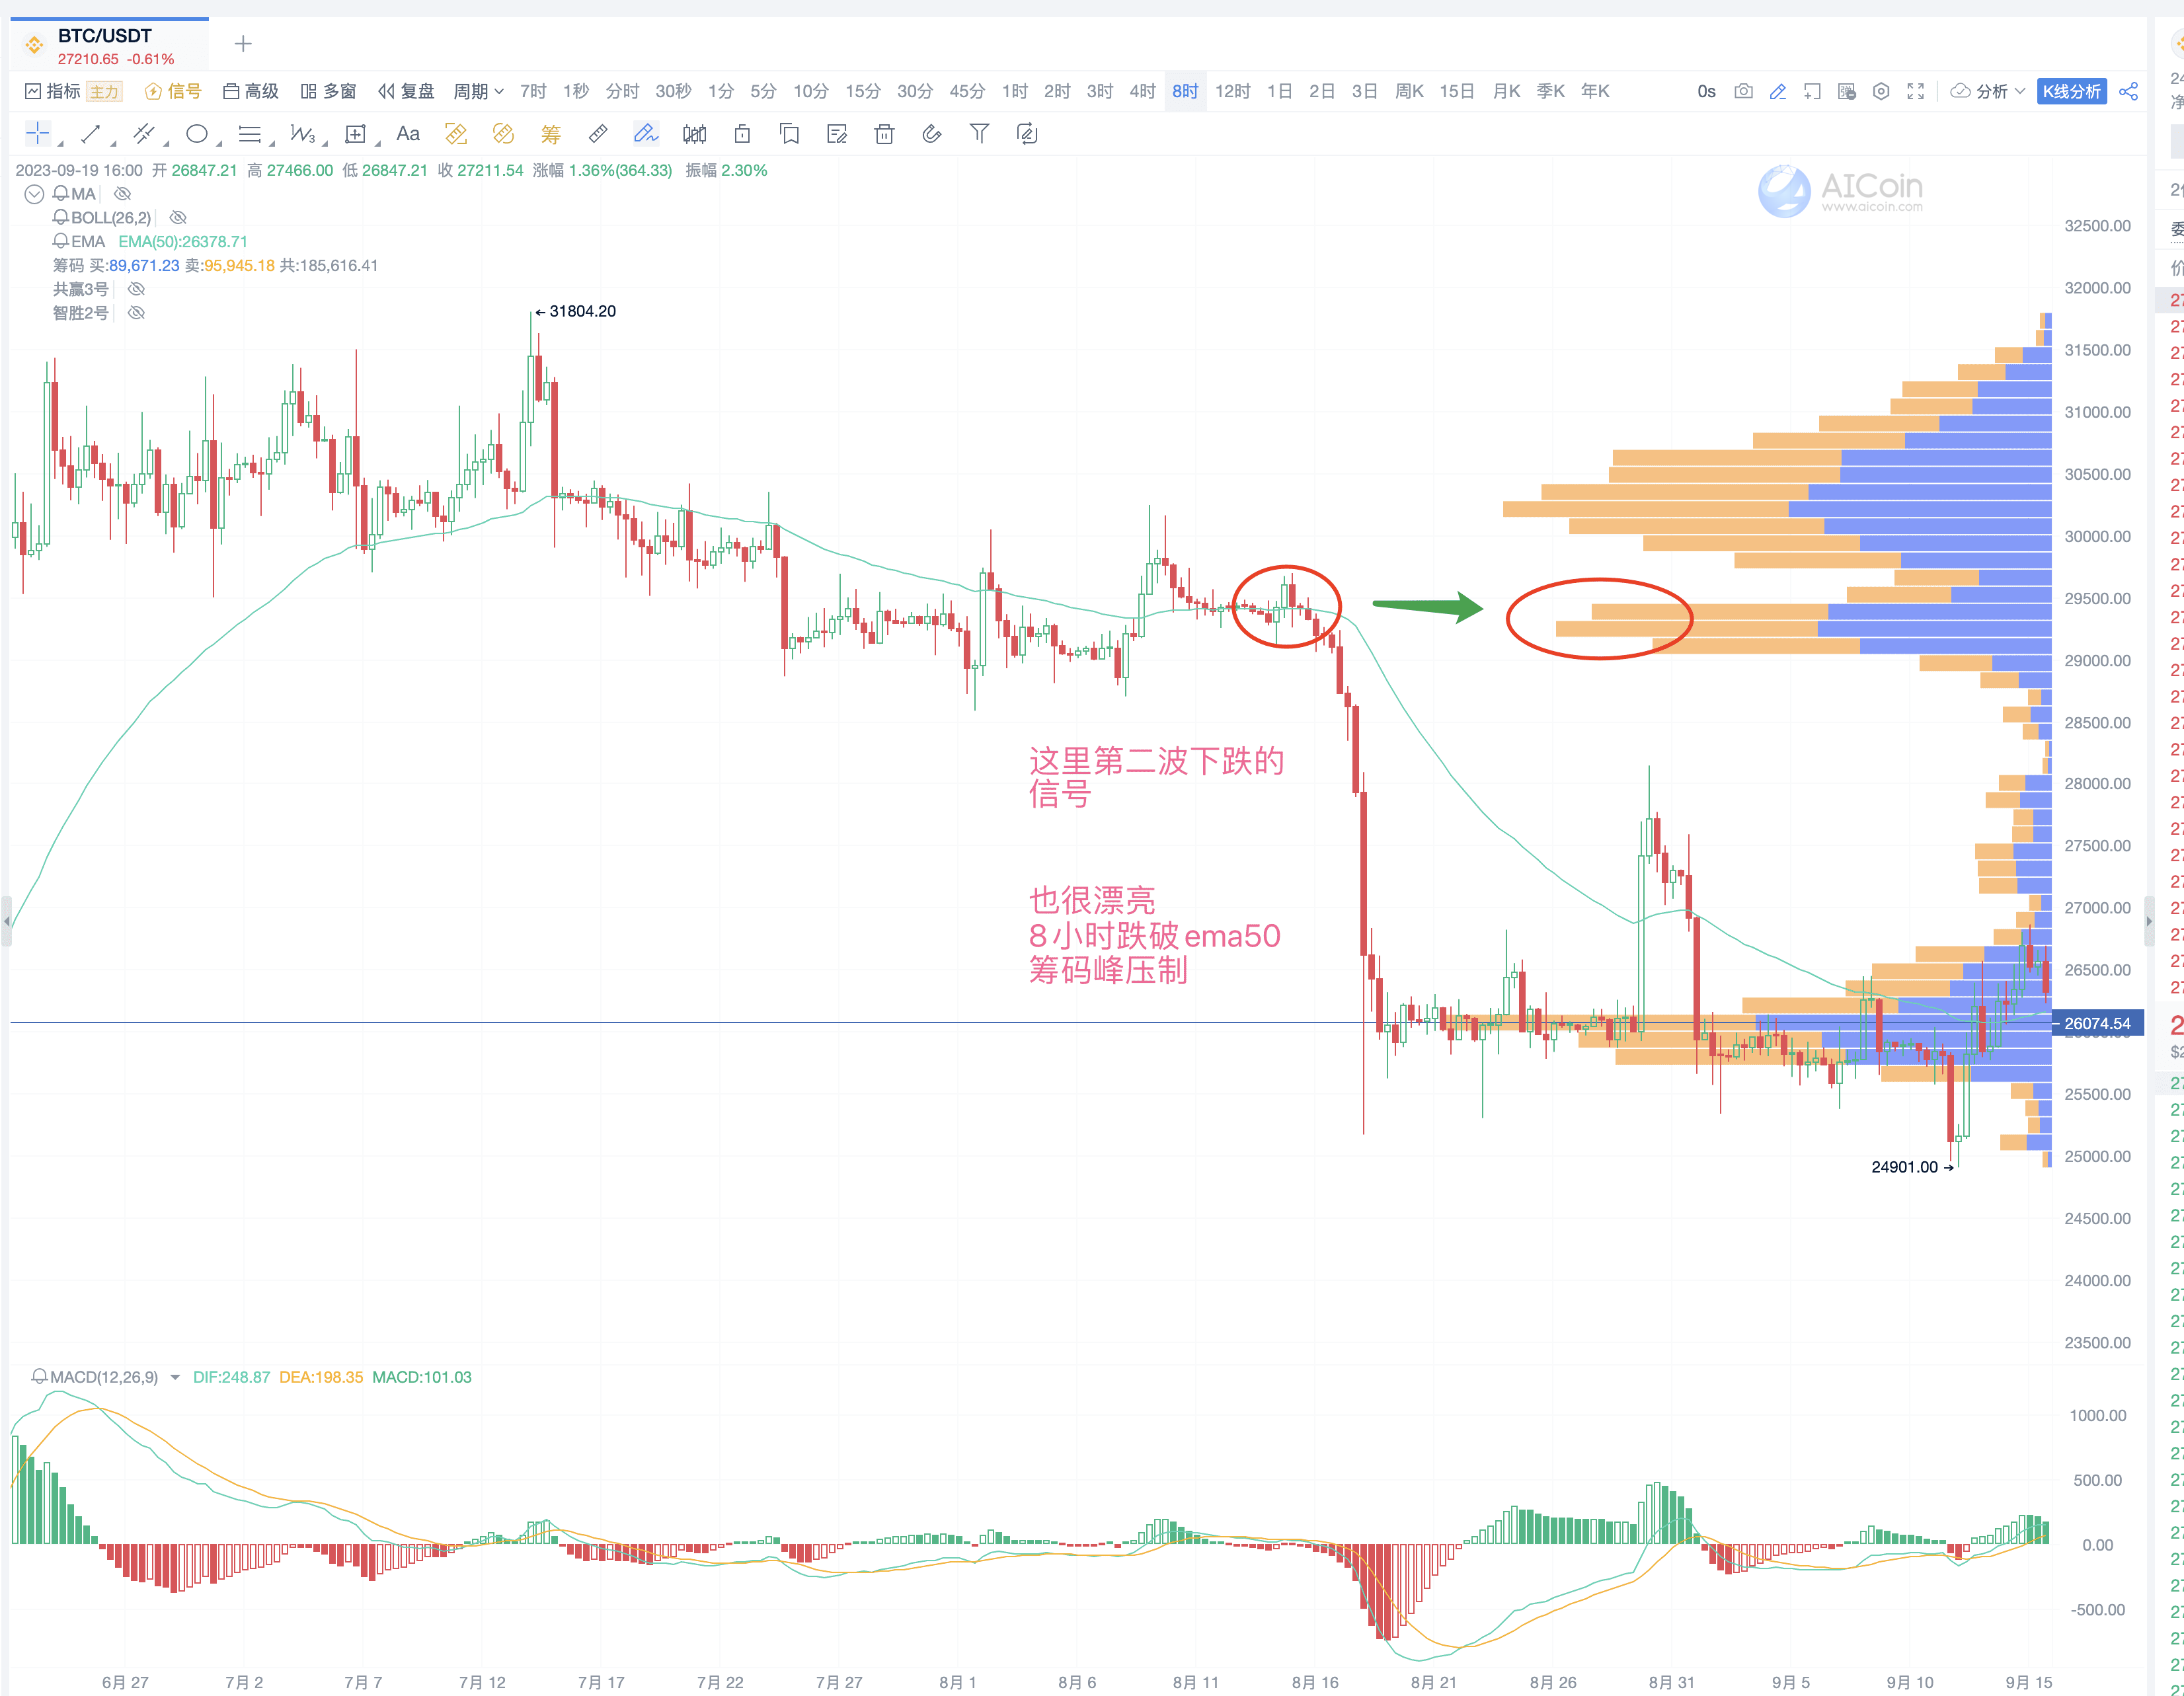
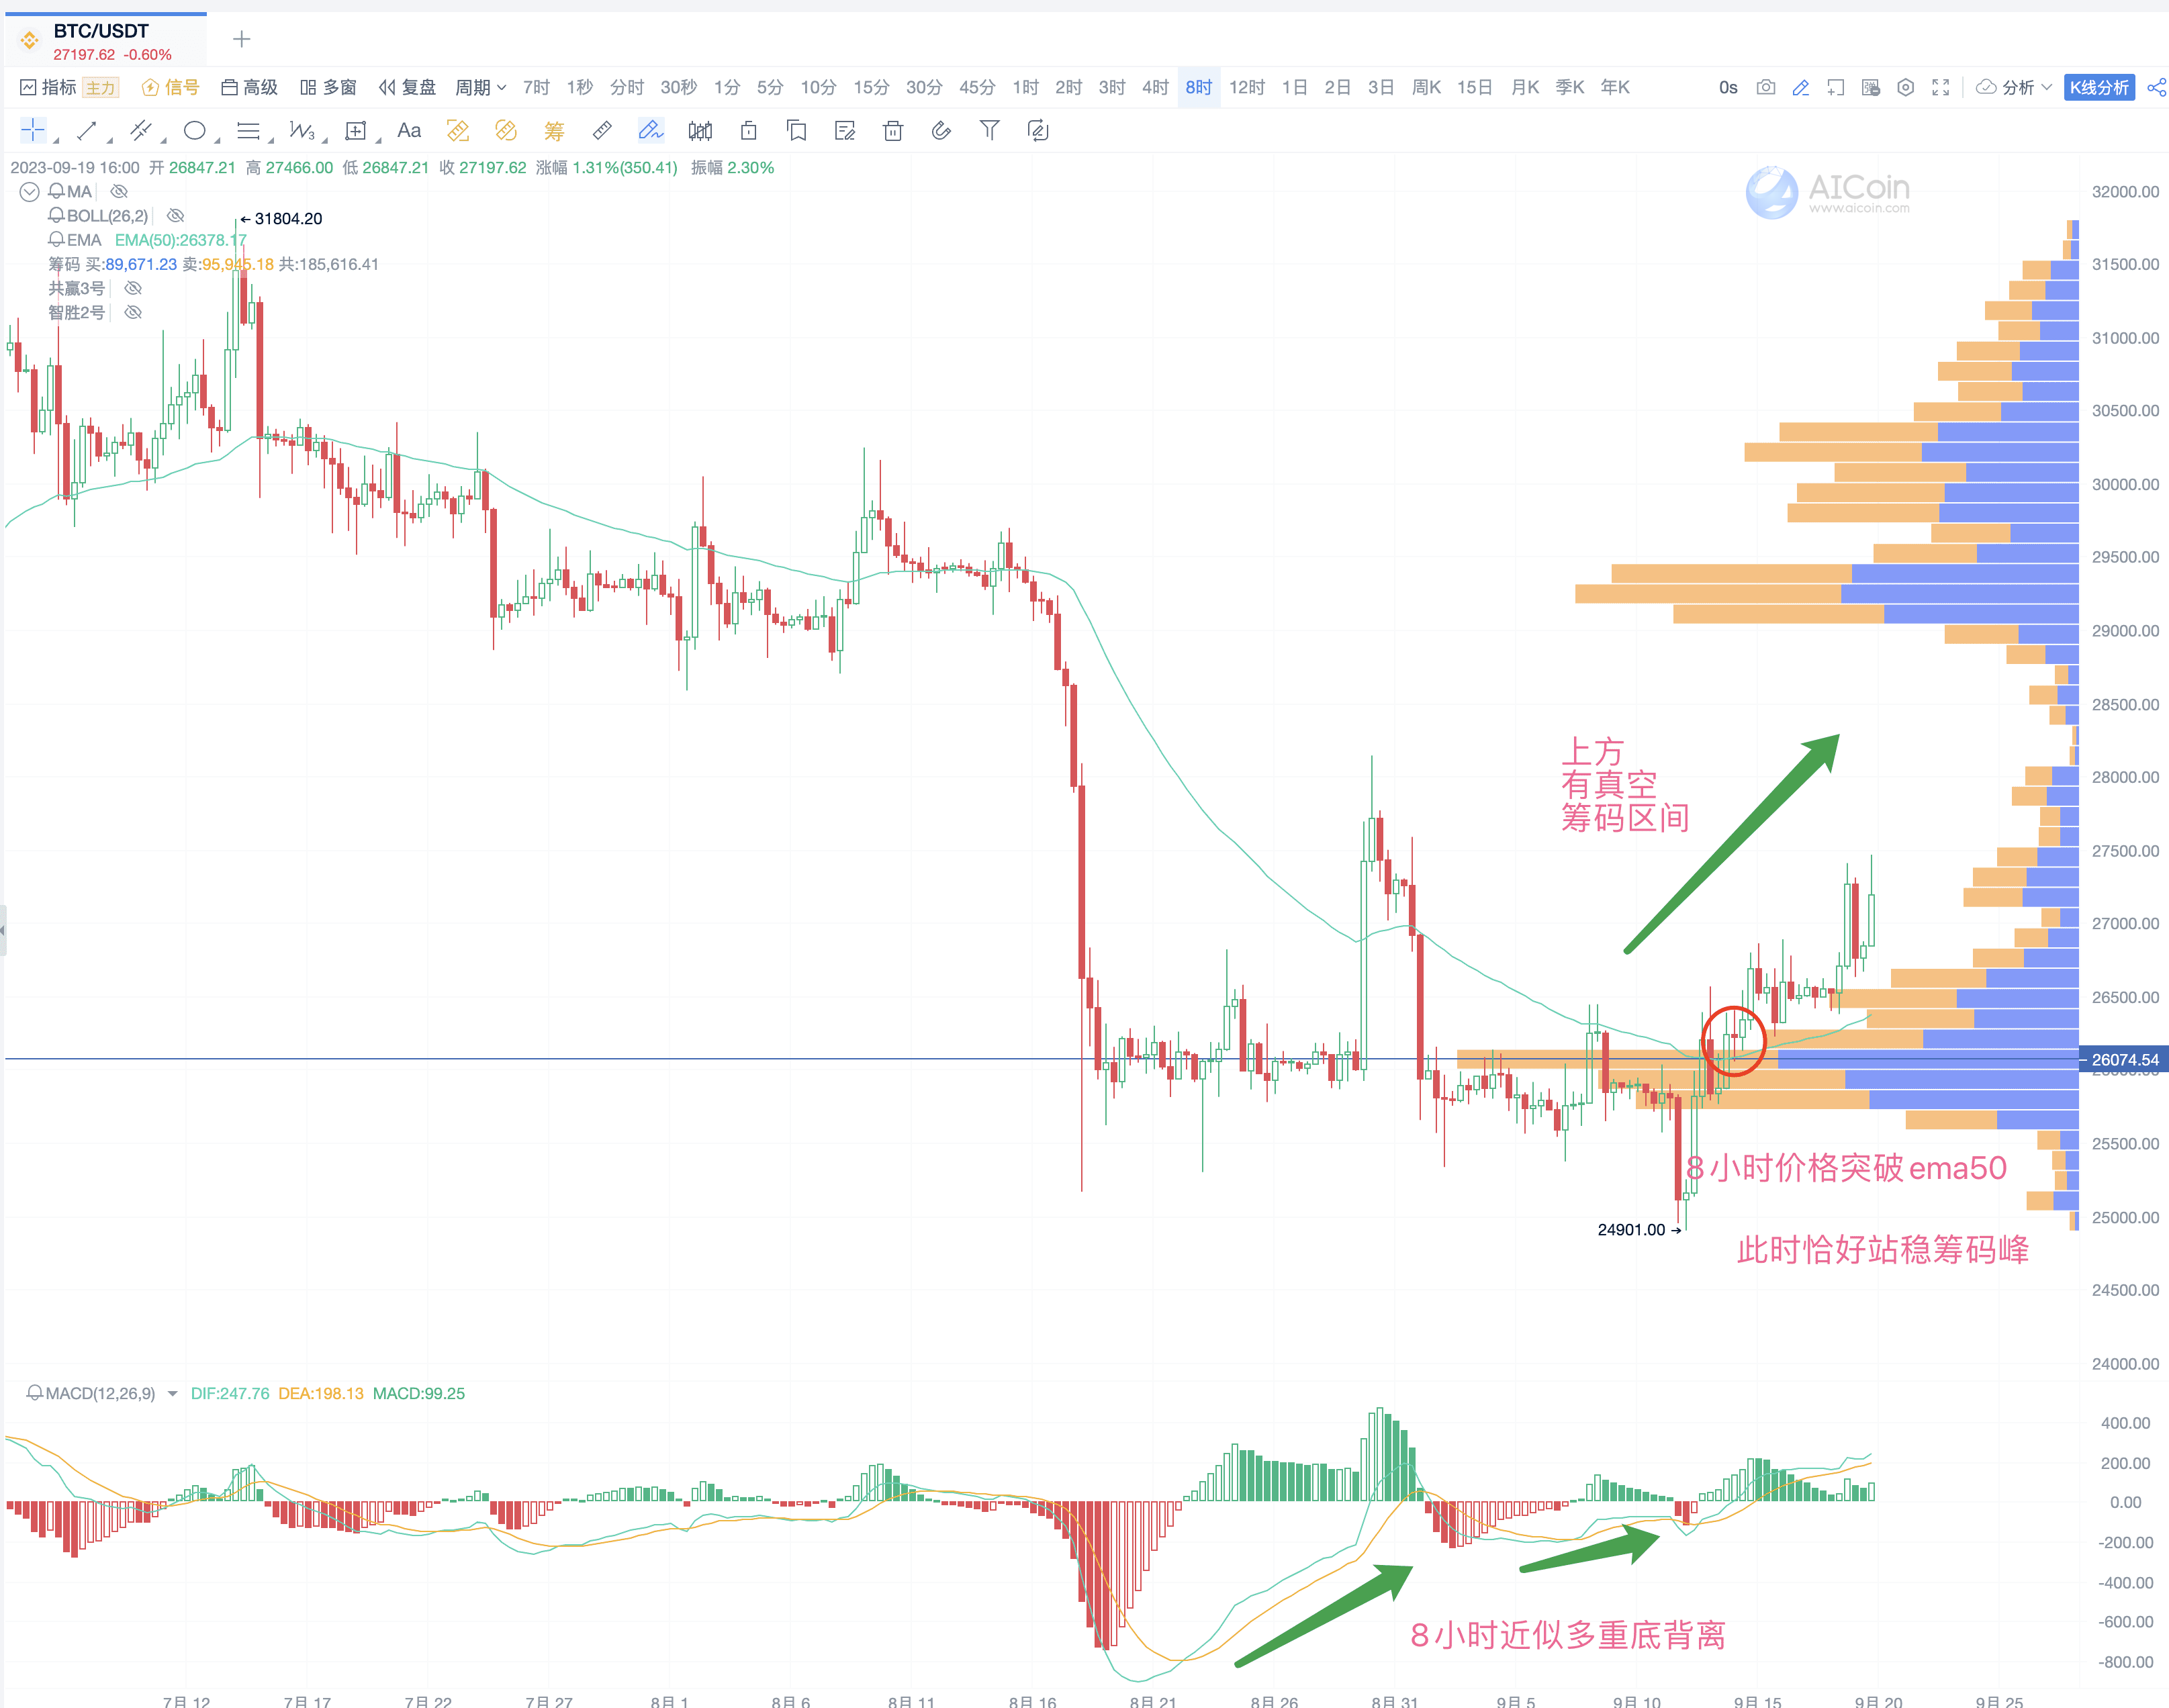
Chip distribution position
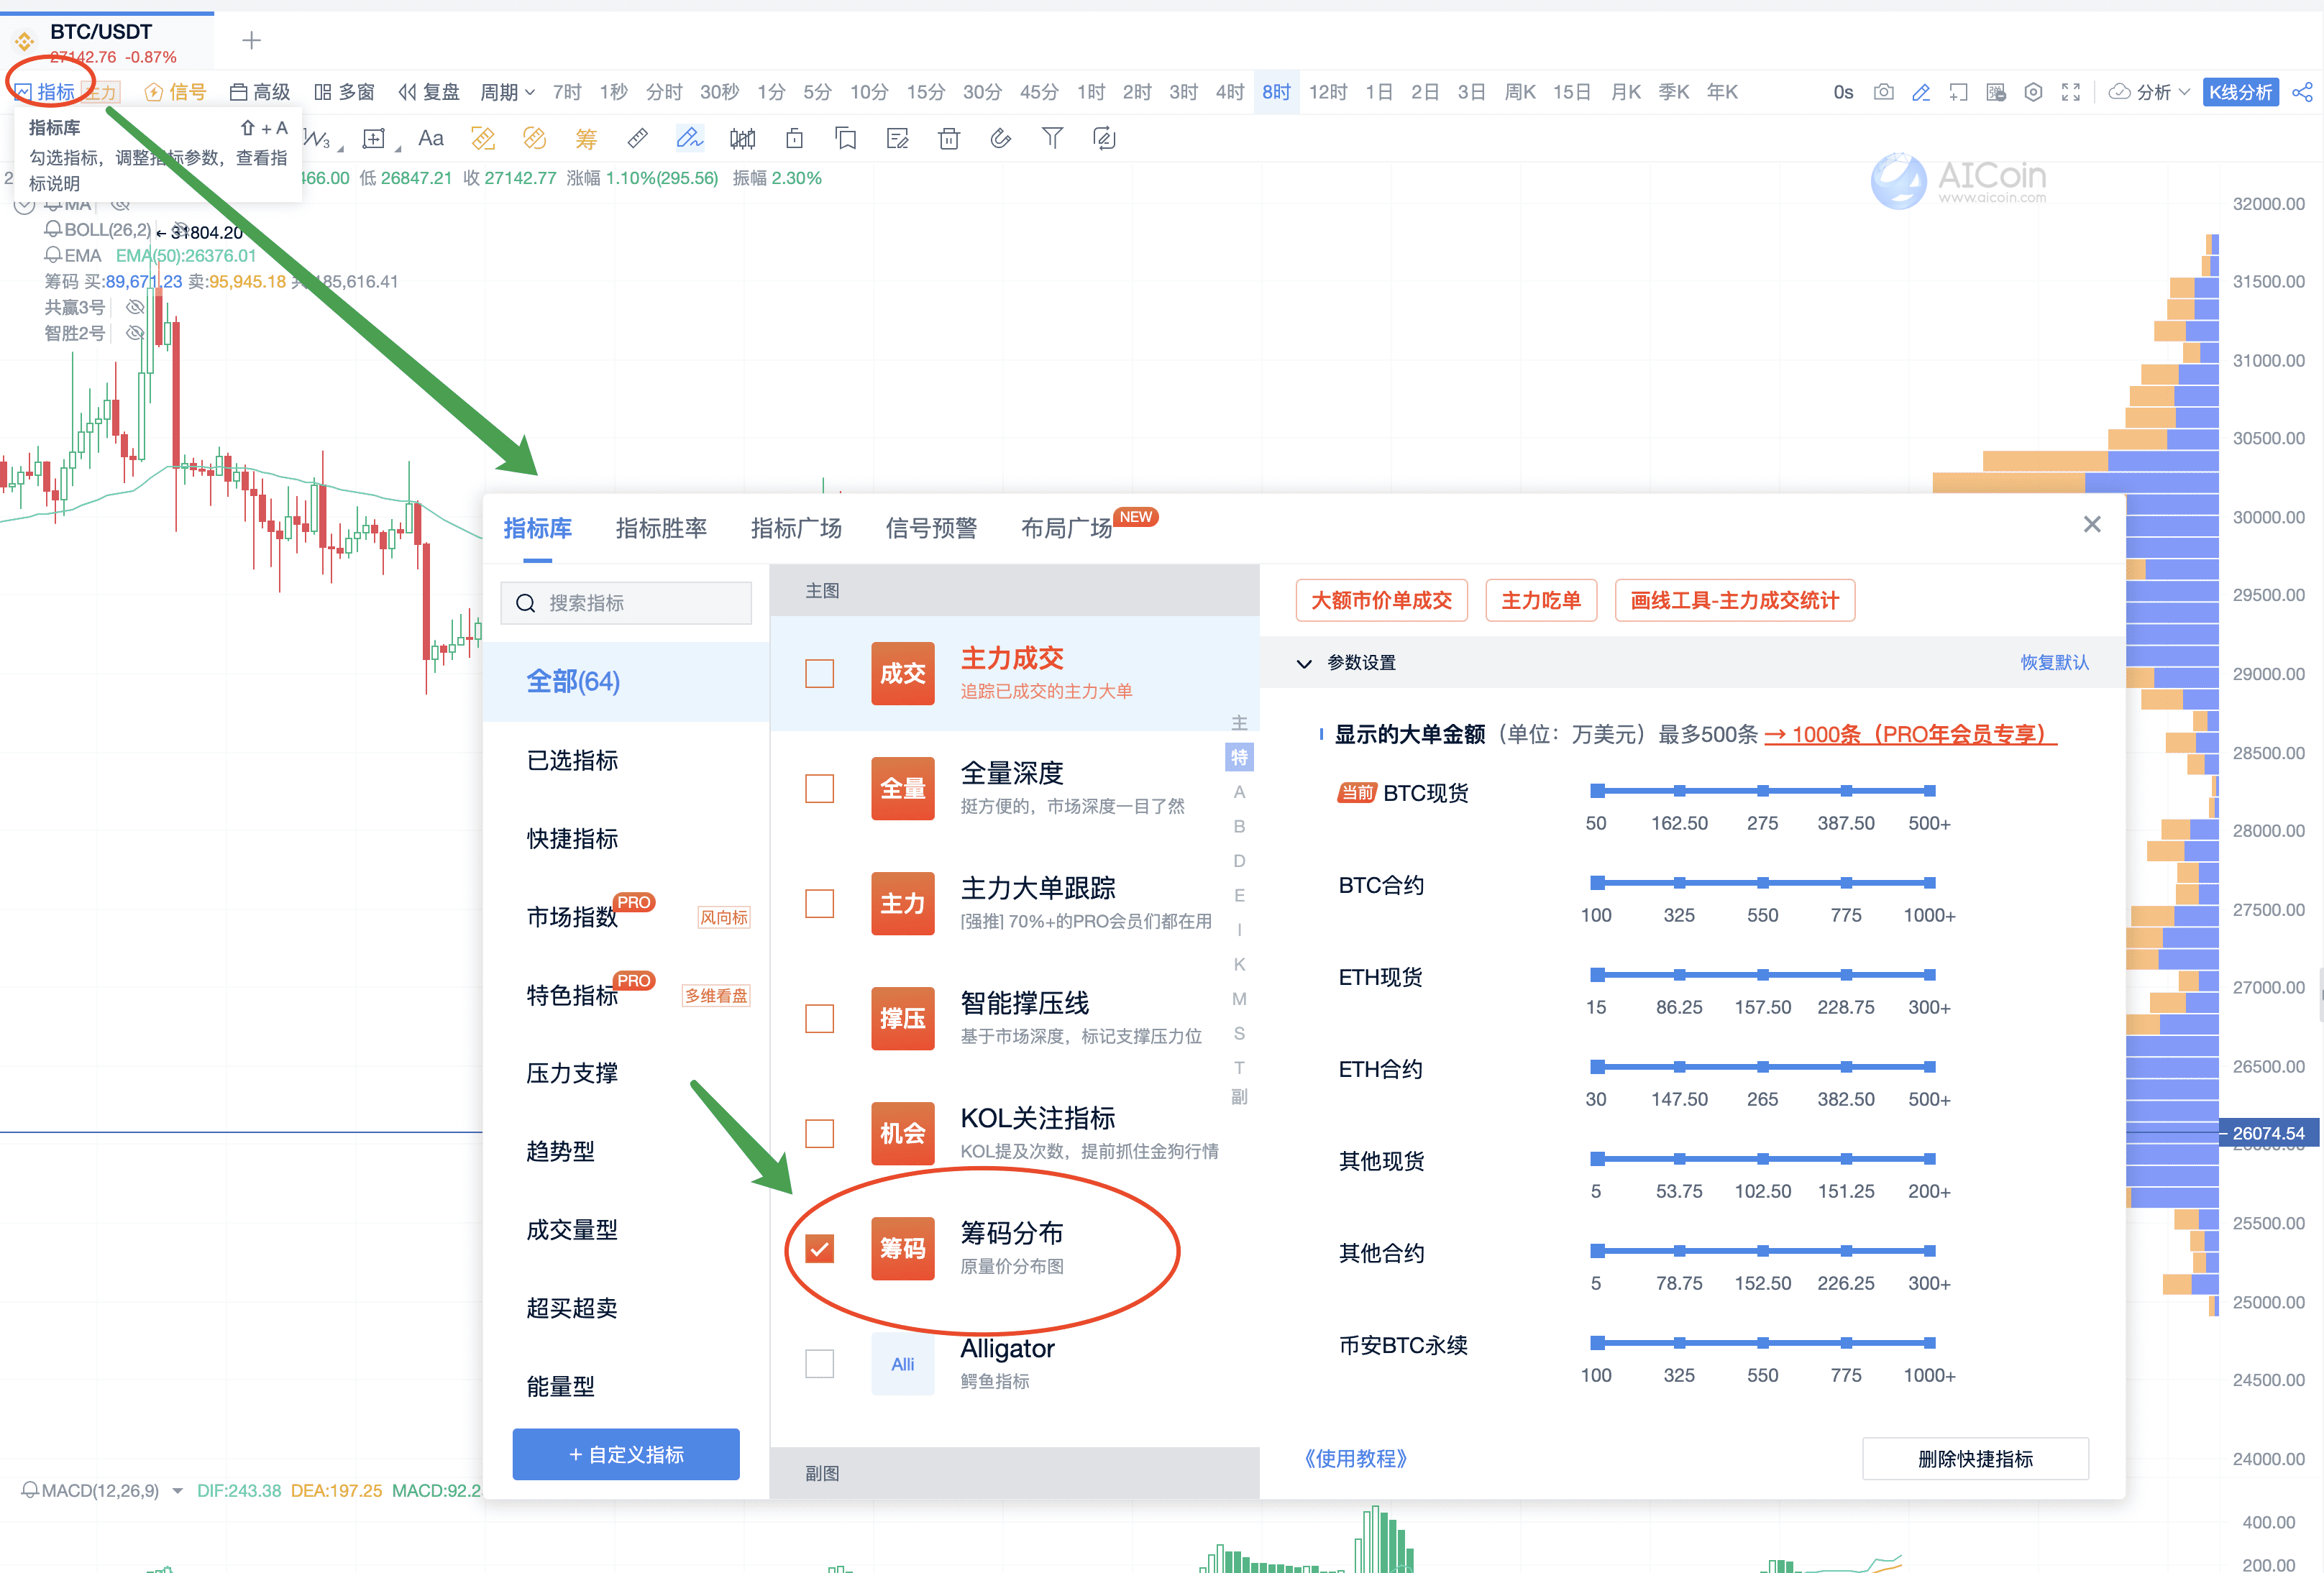
Chip distribution truly reflects the market's fund situation, combined with trend indicators like EMA, the success rate is very high.
Become a member to receive: https://aicoin.app/vip/chartpro
② ETH
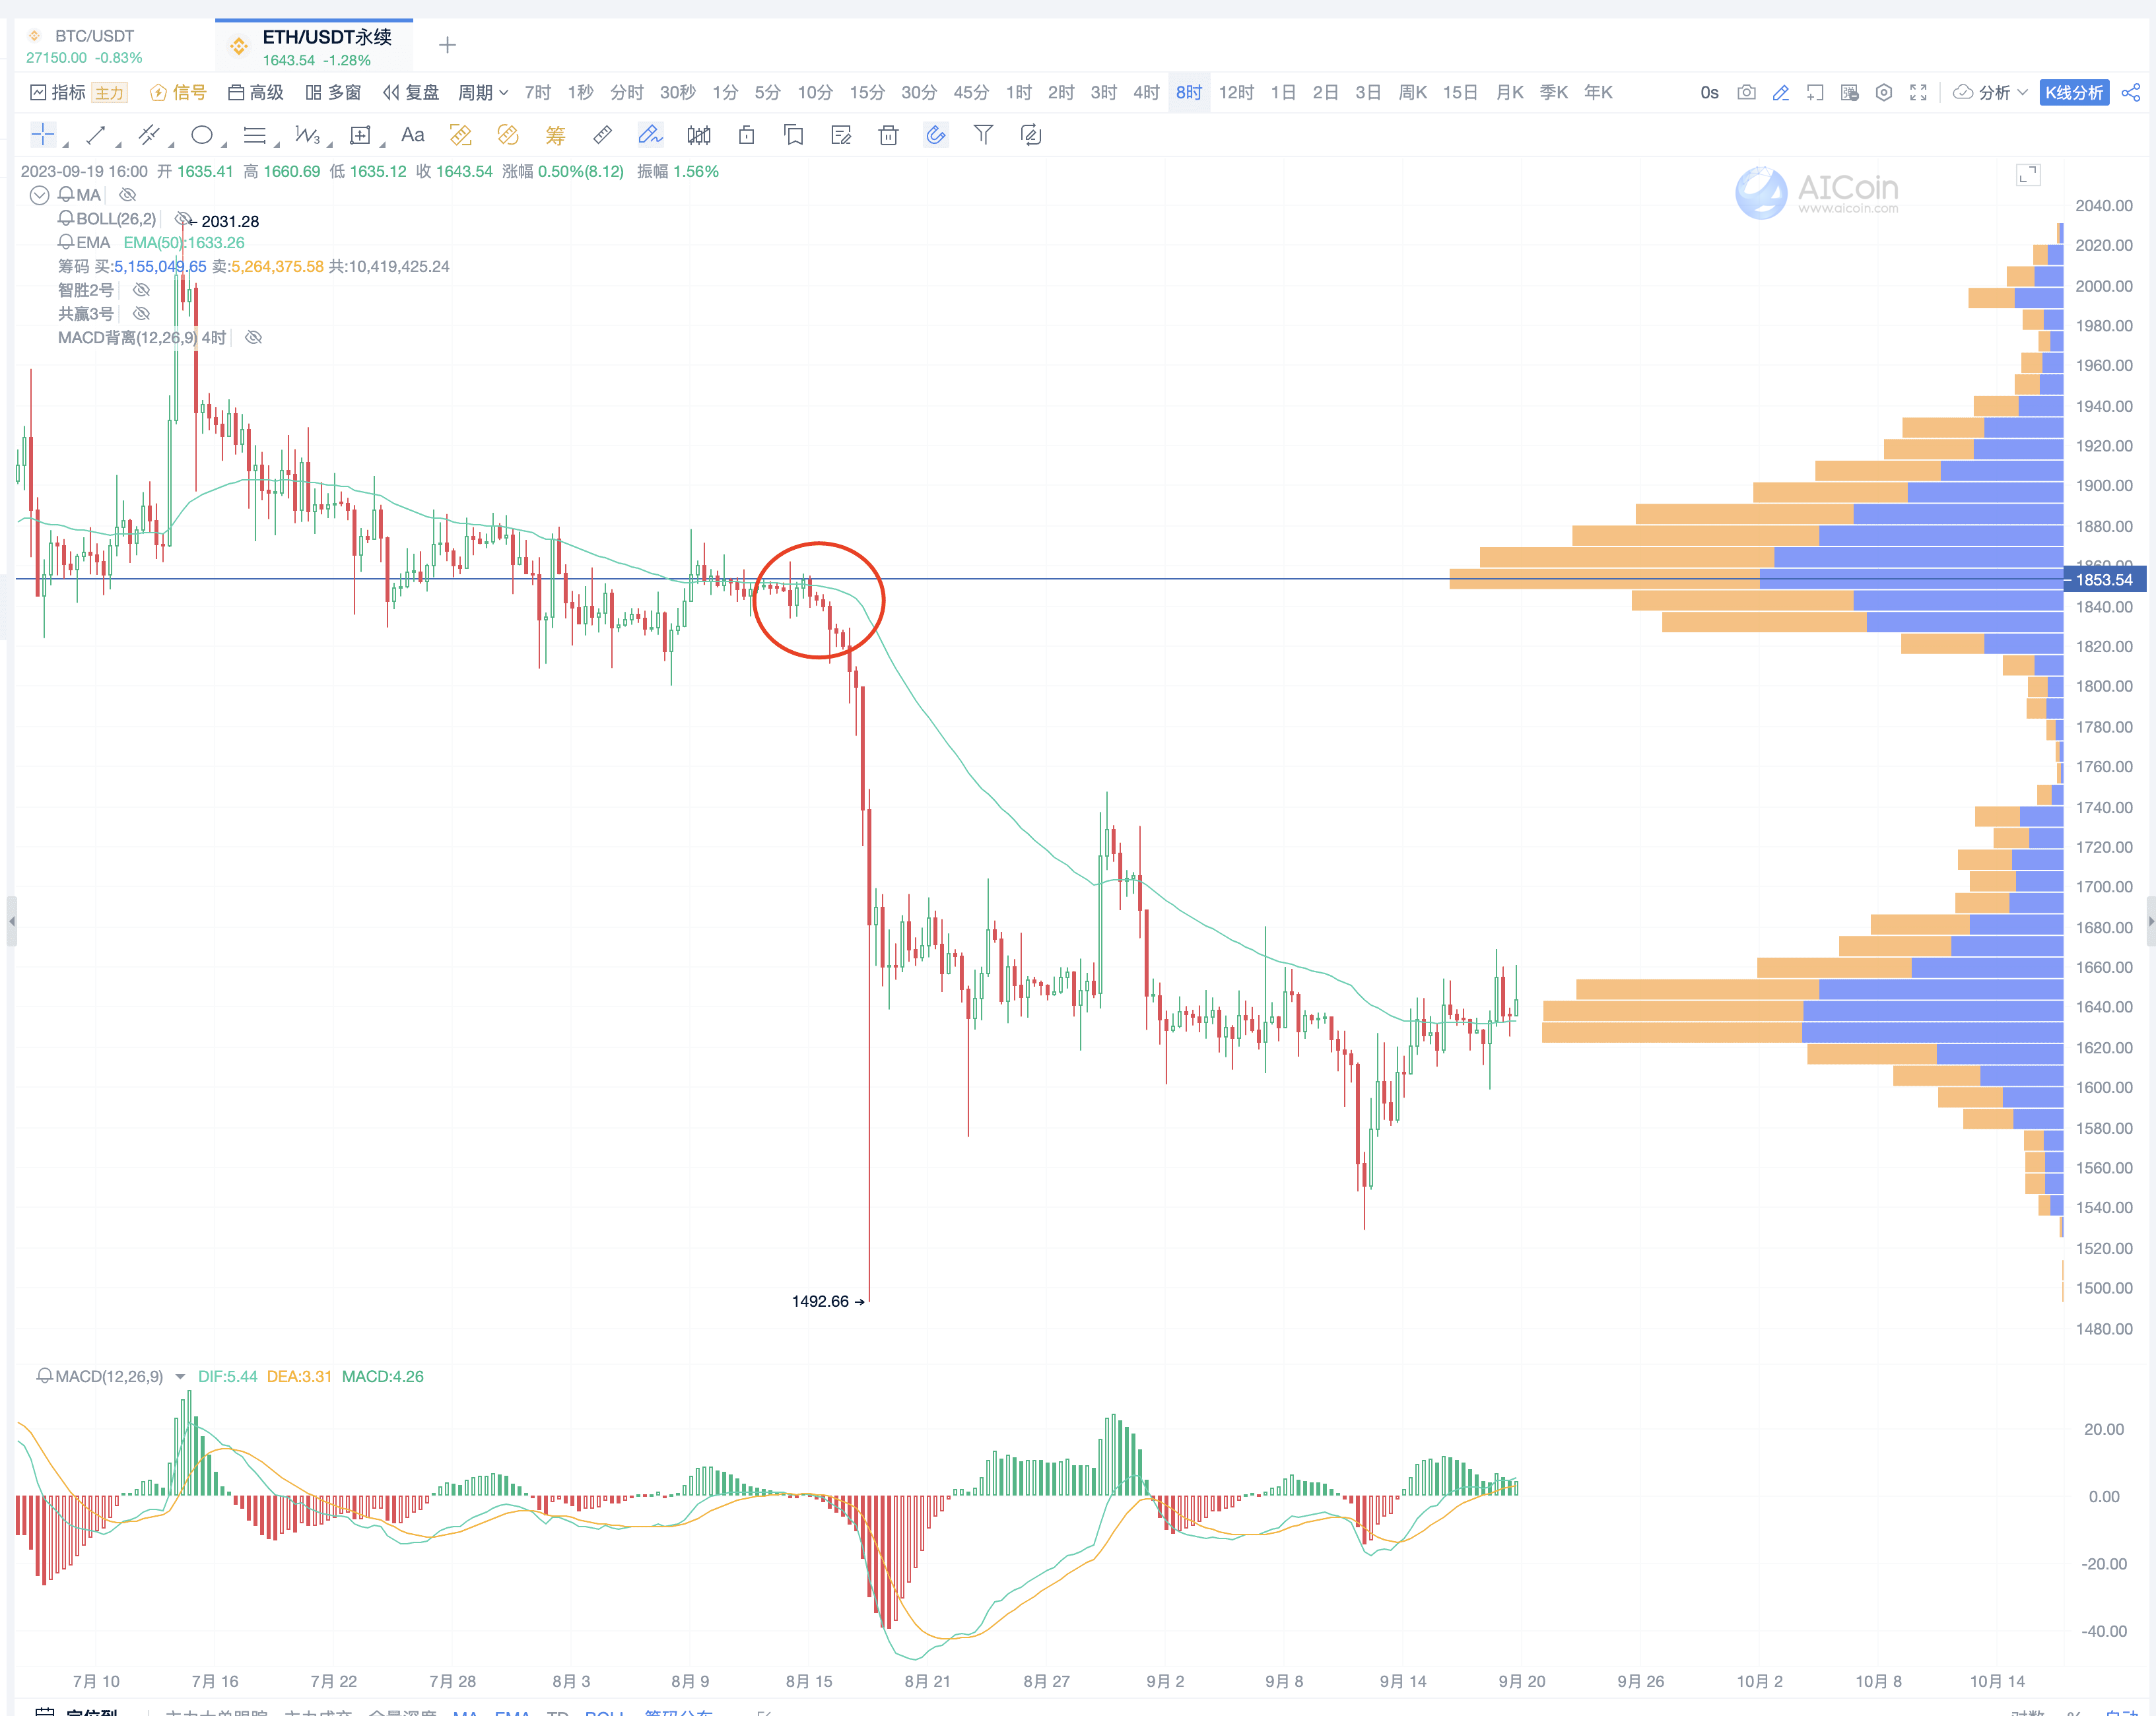
EMA tactics are suitable for periods: 8 hours, 2 hours, 45 minutes, 15 minutes
BTC 15 minutes
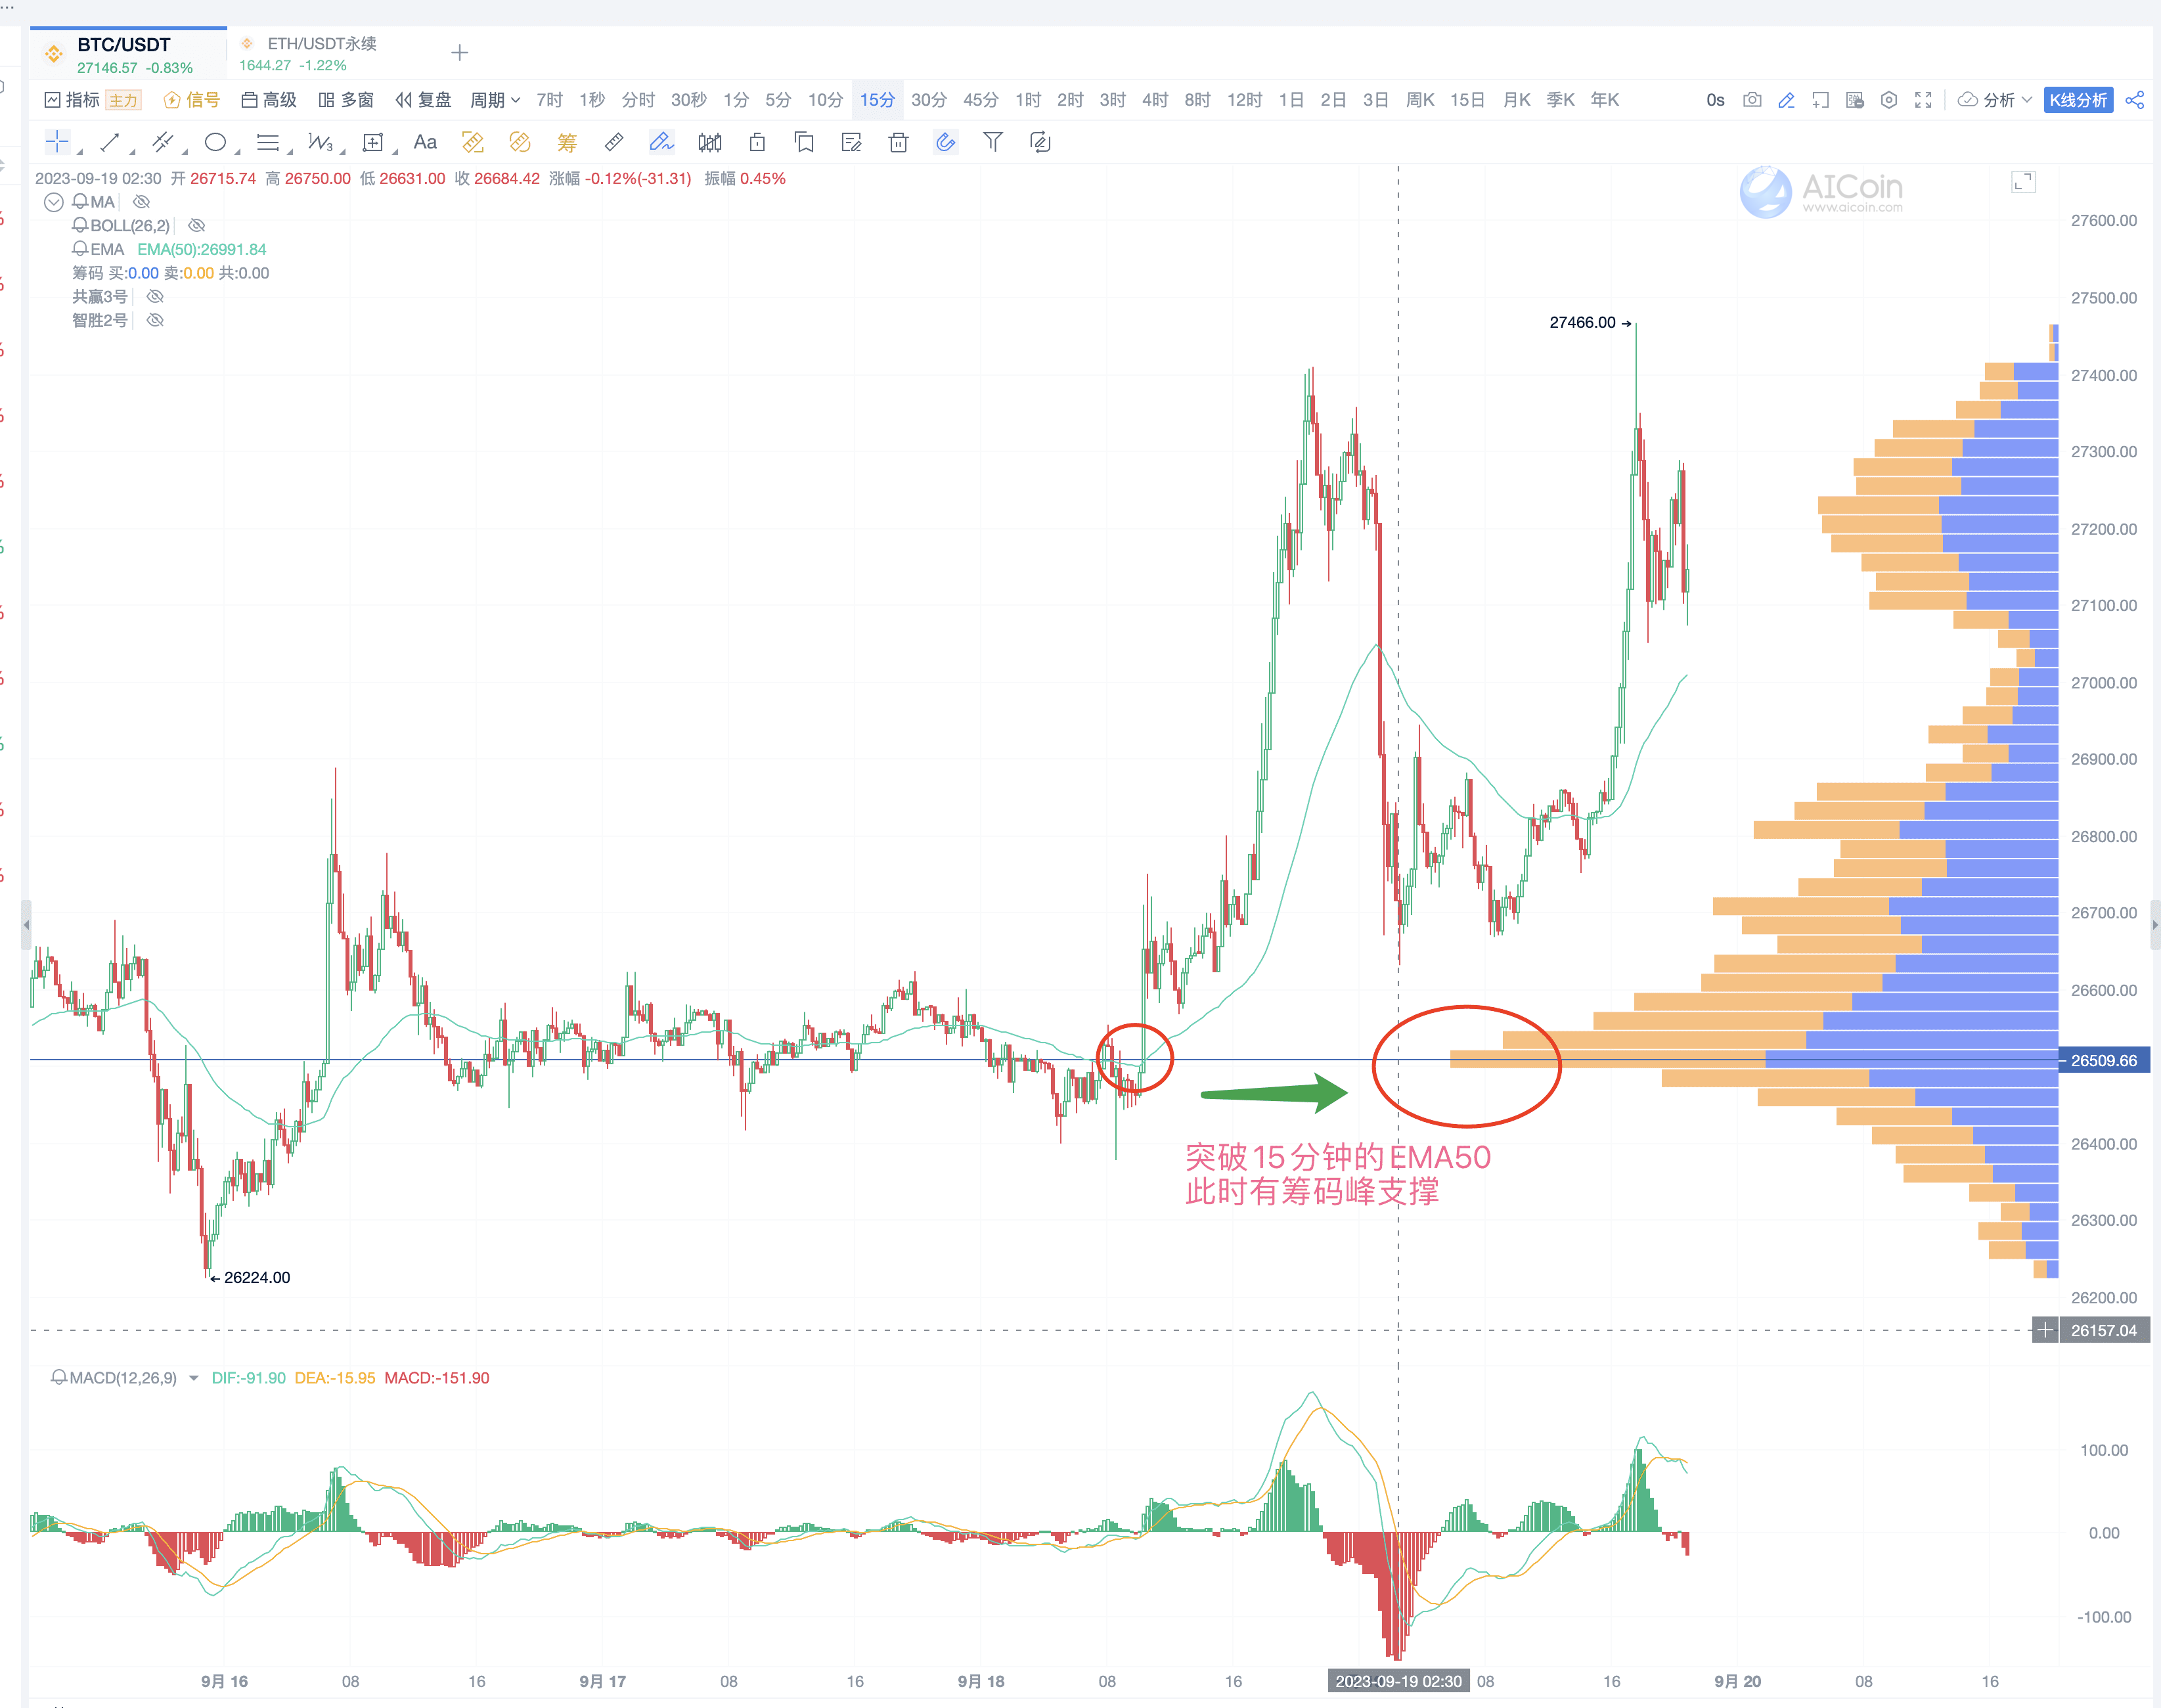
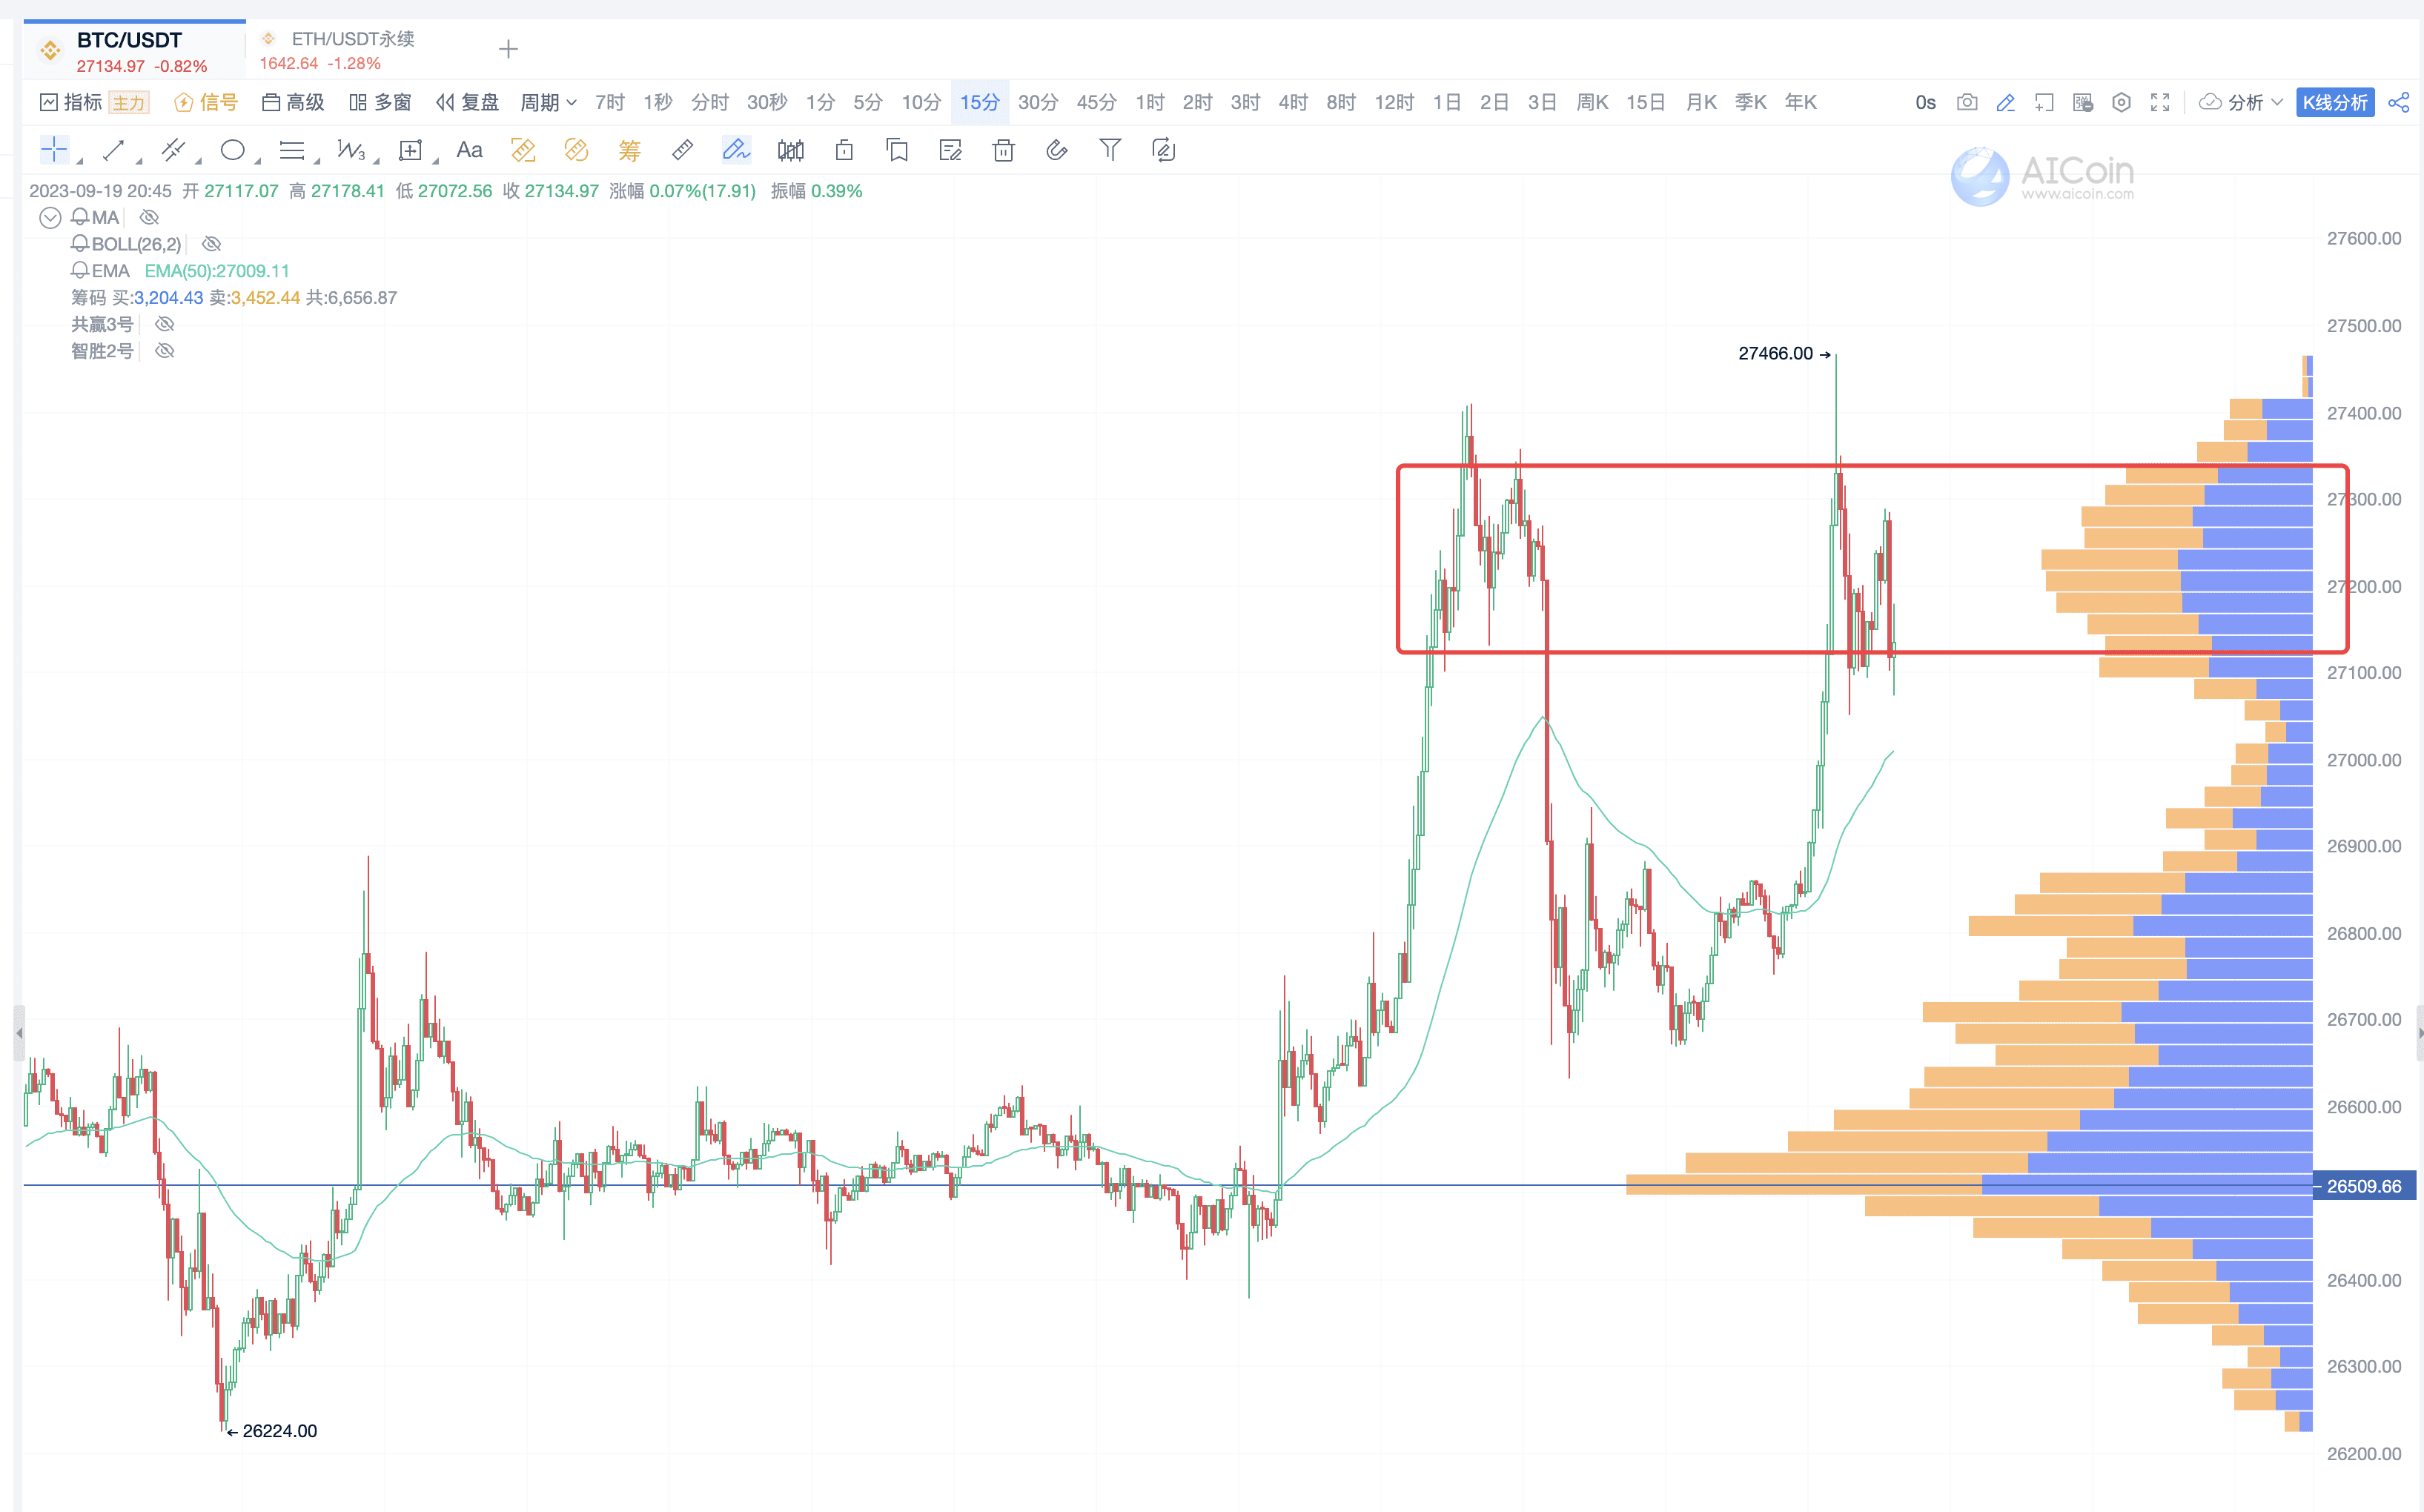
Cross-period trading system: https://aicoin.app/article/335045.html
Establish trend on a large period;
Find oscillation lows on a medium-level period;
Look for breakout entry points on a small-level period.
The most basic chart reading tricks: indicators + chip distribution + Fibonacci, where indicators can be MA or EMA.
II. Q&A Session
1. How to differentiate between breaking below the moving average as a bearish signal or as a support for further upward movement?
Breaking below the moving average indicates a bearish signal.
Recommended Reading
Teaching You to Find Suitable Targets for Grid Trading, No Longer Easily Broken
Unveiling the Market Makers from the Perspective of Chip Distribution
For more live content, please follow the AICoin "News/Information-Live Review" section, and feel free to download AICoin PC-end
免责声明:本文章仅代表作者个人观点,不代表本平台的立场和观点。本文章仅供信息分享,不构成对任何人的任何投资建议。用户与作者之间的任何争议,与本平台无关。如网页中刊载的文章或图片涉及侵权,请提供相关的权利证明和身份证明发送邮件到support@aicoin.com,本平台相关工作人员将会进行核查。


