On the evening of September 5th, AICoin researchers conducted a live graphic and text sharing session on the topic of "45-minute cycle trend trading tactics" in the AICoin PC End-Group Chat-Live. Here is a summary of the live content.
Review of last week: Gold Cycle--8-hour cycle trend trading tactics
Tactic One: 45-minute Cycle + EMA Tactics
Cycle Selection: 45 minutes
Indicator Selection: EMA50
Usage:
When crossing above EMA50, it is highly likely to be bullish. If the chip distribution support is stable at this time, consider entering the market;
When crossing below EMA50, it is highly likely to be bearish. If there is chip distribution pressure above at this time, consider exiting the market.
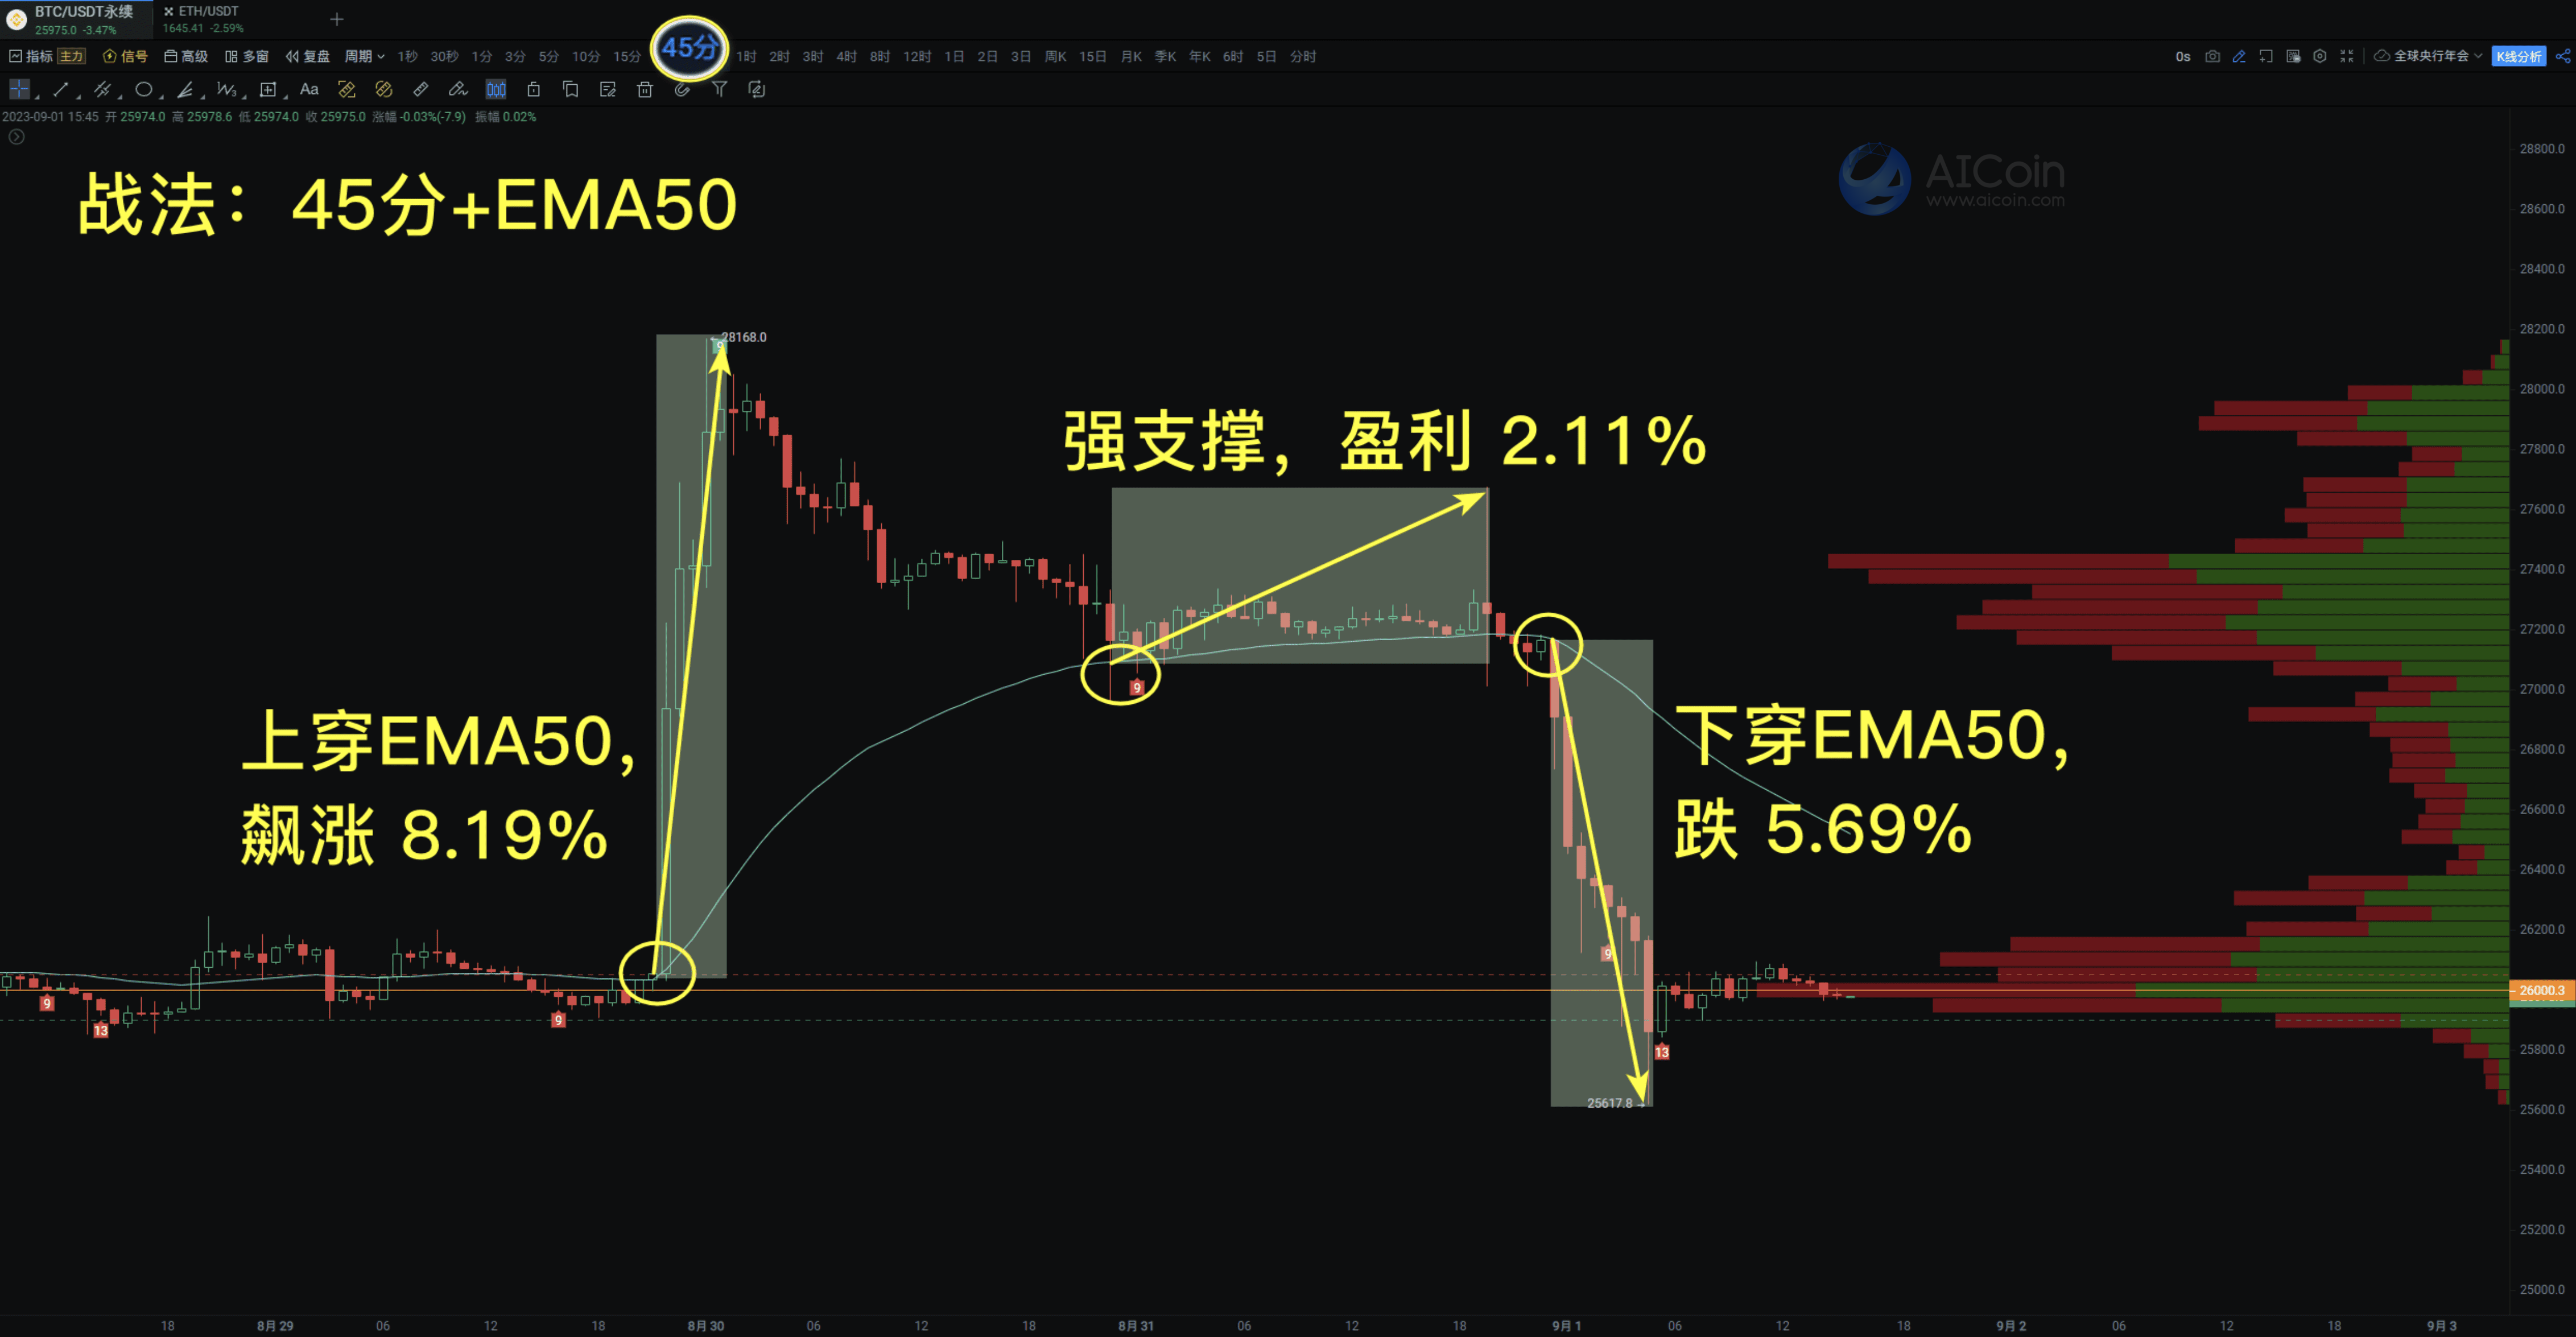
Explanation of the above figure:
First point, pay attention to the direction of the 45-minute price movement;
Second point, observe the relationship between EMA50 and the price;
Third point, pay attention to the chip distribution support and pressure levels.
Example Analysis: ETH/USDT Perpetual
Step 1: Select the indicator and choose to use EMA with a 45-minute period.

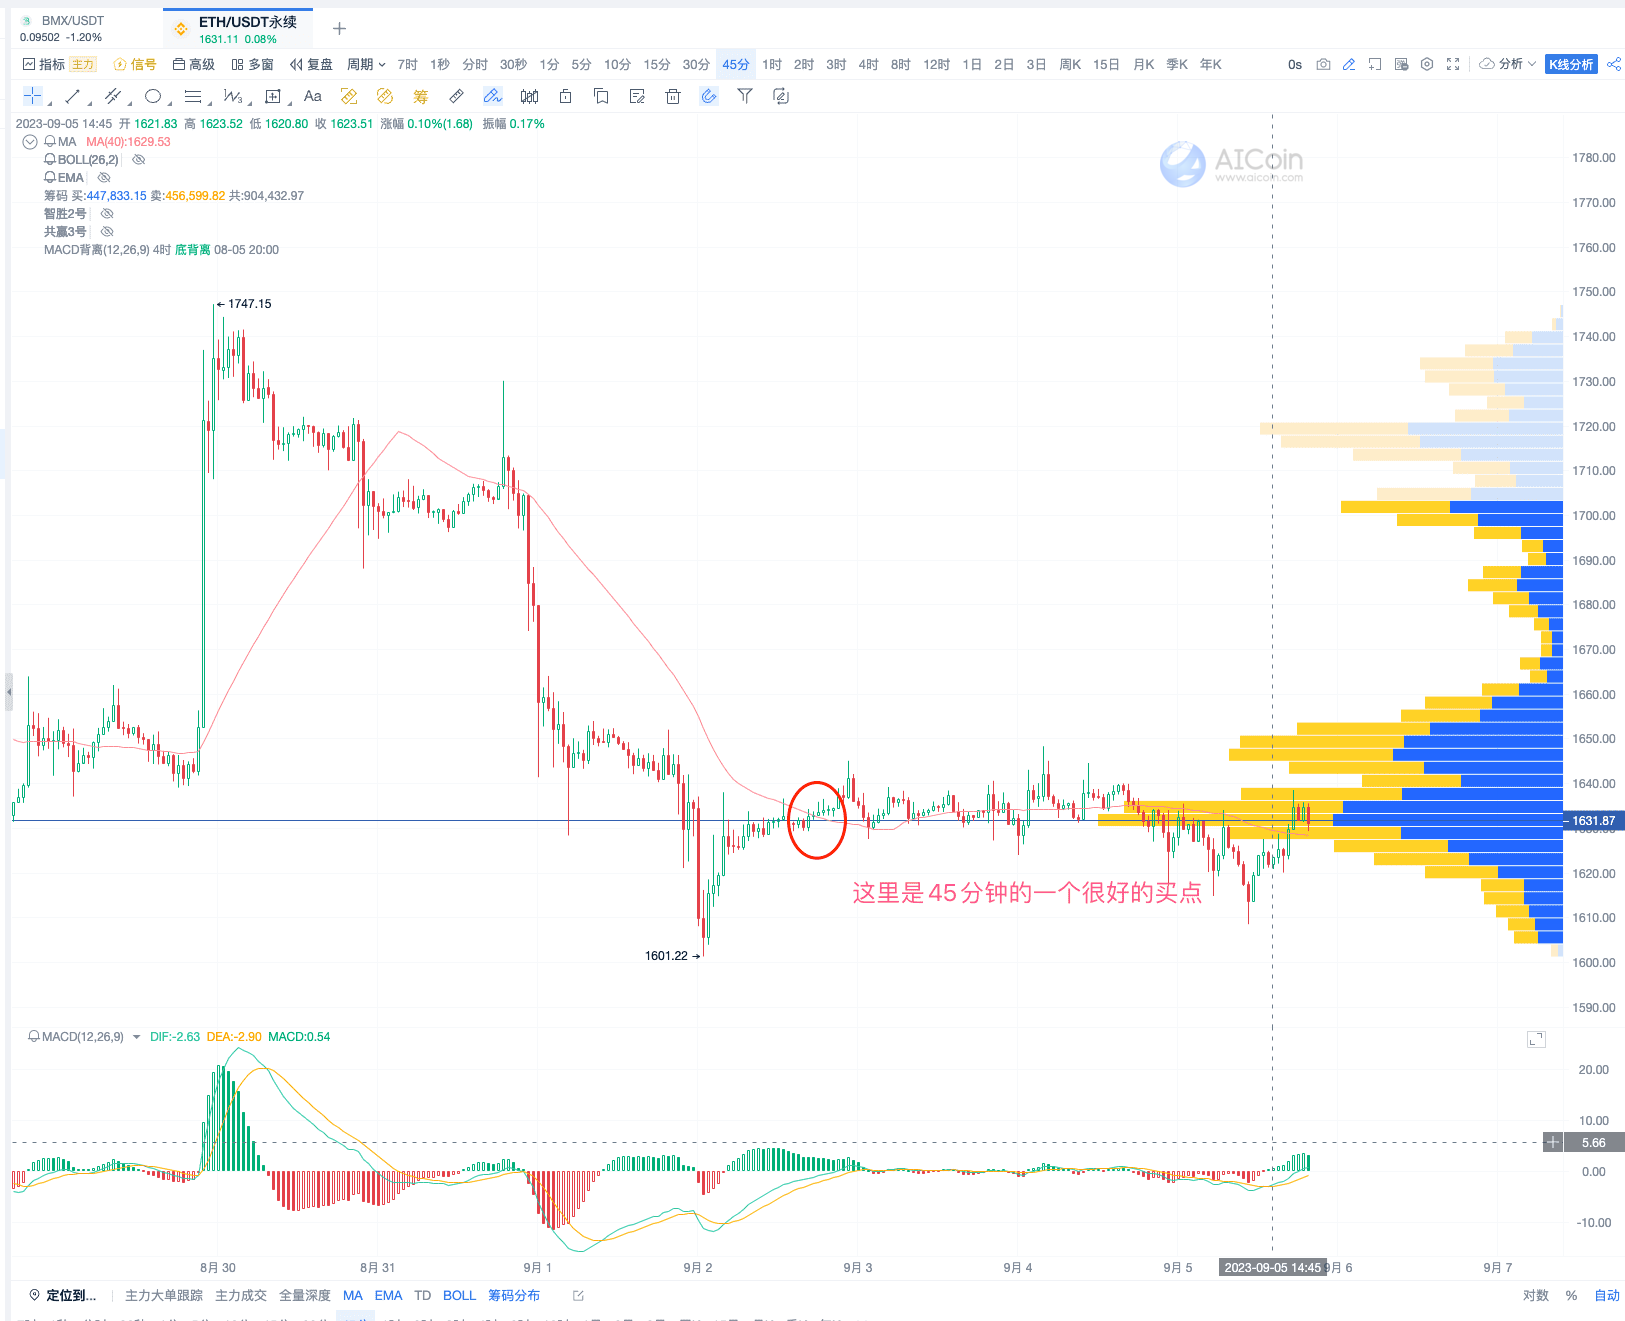
During the live broadcast, ETH happened to touch the rule: crossing above EMA50, highly likely to be bullish. If the chip distribution support is stable at this time, consider entering the market.
Reasoning:
First, in the 45-minute cycle, it crossed above EMA50;
Second, there is chip support at this position;
Third, there is a MACD bullish divergence ahead.
Stop-loss Methods
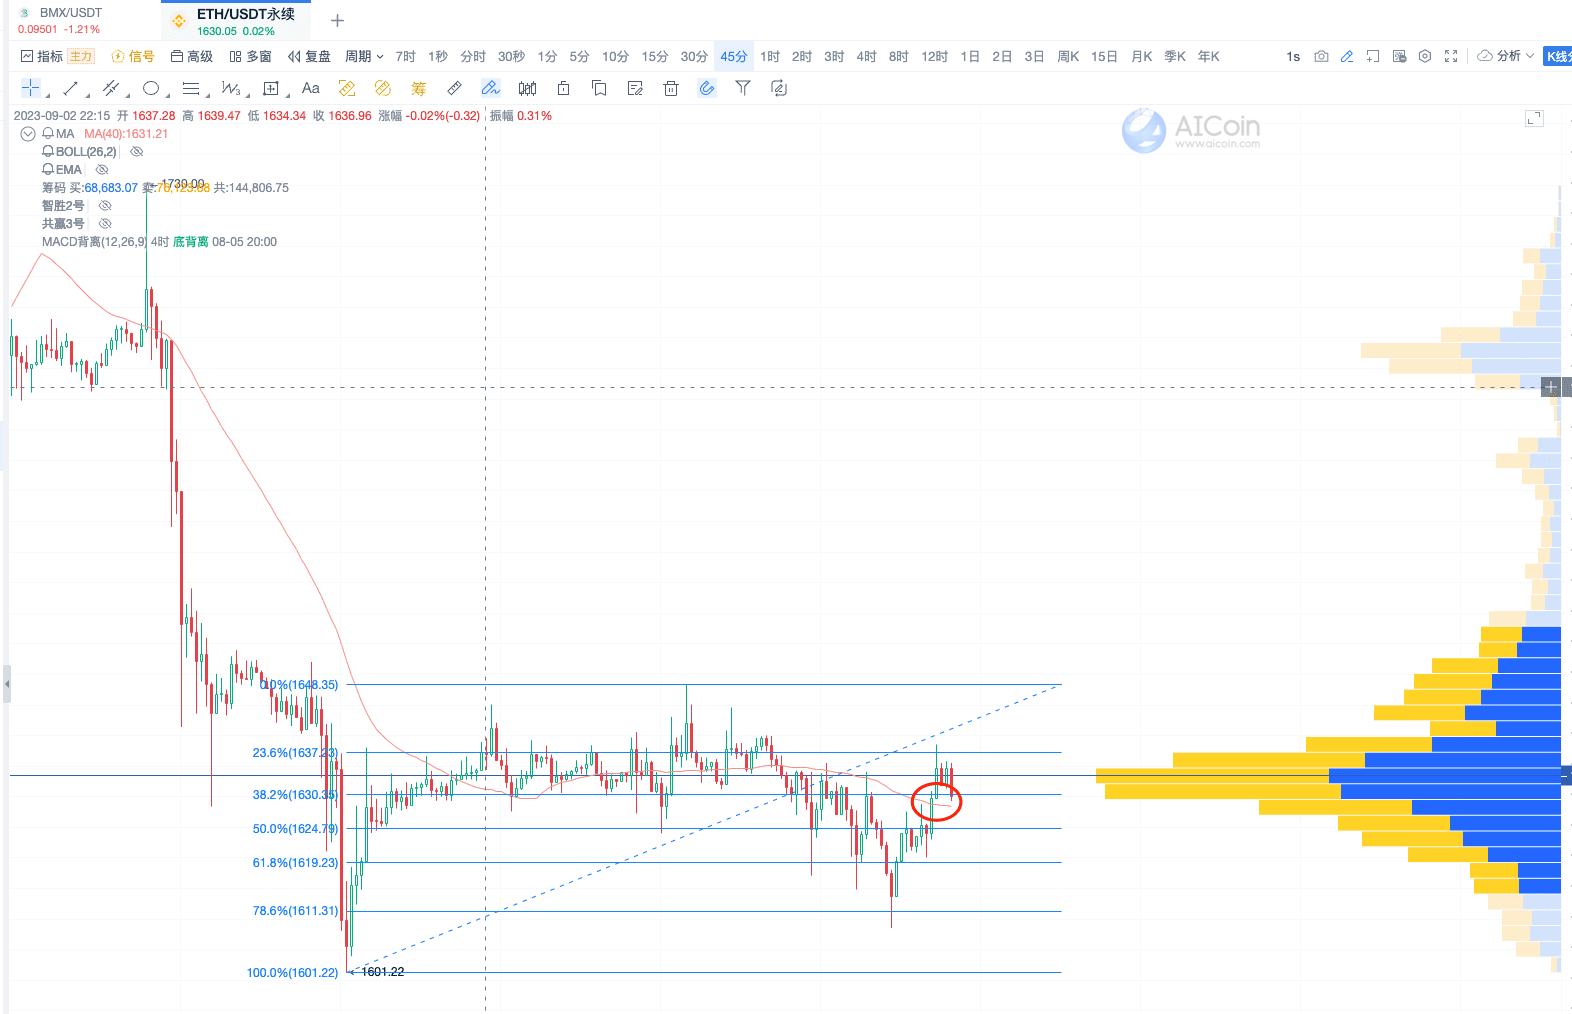
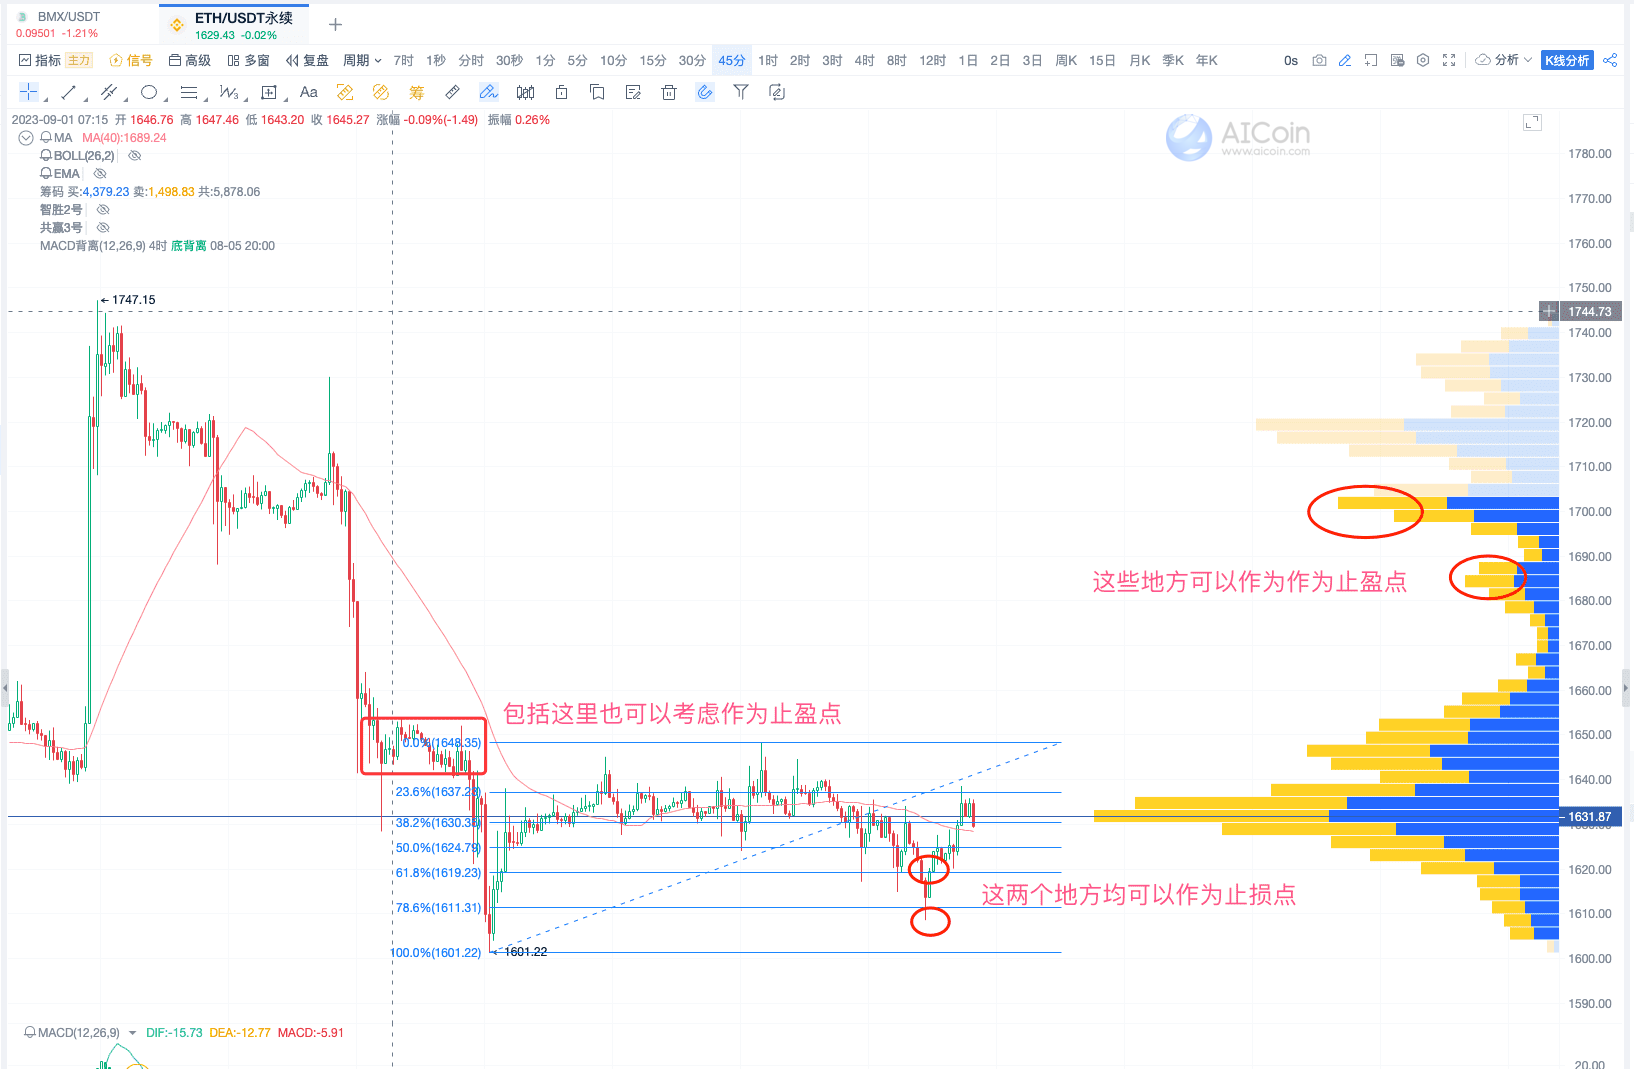
(1) For those with lower risk tolerance, consider placing a stop-loss at the position of the previous MACD bullish divergence;
(2) For those with higher risk tolerance, consider placing a stop-loss at the position of the previous low at 1601.
During the live broadcast, Fibonacci was used, and there was a signal around 0.382 of EMA50.
Tactic Two: 45-minute Cycle + MA Tactics
Cycle Selection: 45 minutes
Indicator Selection: MA40
Usage:
When the price crosses above MA40, it is highly likely to be bullish. If the chip distribution support is stable at this time, consider entering the market;
When the price crosses below MA40, it is highly likely to be bearish. If there is chip distribution pressure above the price at this time, consider exiting the market.
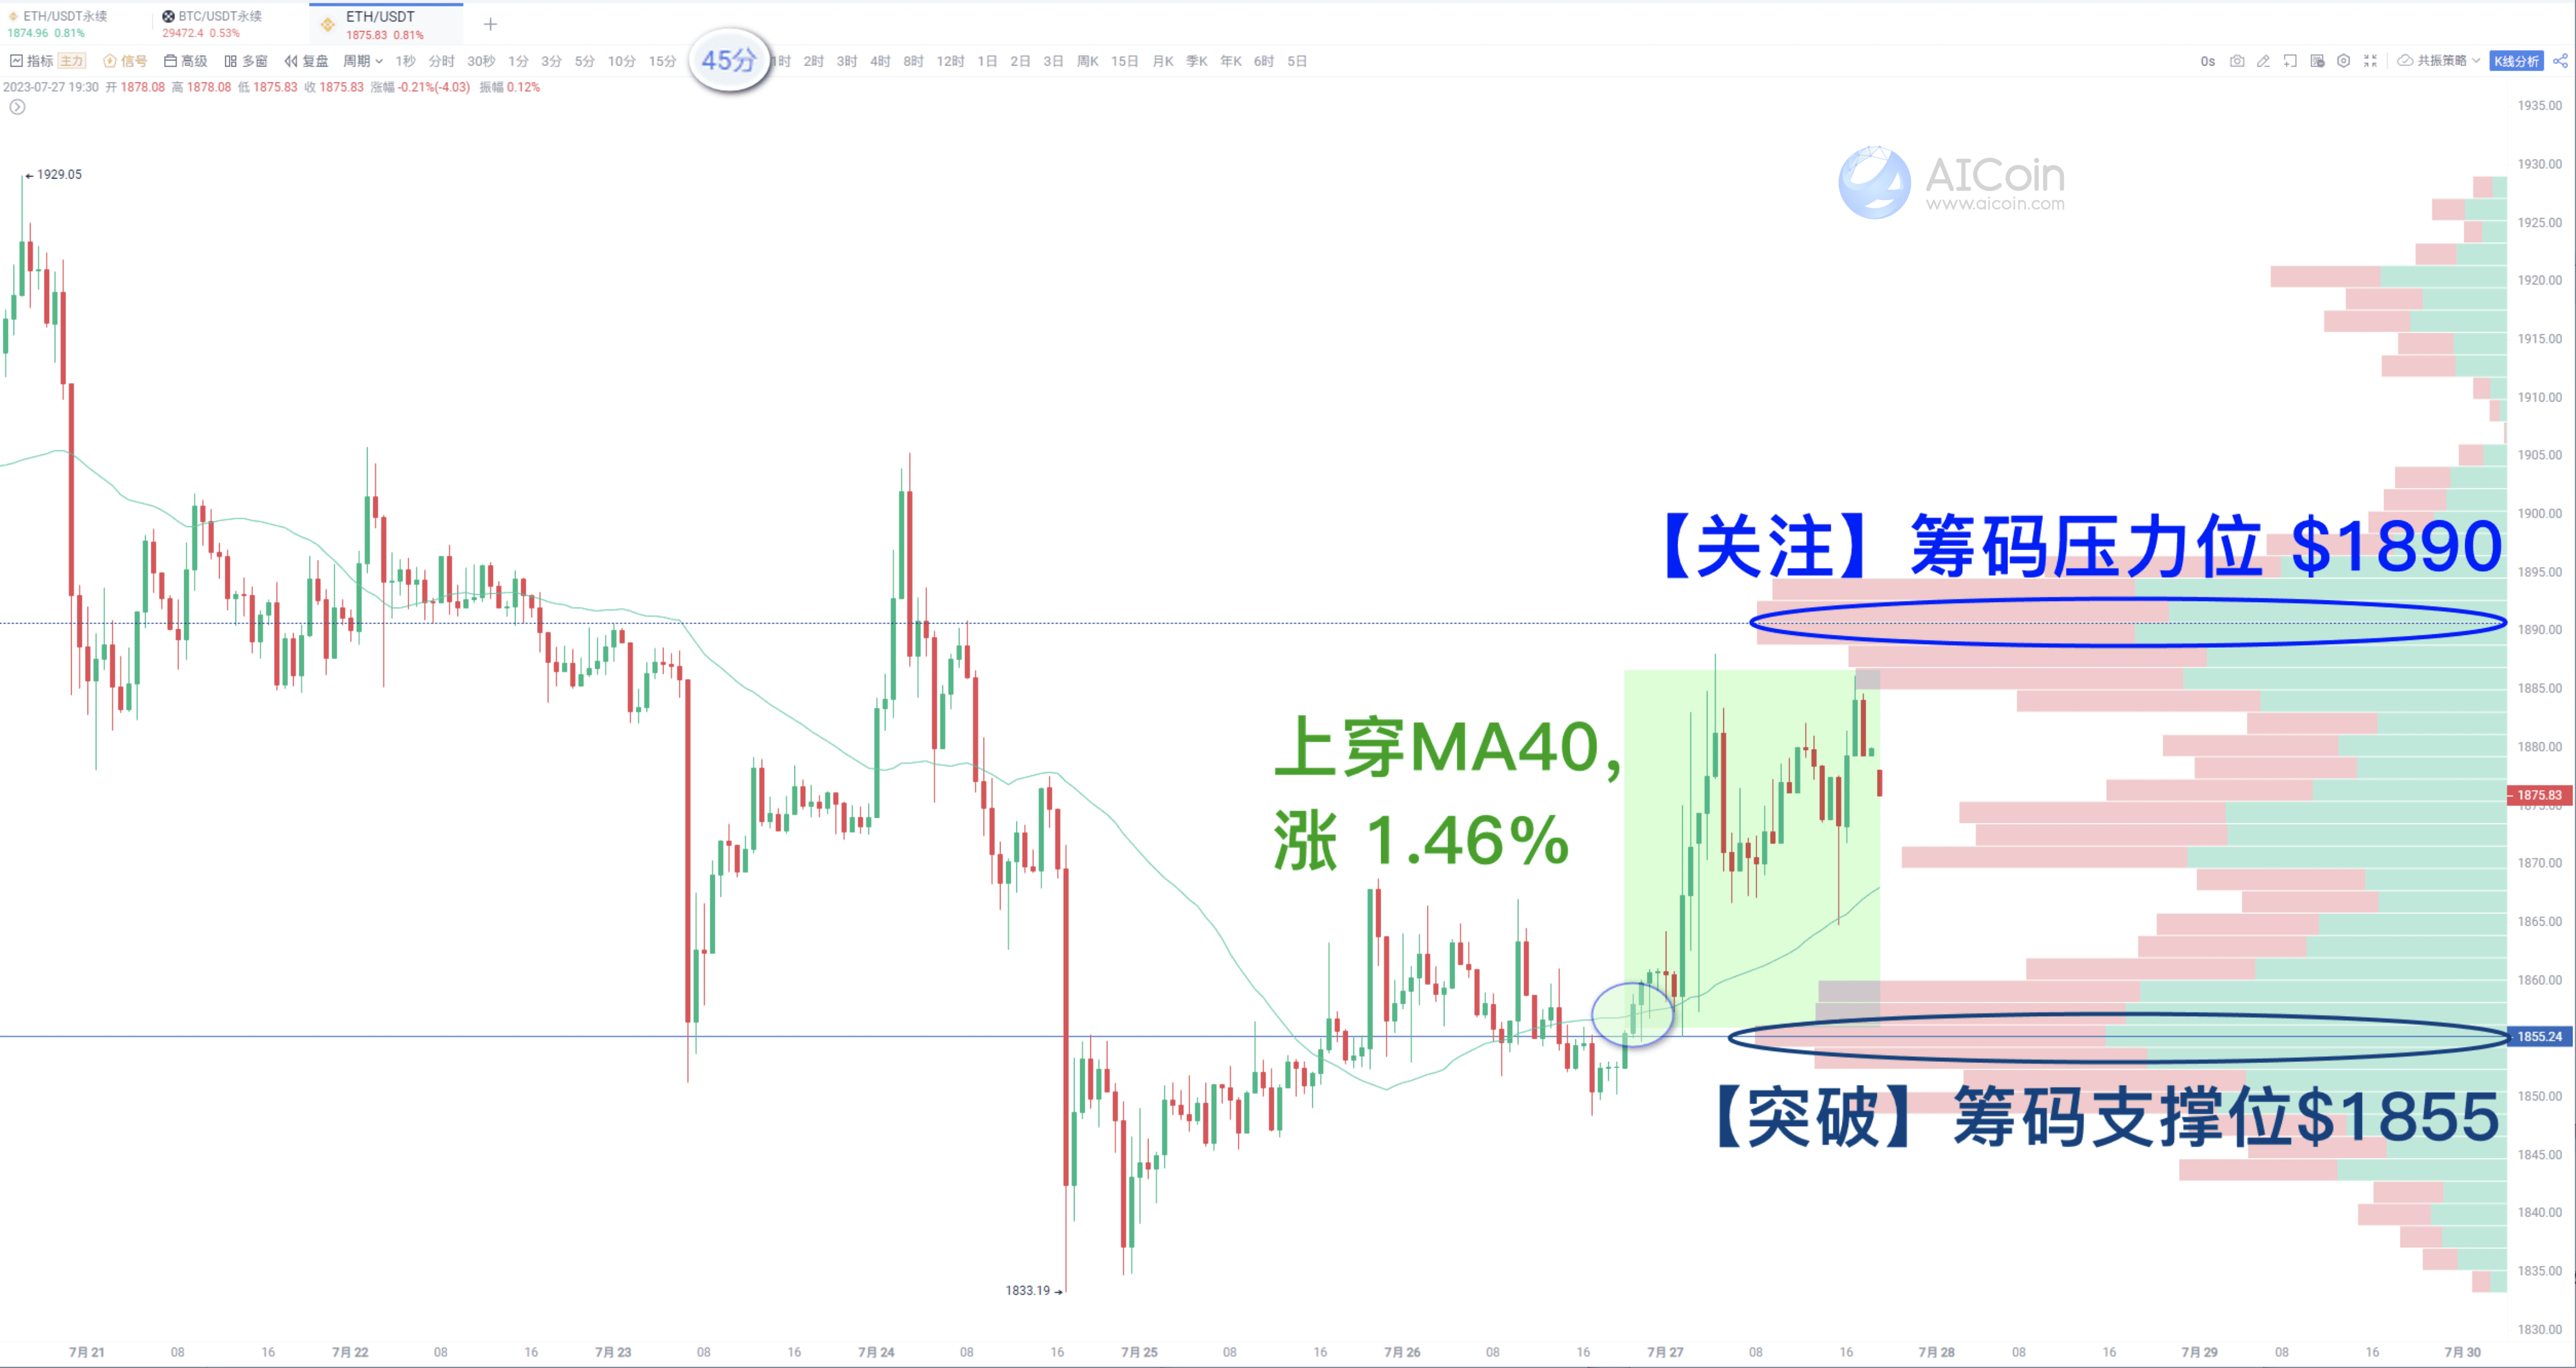
Example Analysis: BTC/USDT Perpetual
Step 1: Select the MA40 indicator.

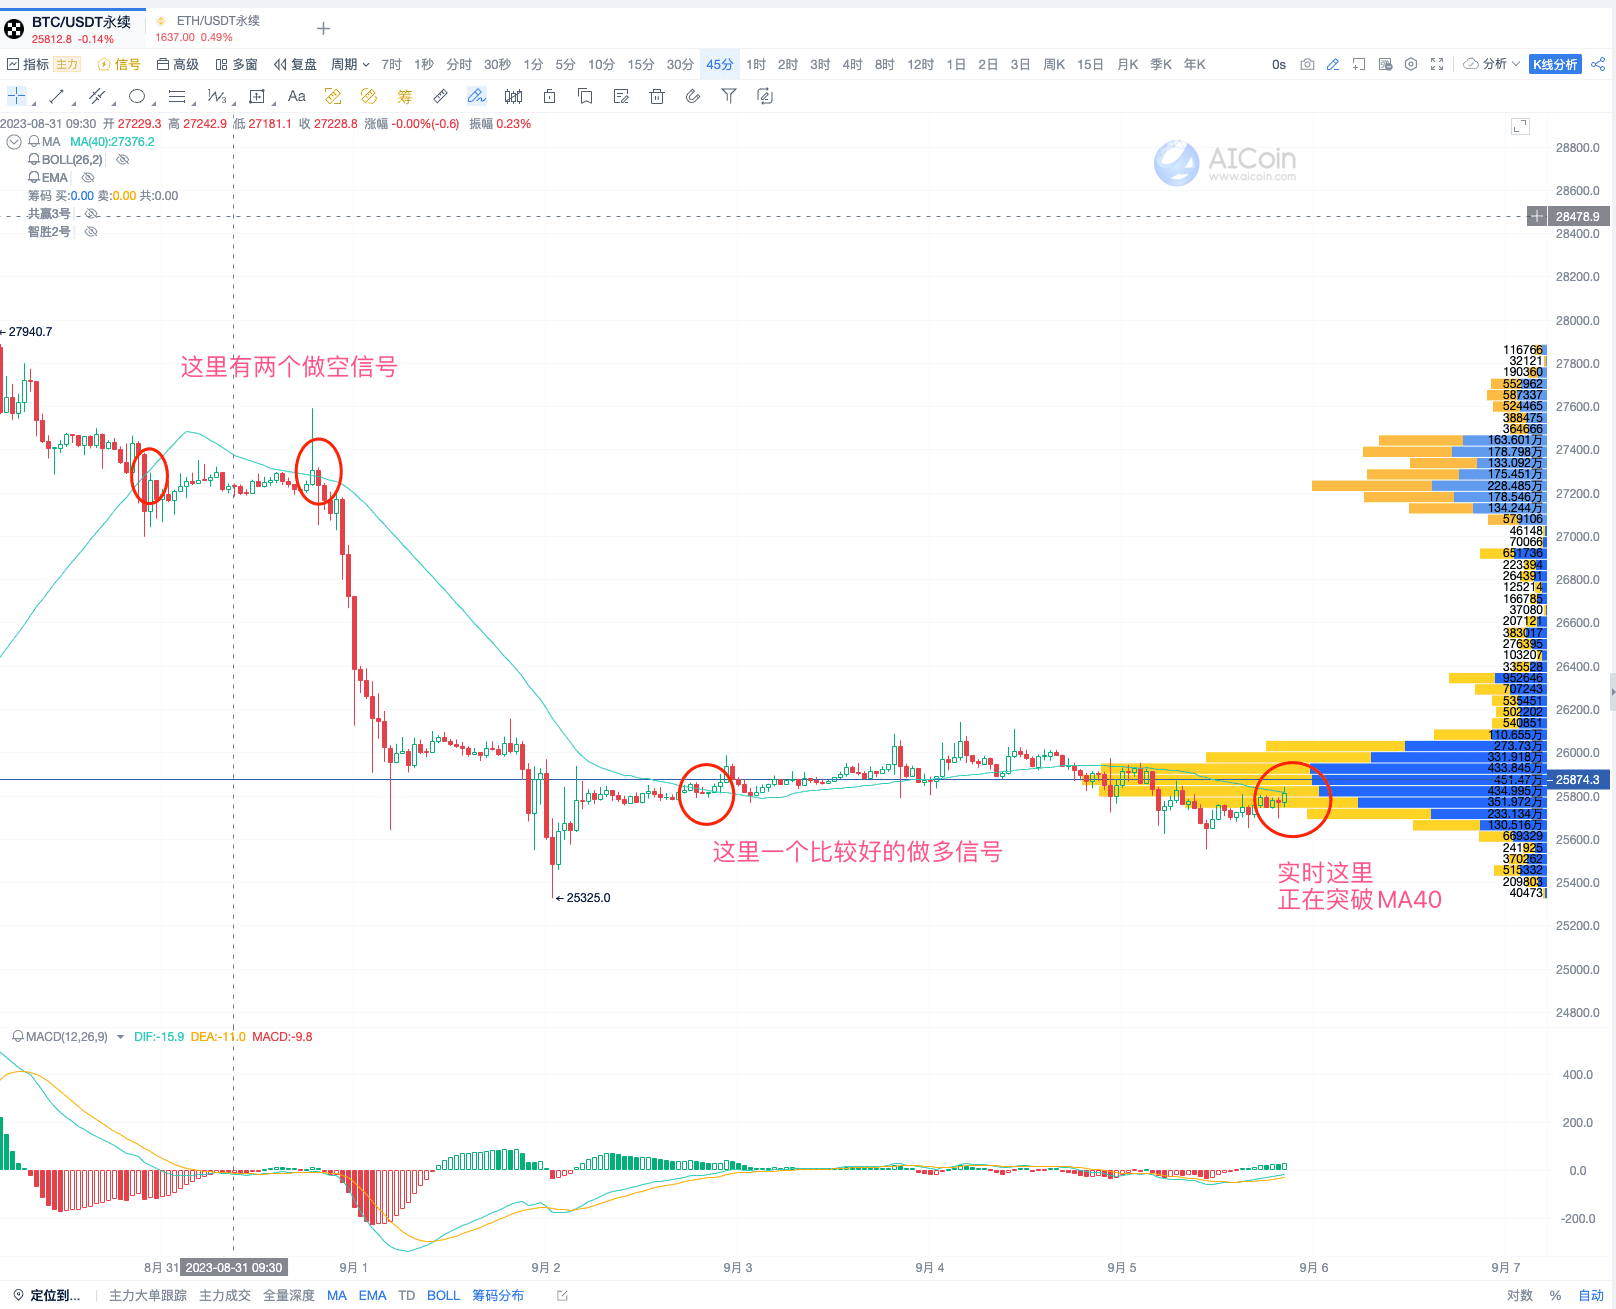
During the live broadcast, BTC was breaking through MA40, waiting to see if the 45-minute breakthrough effect can stabilize the MA40 line. If it does, there is significant chip support here.
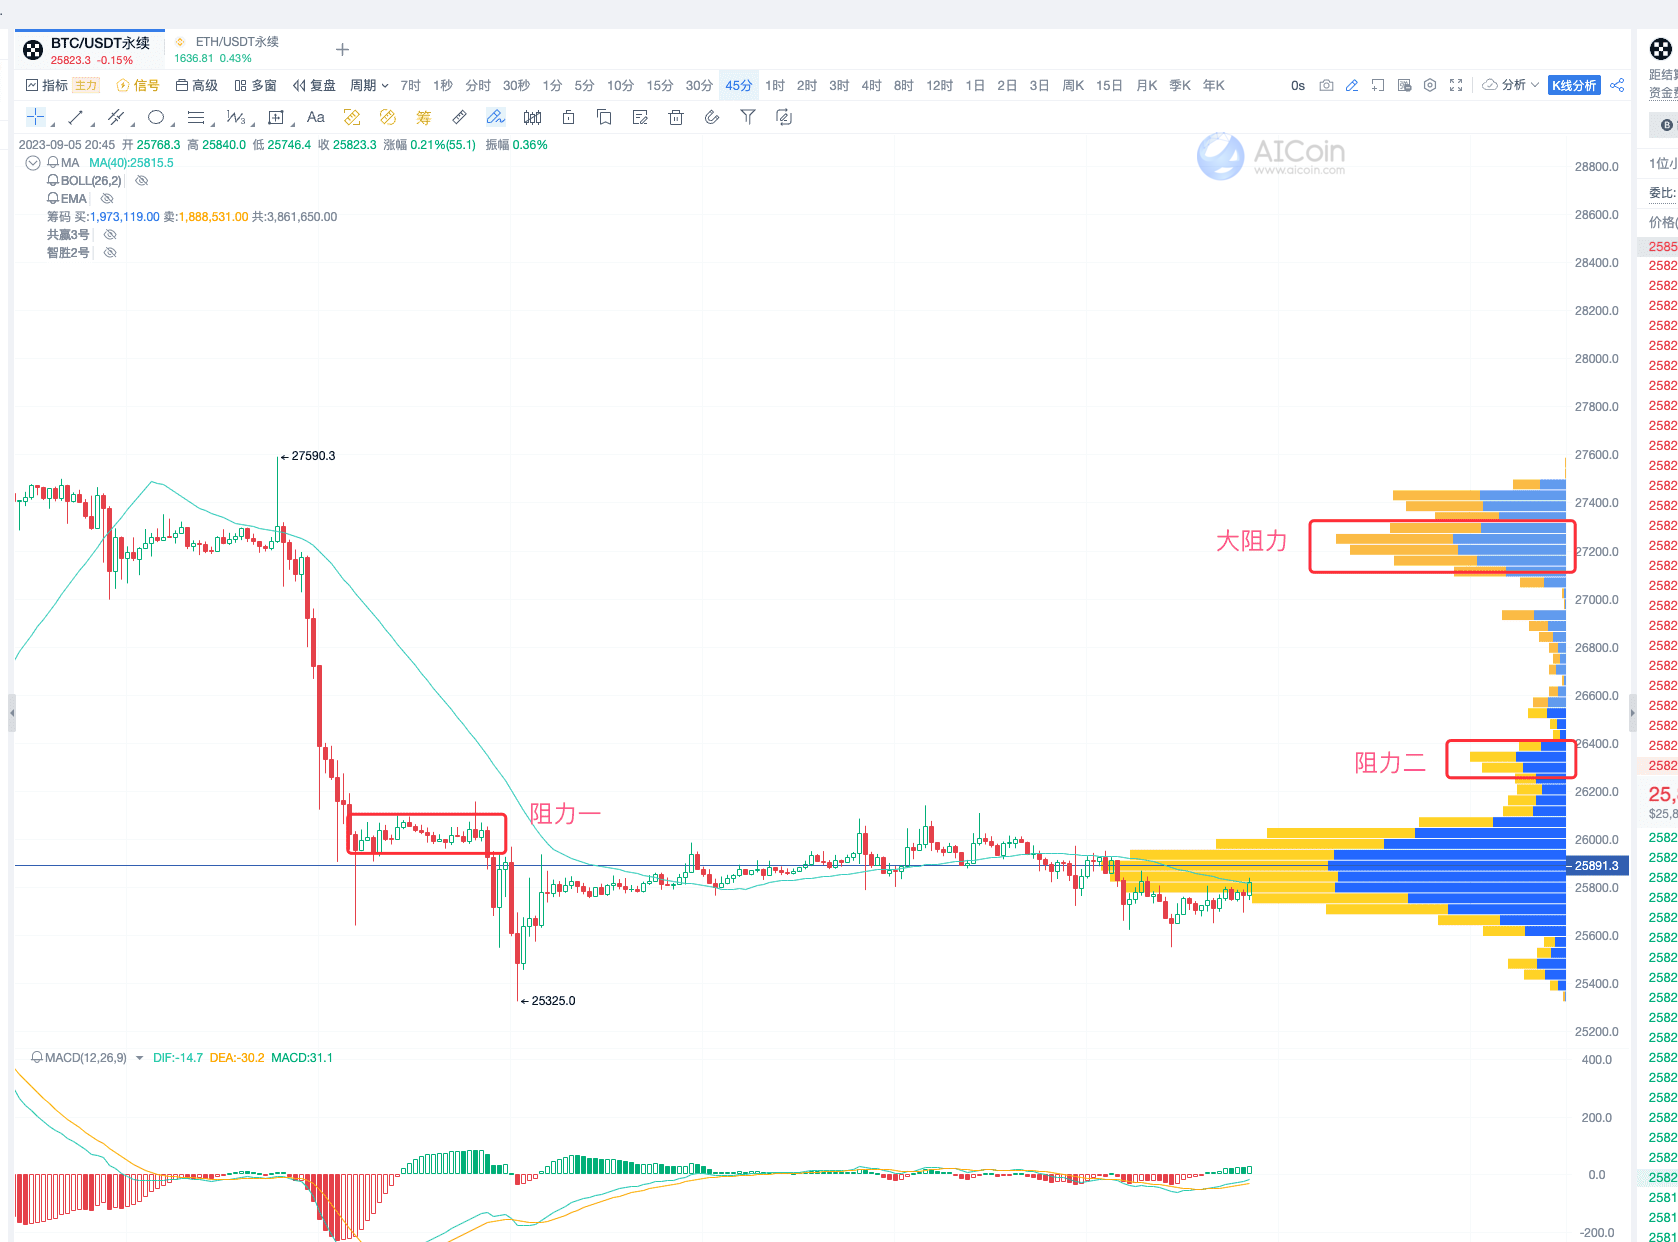
Three, Chip Distribution
In chip distribution, it is most important to pay attention to where the chip peaks are and where the vacuum zones are. For chip peaks, pay attention to areas with dense chip concentration, such as peaks one and two in the figure below.
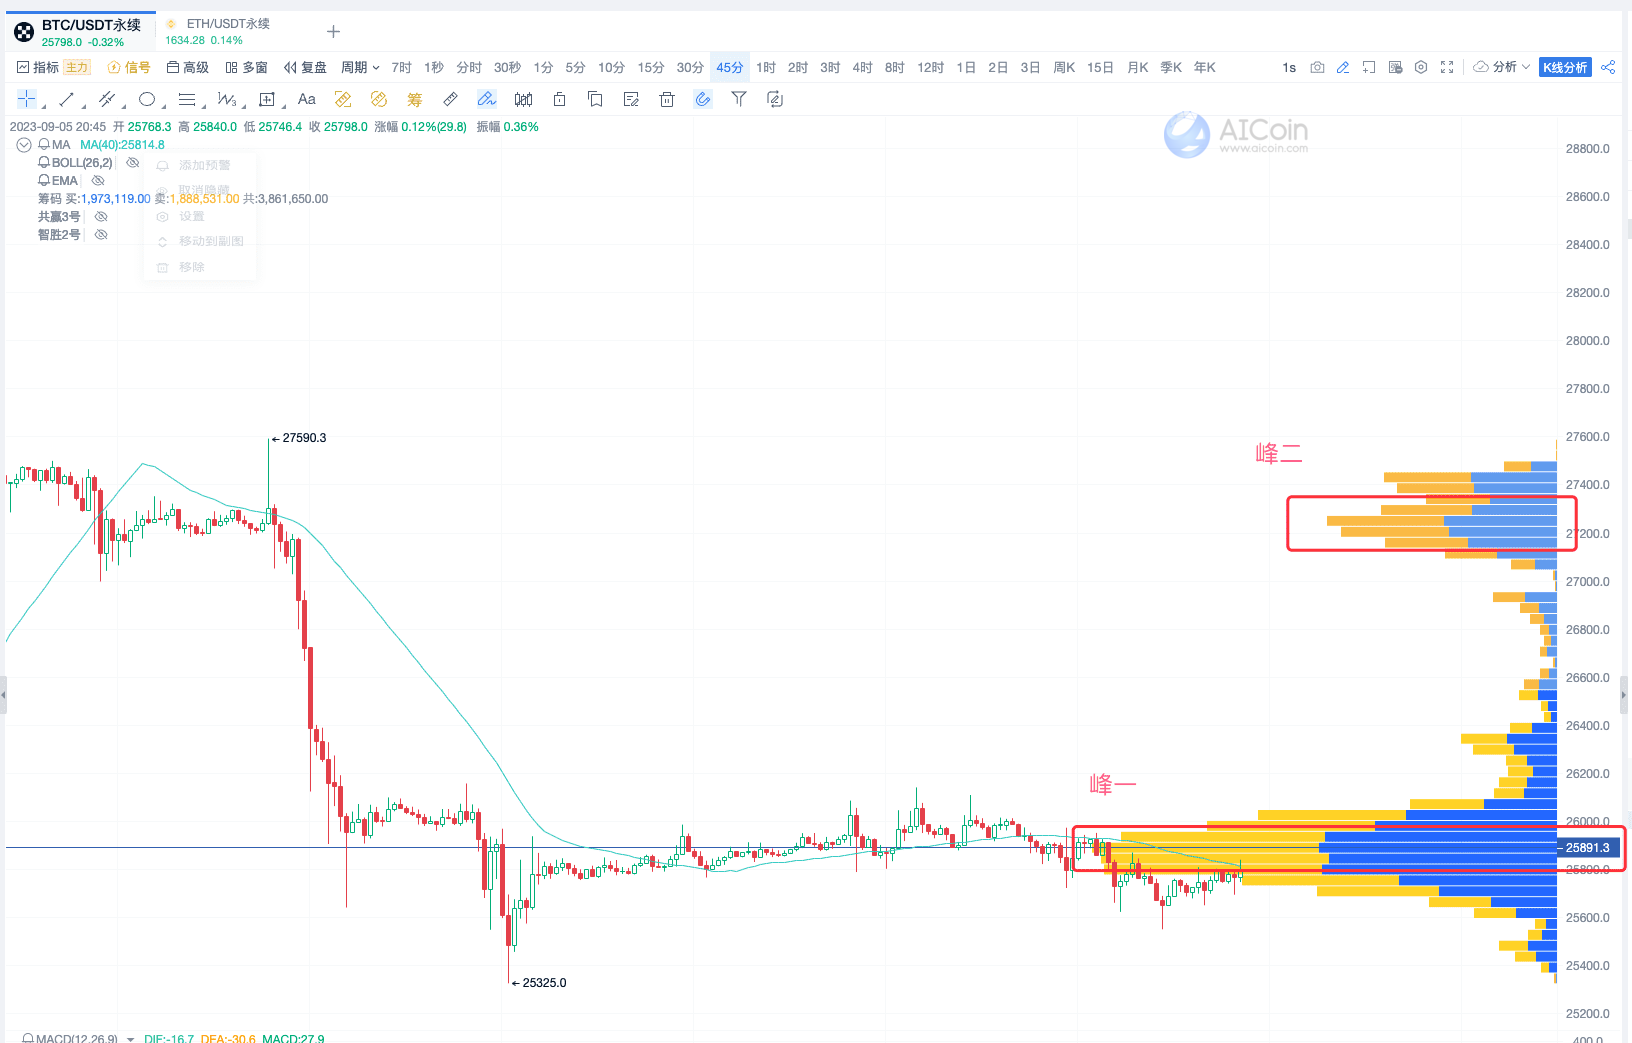
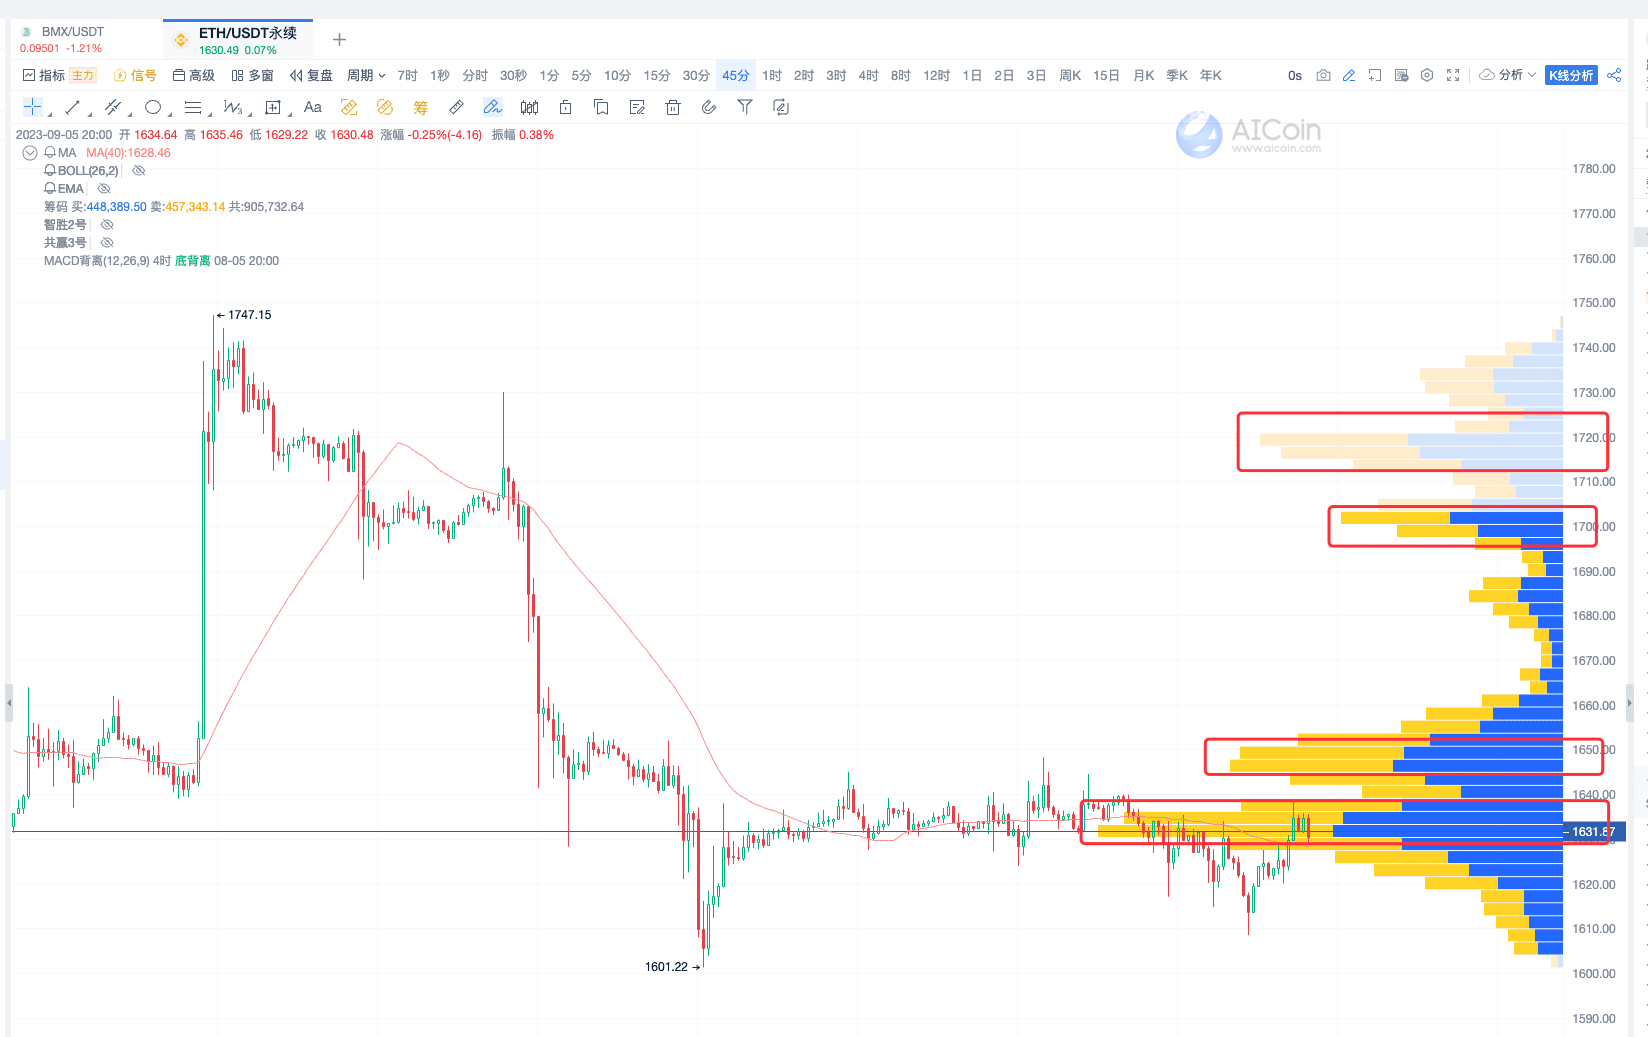
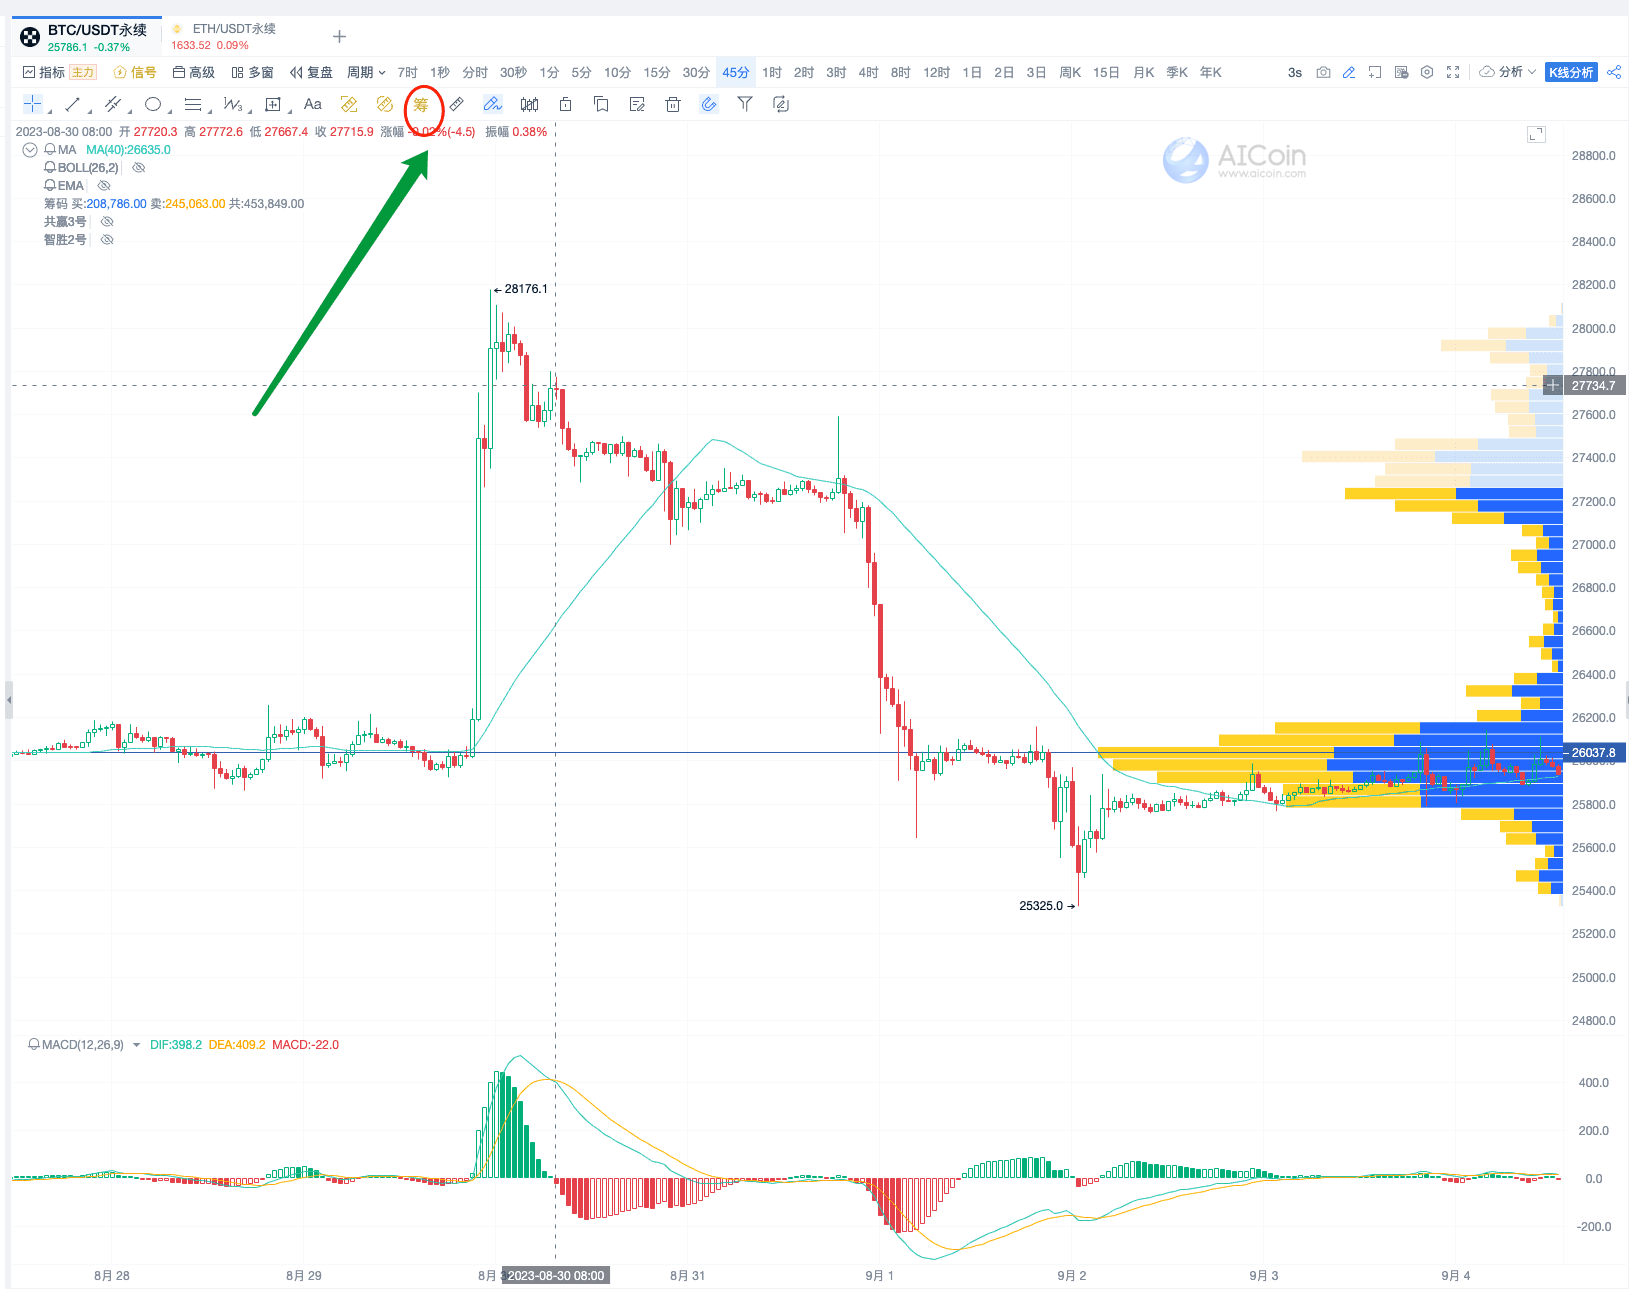
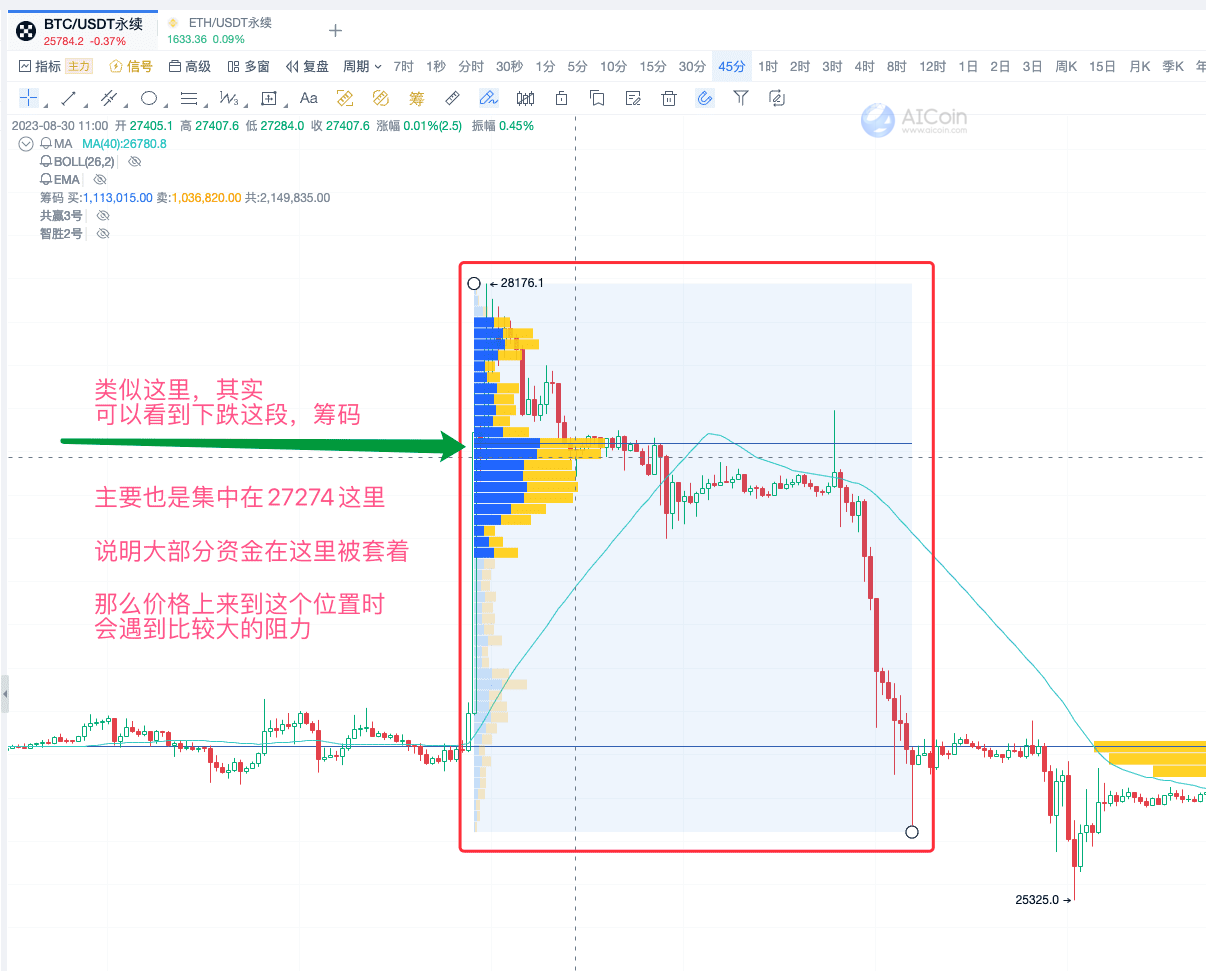
Using the latest version of chip statistics, it can be seen that there is a concentration of chips below the price top and a scarcity of chips, forming a "valley" state, which easily exerts downward pressure.
Get the same strategy: https://aicoin.app/vip/chartpro
Recommended Reading
- “Unveiling the High-Yield Trading Signals”
- “Teaching You to Find Suitable Targets for Grid Trading, No Longer Easily Broken”
- “Unveiling the Market Makers from the Perspective of Chip View”
For more live content, please follow AICoin's "News/Information-Live Review" section, and feel free to download AICoin PC End.
免责声明:本文章仅代表作者个人观点,不代表本平台的立场和观点。本文章仅供信息分享,不构成对任何人的任何投资建议。用户与作者之间的任何争议,与本平台无关。如网页中刊载的文章或图片涉及侵权,请提供相关的权利证明和身份证明发送邮件到support@aicoin.com,本平台相关工作人员将会进行核查。


