The market does not make mistakes, but people's ideas often do. We may win a bet on a game, but it's impossible to win every game.
When making a profit, it indicates that the direction is correct, and the profit should be allowed to run. When facing floating losses, it means the direction is wrong, and one should exit in time. However, people often confuse the two. Profits will take care of themselves, while losses are the opposite.
If the fluctuation of your position keeps you awake at night, believe me, your position is too heavy. No one comes to the market to lose money, but no one has not lost money. Many people like to be friends with the wealthy, but few ask them how they make a profit. They just want to find a job or borrow some money. Isn't trading the same?
If you find yourself in the abyss, don't dig deeper, especially those who borrow money to trade. Losses are not because of the amount, but because the method is wrong. Even with more money, it's still a waste. If you can't swim, changing the pool won't help.
Market Review:
The non-farm payroll report helped to pause the expectation of interest rate hikes. After the report, the two-year and ten-year Treasury yields both hit a three-week low, the US dollar index hit a daily low, and US stocks opened higher. However, later, Federal Reserve officials poured cold water on the situation, and the US Treasury yield rose by more than 10 basis points at one point. The US dollar index turned higher and approached a two-month high, and US stocks gave back their gains, with all three major indices turning lower at one point.
In the end, the S&P Nasdaq still rose for two consecutive weeks, with the S&P posting its largest weekly gain in over two months, and the Nasdaq and Dow posting their largest weekly gains in seven weeks. The energy and technology sectors led the gains for the entire week. Tesla fell by over 5%. Chip stocks rose for six consecutive weeks, but Nvidia fell by 1.7% from its historical high, and Broadcom fell by over 5% after its earnings report.
Crude oil hit a nine-month high, with US oil rising for seven consecutive days, posting its largest weekly gain in five months, at over 7%. Gold briefly turned lower but ended the week with gains for two consecutive weeks. London nickel rose by nearly 4%, reversing a five-week decline, and London copper rebounded to a four-week high. Bitcoin continued to fluctuate this week and failed to strengthen directly!
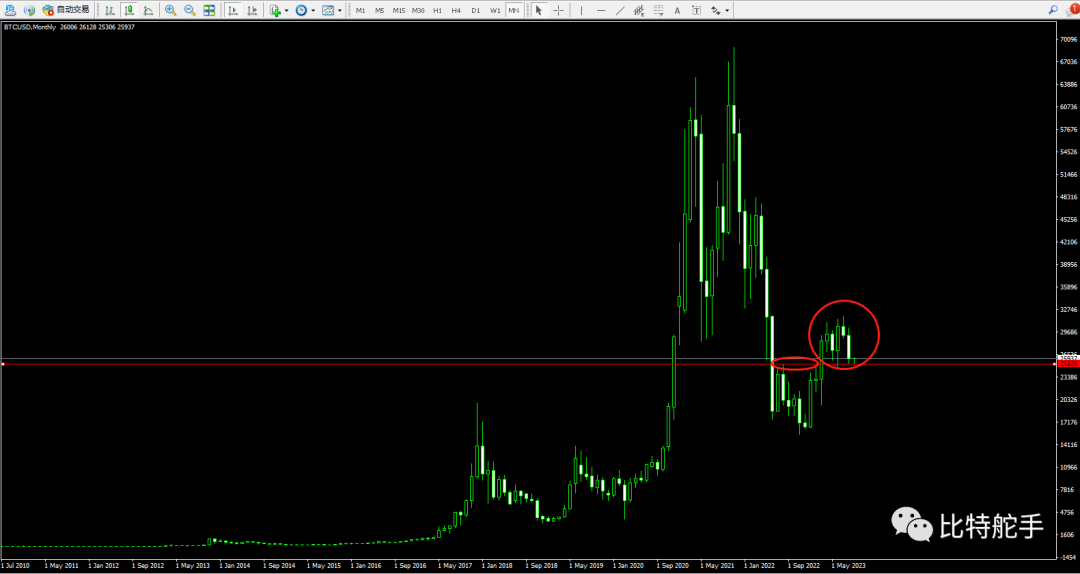
As shown in the above chart, the monthly chart of Bitcoin. At the end of last week, although the price briefly rose to 28,000 during the month, the closing price at the end of the month failed to maintain a strong close. At the end of the month, the price once again returned to around 26,000. From the closing price perspective, the price is still above the lower shadow of the monthly line for nearly half a year. Overall, it is still a sideways pattern after a rebound on the monthly chart! The second circle in the chart above shows the high and low sideways movement.
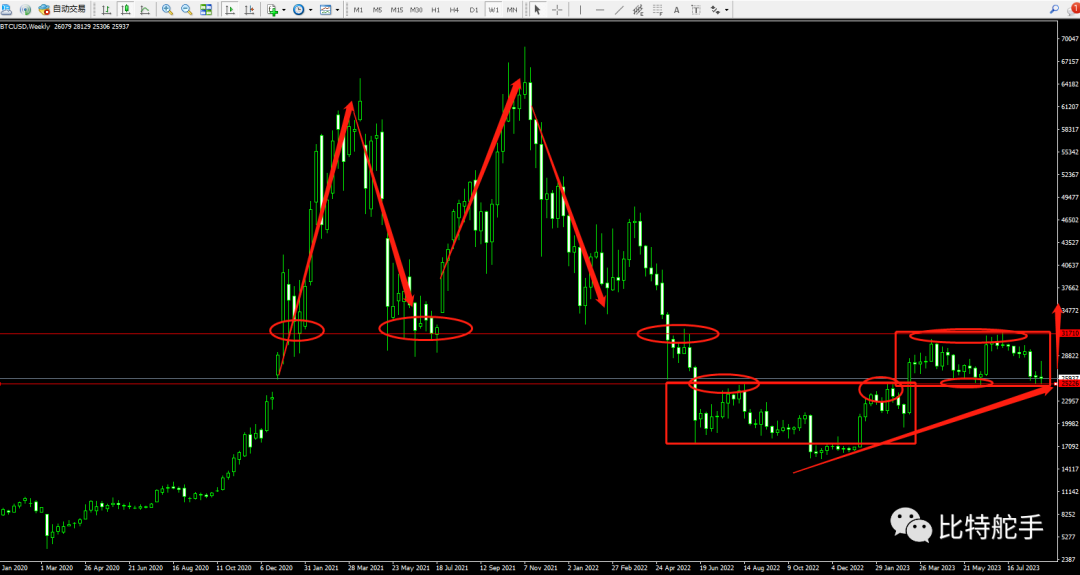
As shown in the above chart, the weekly chart of Bitcoin. We can observe the overall trend, with the previous high of 31,700 reaching the resistance at the intersection of the previous M-top, and then falling back, repeatedly testing the support and resistance conversion position of 25,000. Currently, the price is still in a state of agitation within the sideways oscillation range. Will it directly break through to go lower or can it strengthen again?
The train of thought is still clear and straightforward, as the chart speaks for itself! Yes, at present, the rebound trend of the large trend starting from 17,000 has not been broken. The price has once again returned to a very tempting sideways bottom area.
The recent washout has been quite severe, and the back and forth sweeping has caused heavy losses for many speculative traders who cannot bear the loneliness and cannot control themselves. Of course, for spot speculators, this has no impact.
Market Outlook:
For spot speculators, the strategy of buying at any price below 28,000 remains unchanged, even if the current price is around 25,800. The trend is still intact. The price is still running within a strong trend. It's just that the current washout has not yet ended. Those who are holding and waiting can continue to enter the market to buy spot and wait for the future bullish momentum!
For contract speculators, the 25,300-25,100 range is the nearest support level. In the short term, the levels above are 26,300, 26,900, and 27,400. The 27,400 range is the midline of the trend price, and I believe the price will soon return to this range. Pay strict attention to setting stop-loss orders during trading and manage the position size reasonably!
September will be an amazing month, full of anticipation and surprises. Please be patient and buy when no one is paying attention, so that you can sell when everyone is clamoring! Although the volatility is slow, every time there is a fluctuation, it takes a long time to rest. There has never been a straight upward movement every time, so having more patience means that the higher and farther the market will rise after a more thorough washout!
If there are any changes in the intraday price, the helmsman will provide real-time prompts during the trading session!
All analysis and judgments are probabilistic predictions. The market carries risks, and speculation should be cautious!
All analysis and judgments are probabilistic predictions. The market carries risks, and speculation should be cautious!
All analysis and judgments are probabilistic predictions. The market carries risks, and speculation should be cautious!
September 3, 2023

免责声明:本文章仅代表作者个人观点,不代表本平台的立场和观点。本文章仅供信息分享,不构成对任何人的任何投资建议。用户与作者之间的任何争议,与本平台无关。如网页中刊载的文章或图片涉及侵权,请提供相关的权利证明和身份证明发送邮件到support@aicoin.com,本平台相关工作人员将会进行核查。


