On the evening of August 29th, AICoin researchers conducted a live graphic and text sharing session on the topic of "8-Hour Period Trend Trading Strategy" in the AICoin PC End-Group Chat-Live. The following is a summary of the live content.
I. Why is the 8-hour period special
1. Interpretation from the perspective of time zone and working hours
The 8-hour period corresponds to the East 8 time zone in the Chinese circle, which is different from the 0 time zone.
2. 3 sets of 8-hour candlesticks per day
3. Why the 8-hour period is more important
Retail investors use this less, few people know about it, and large funds also tend to favor it more.
4. After research, testing, and exploration by the AICoin Research Institute, it was found that the 8-hour period can indeed bring relatively good profit effects
II. How to identify trends using the 8-hour period
First usage: 8-hour period + MA40 + Major Order Flow (Chip Distribution)
8-hour + MA40 strategy:
Elements: 8-hour period
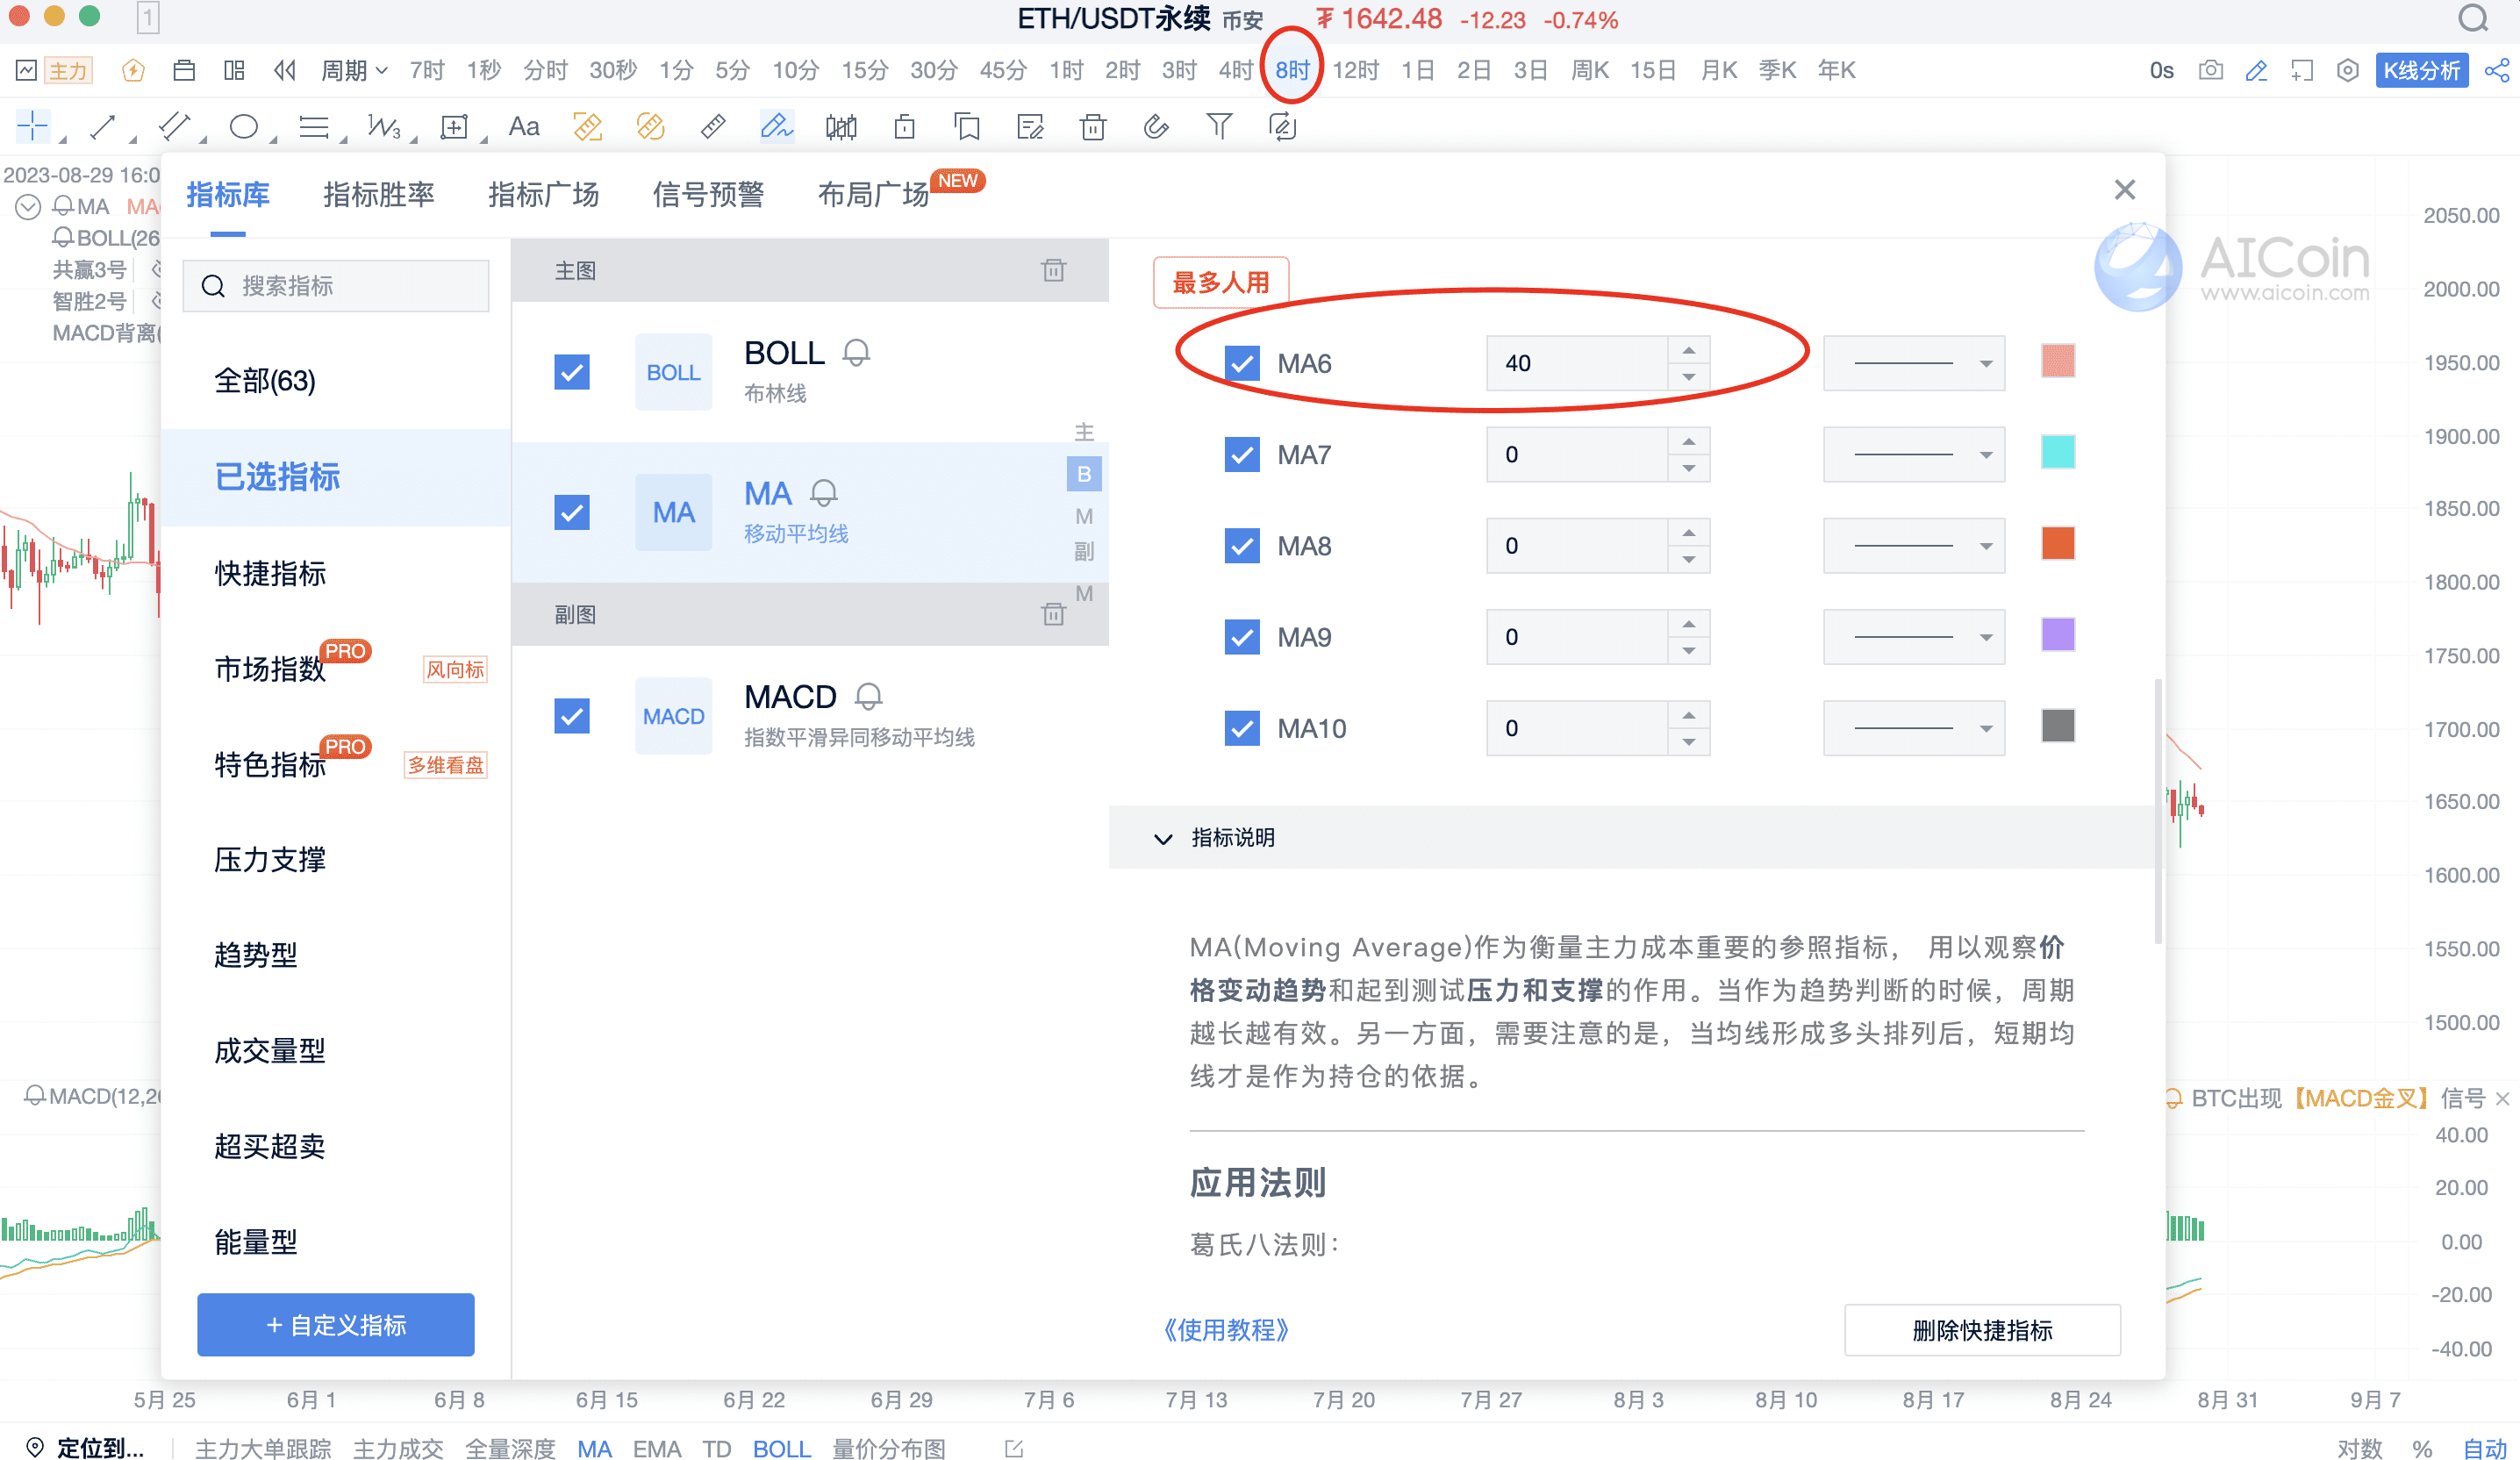
MA indicator: parameter 40
Major order flow indicator: tracking large orders in the tens of millions or large order walls
Usage:
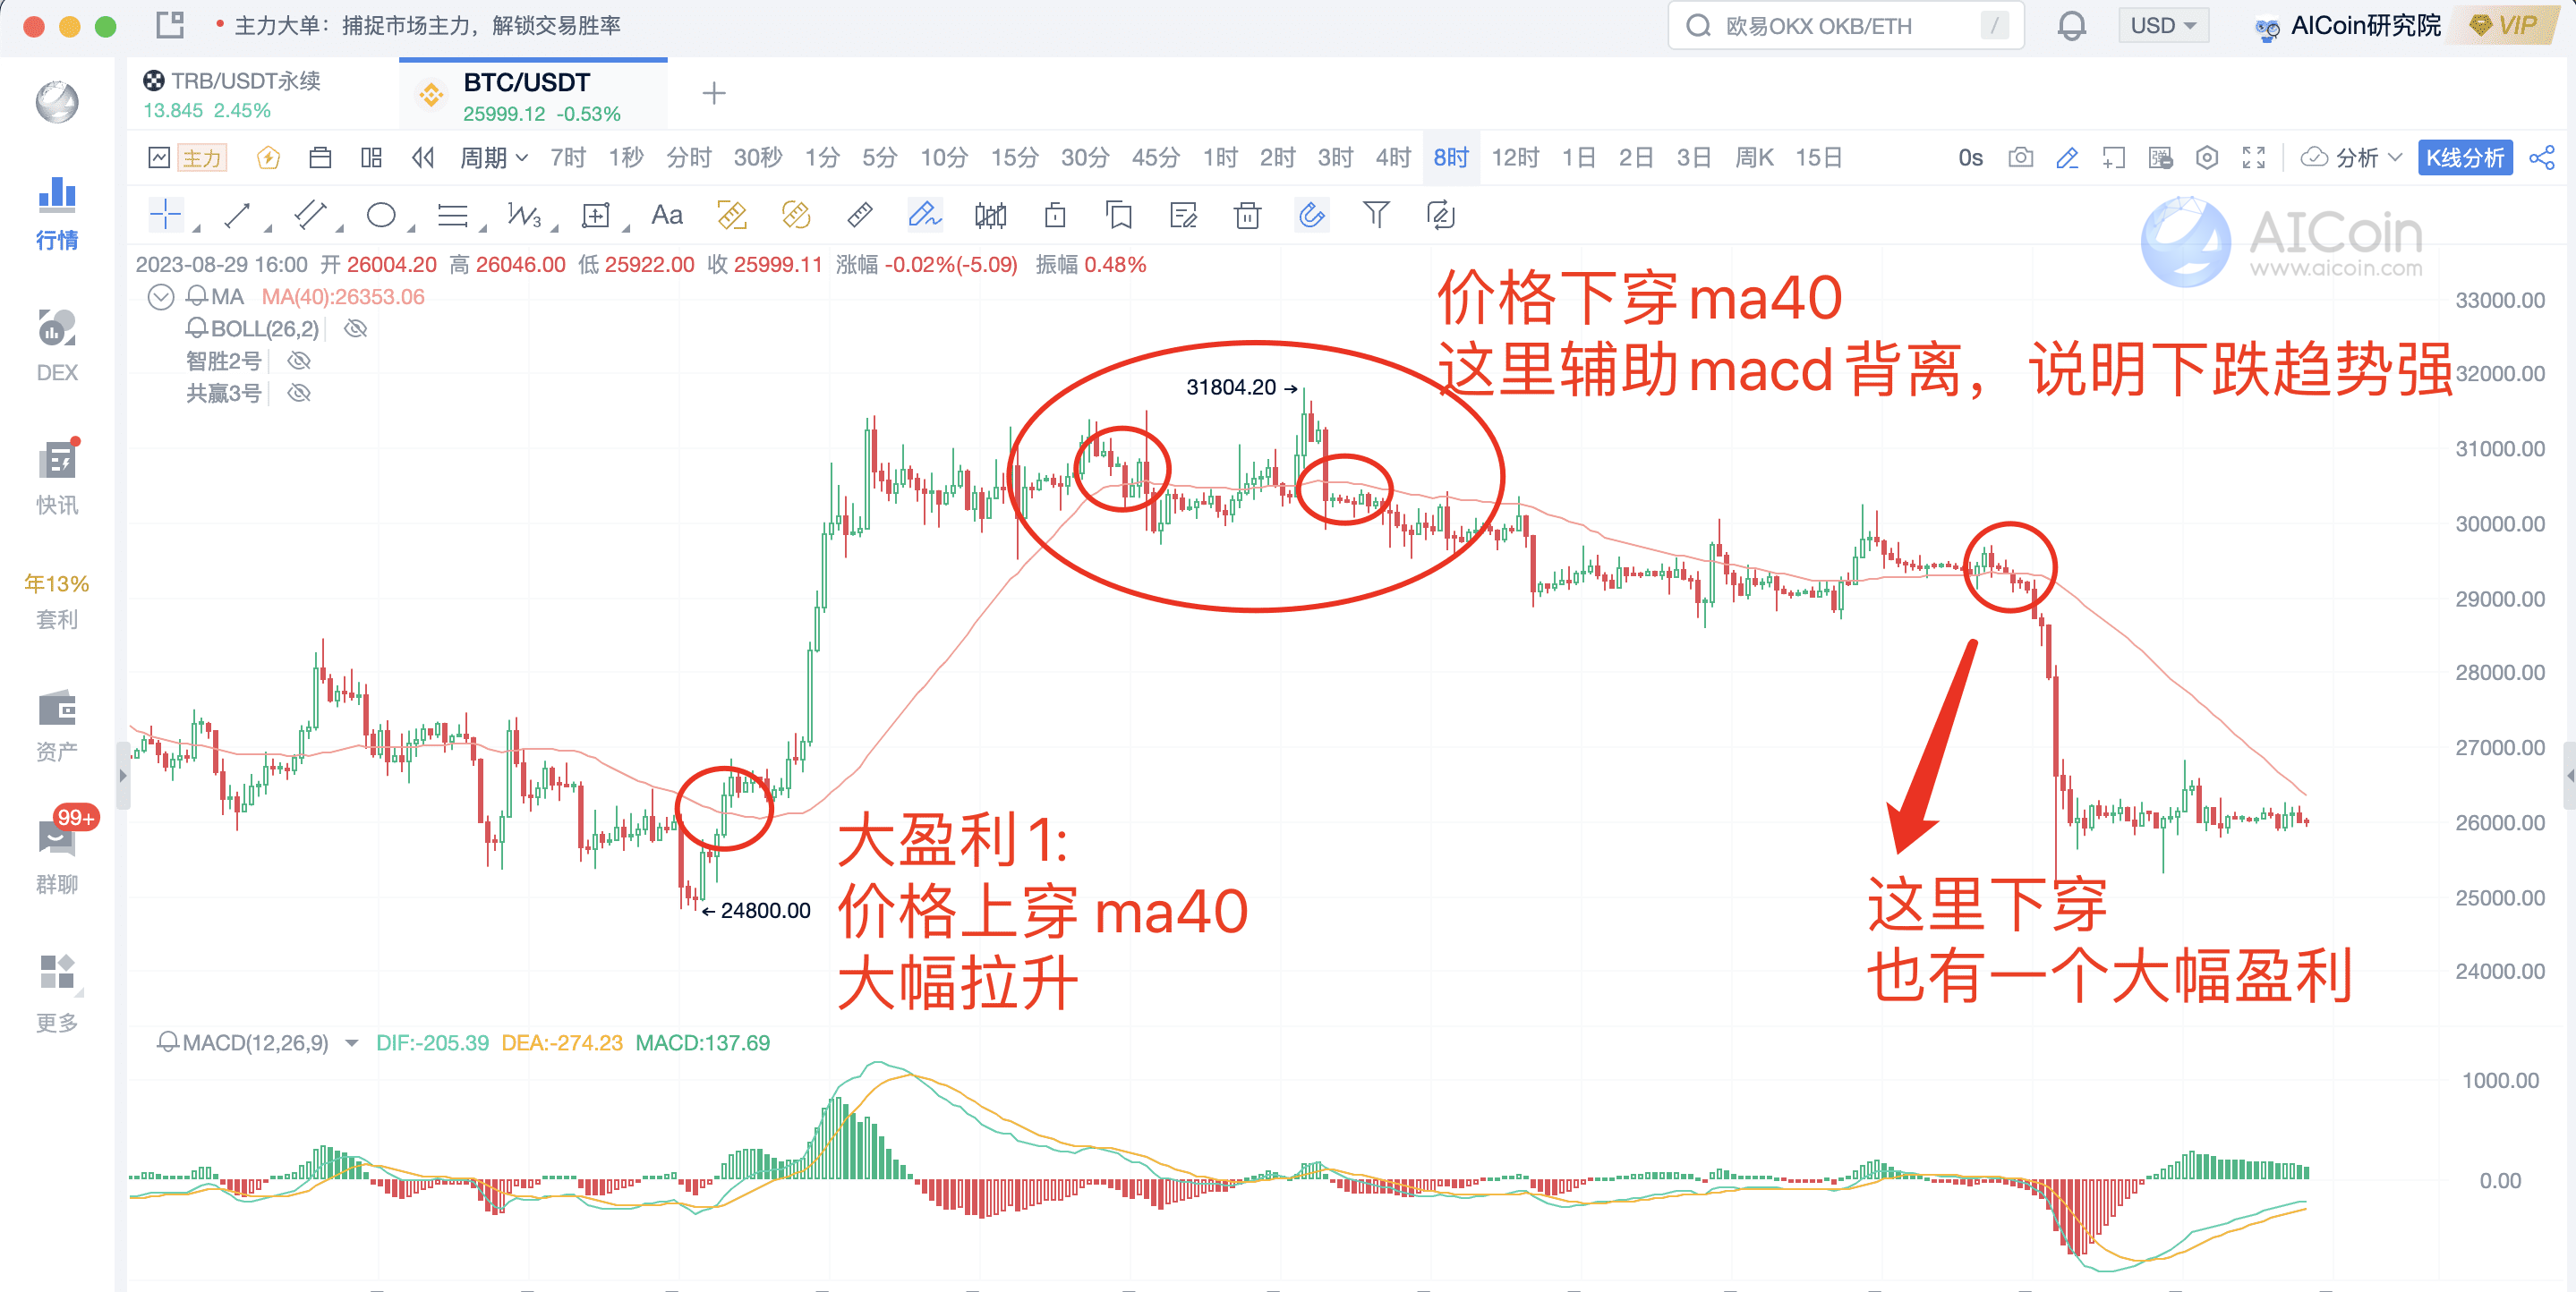
Price crossing above MA40 indicates a bullish trend; if there are large orders or chip support signals, it strongly indicates a bullish trend, and entry should be considered promptly.
Price crossing below MA40 indicates a bearish trend; if there are large orders or chip support signals, it strongly indicates a bearish trend, and exiting should be considered promptly.
Example analysis
① BTC/USDT Perpetual
Step 1: Select an 8-hour period, then select the MA indicator with a parameter of 40.
② APT/USDT
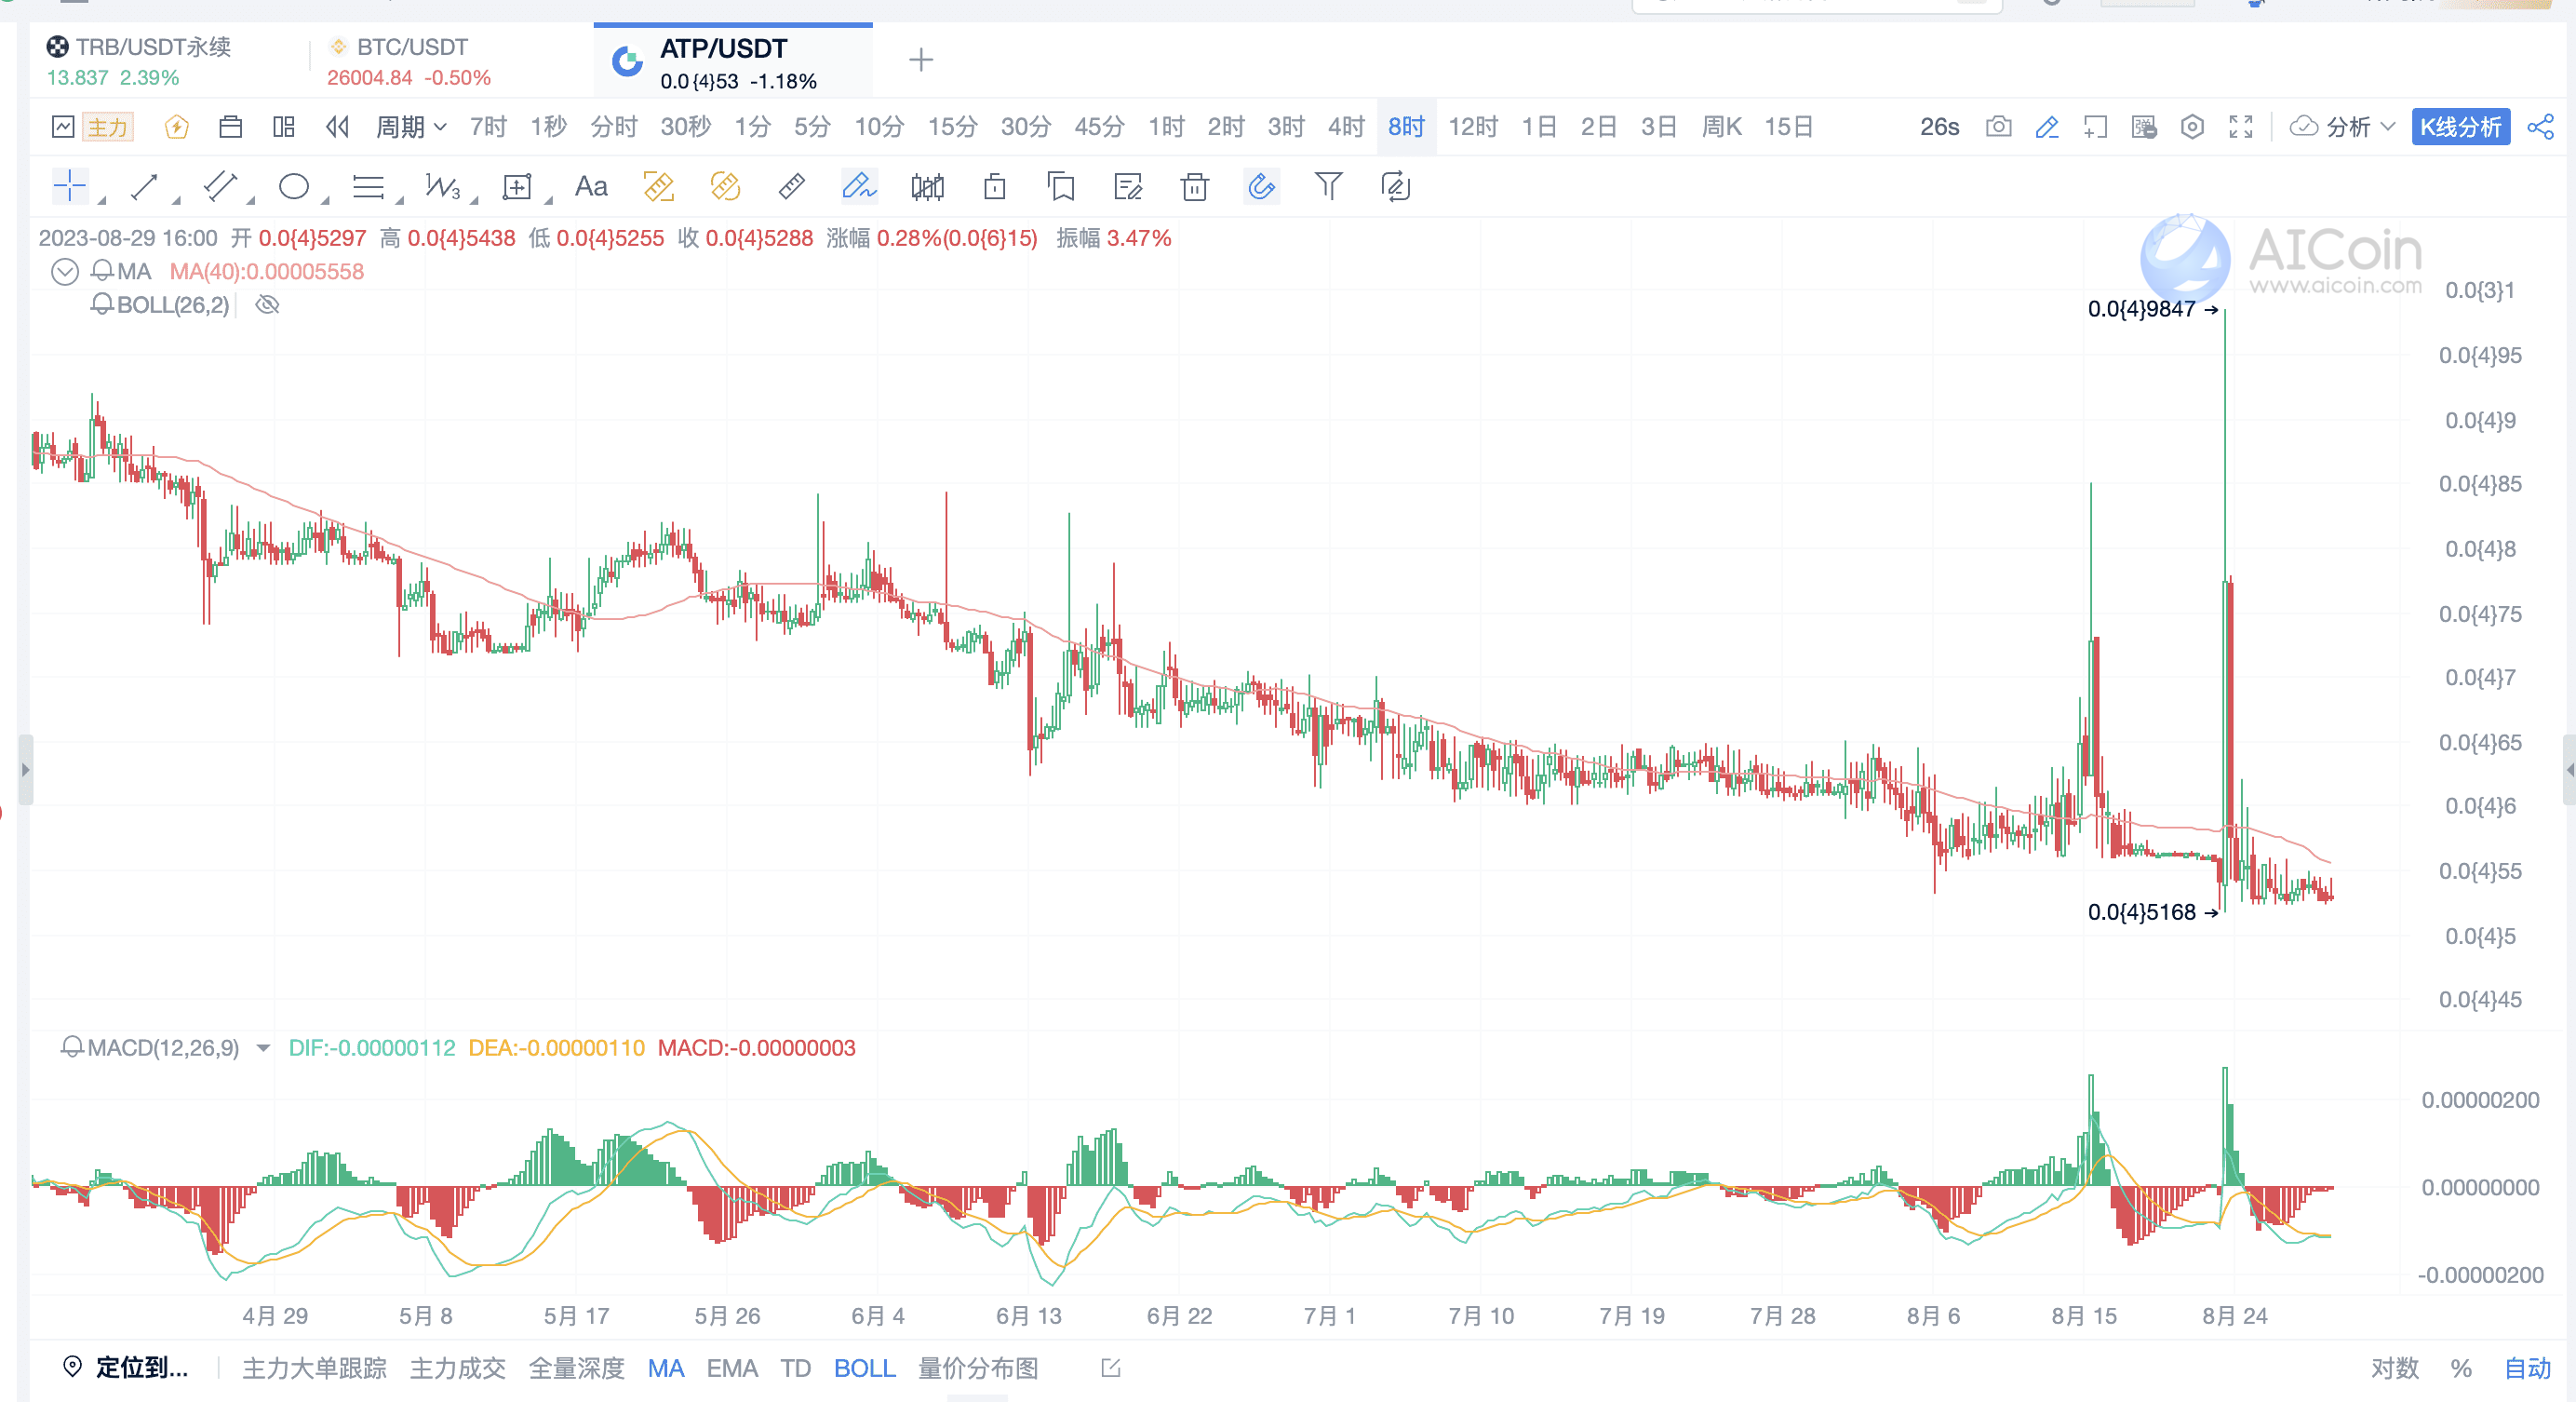
At present, APT is not suitable for major investments, as the trend has not reversed and has been suppressed by MA40 in the 8-hour period.
③ ETH/USDT Perpetual
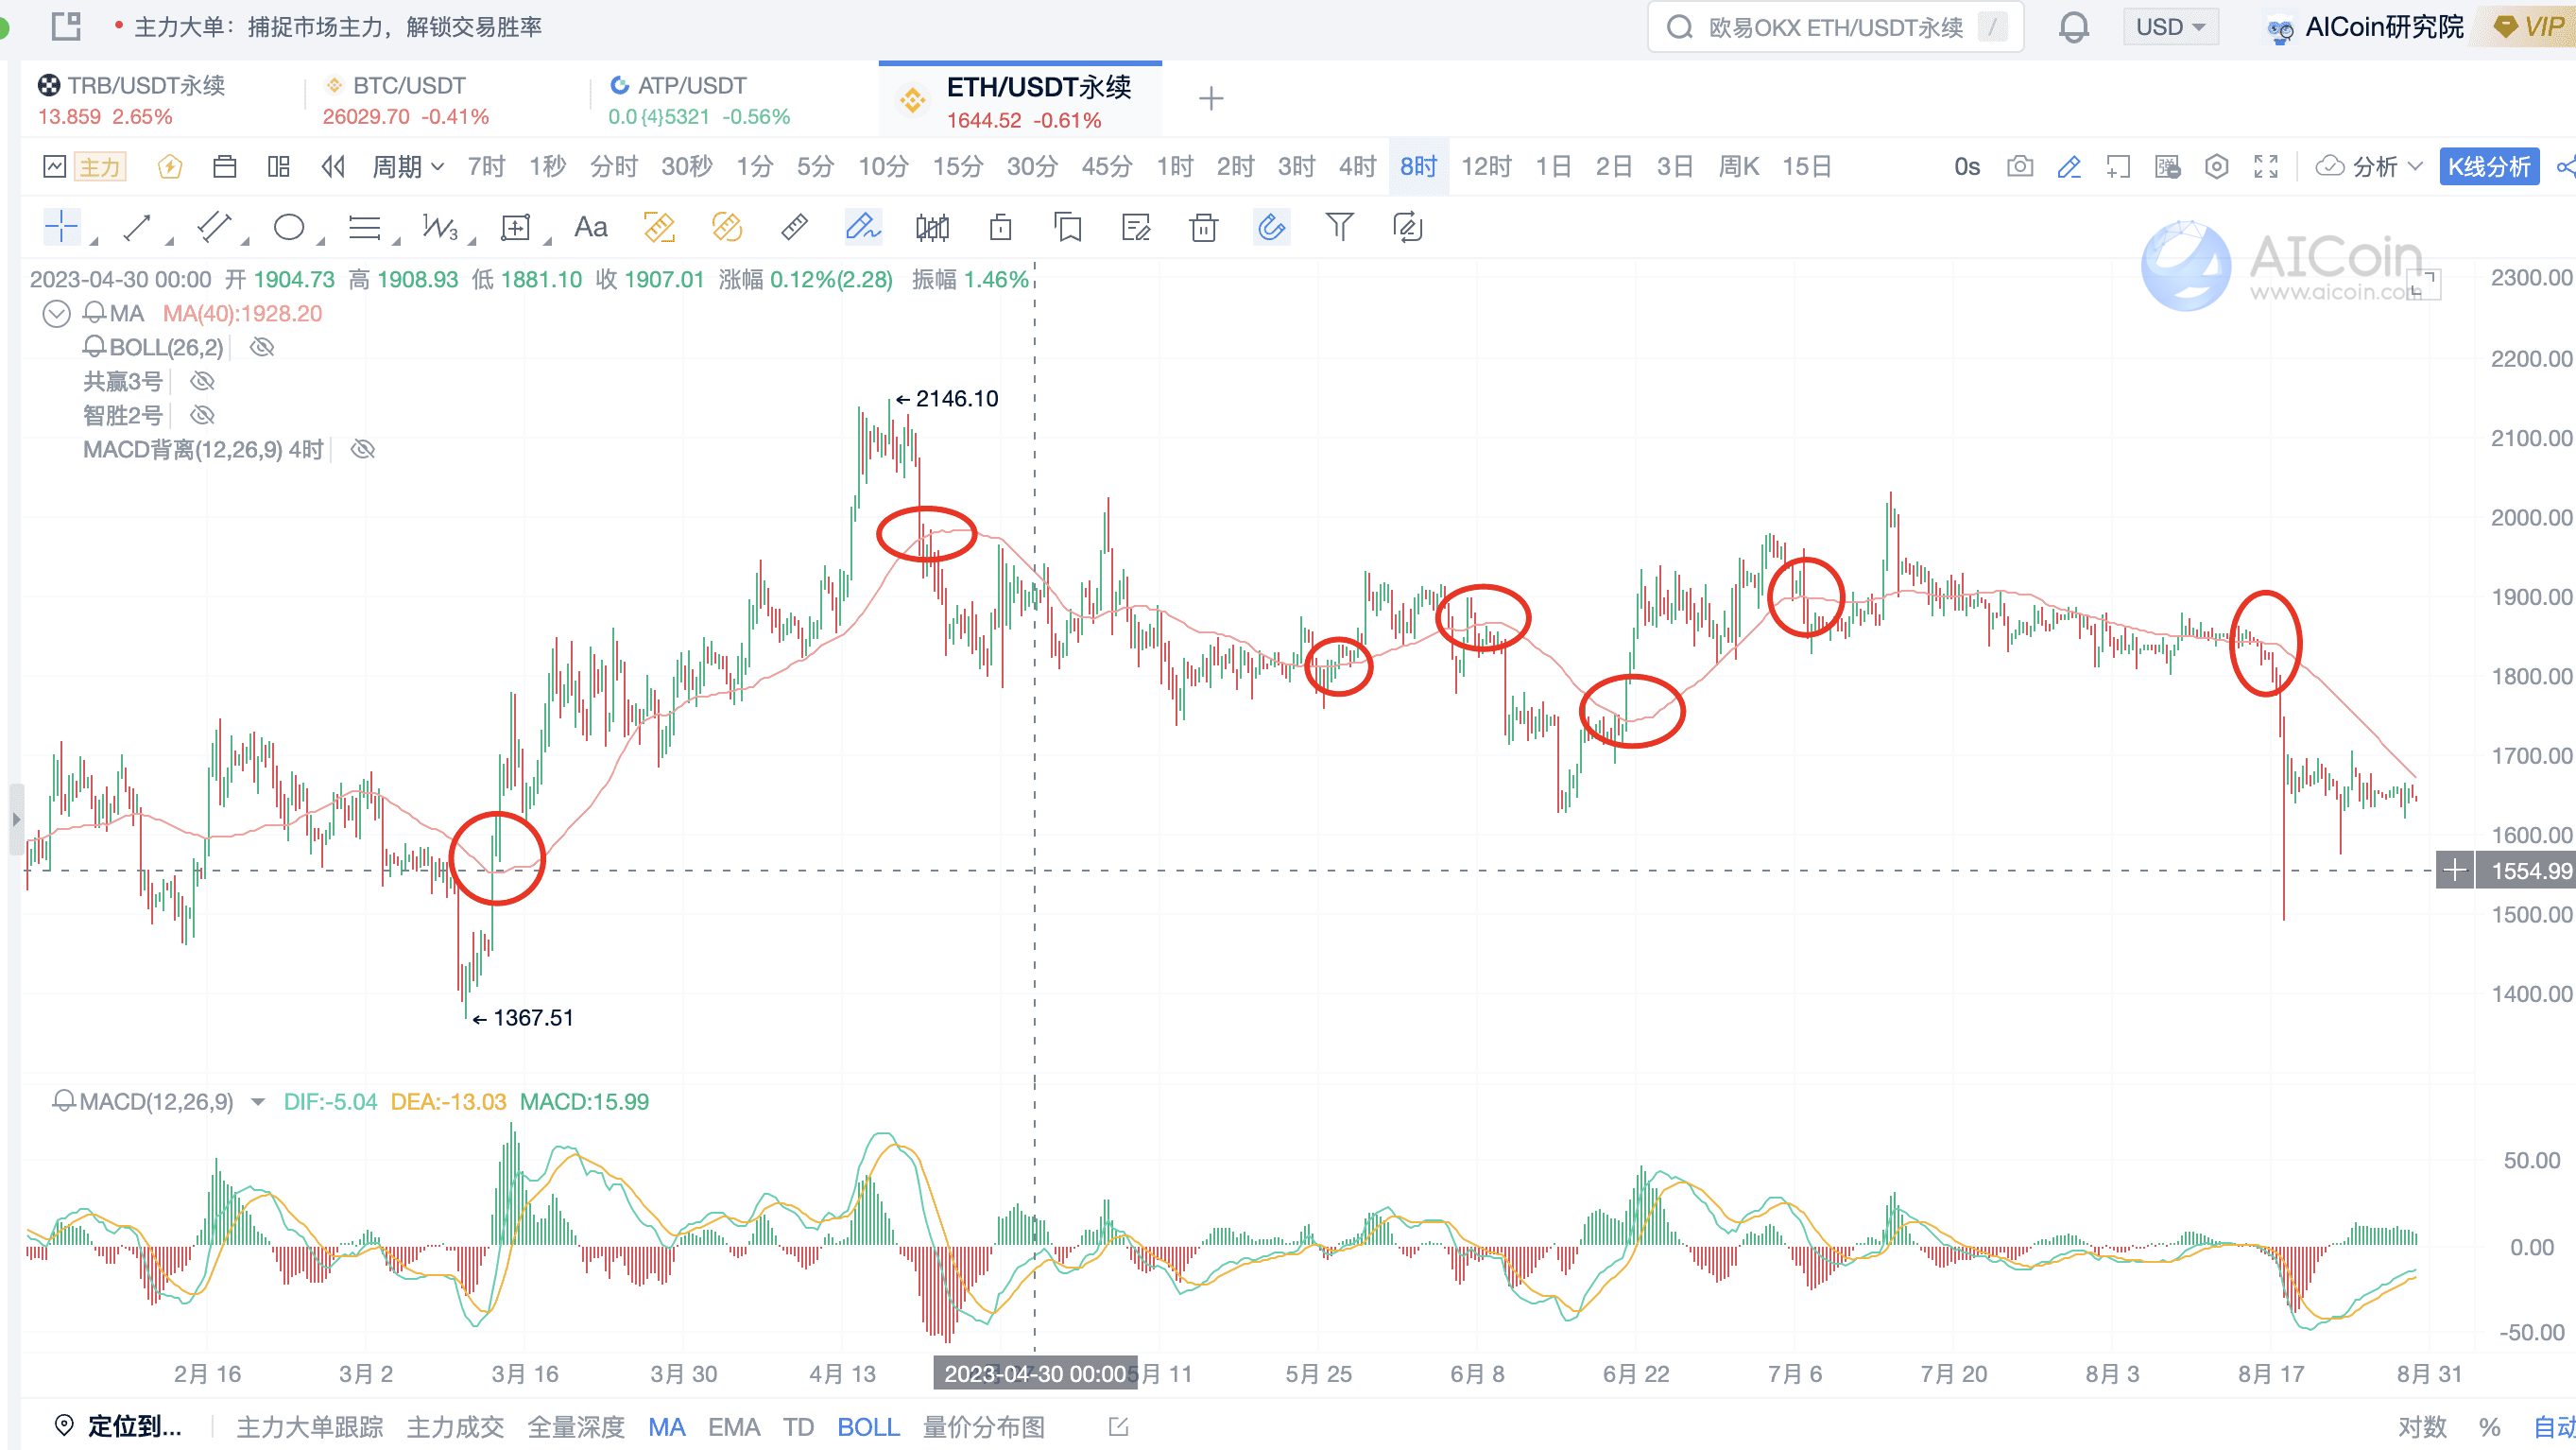
Note: If individuals are unsure how to combine major orders or chip distribution, they can track AICoin's updates and pay attention to how major orders are combined with the 8-hour period.
Second usage: 8-hour period + DIF Line + Major Order Flow (Chip Distribution)
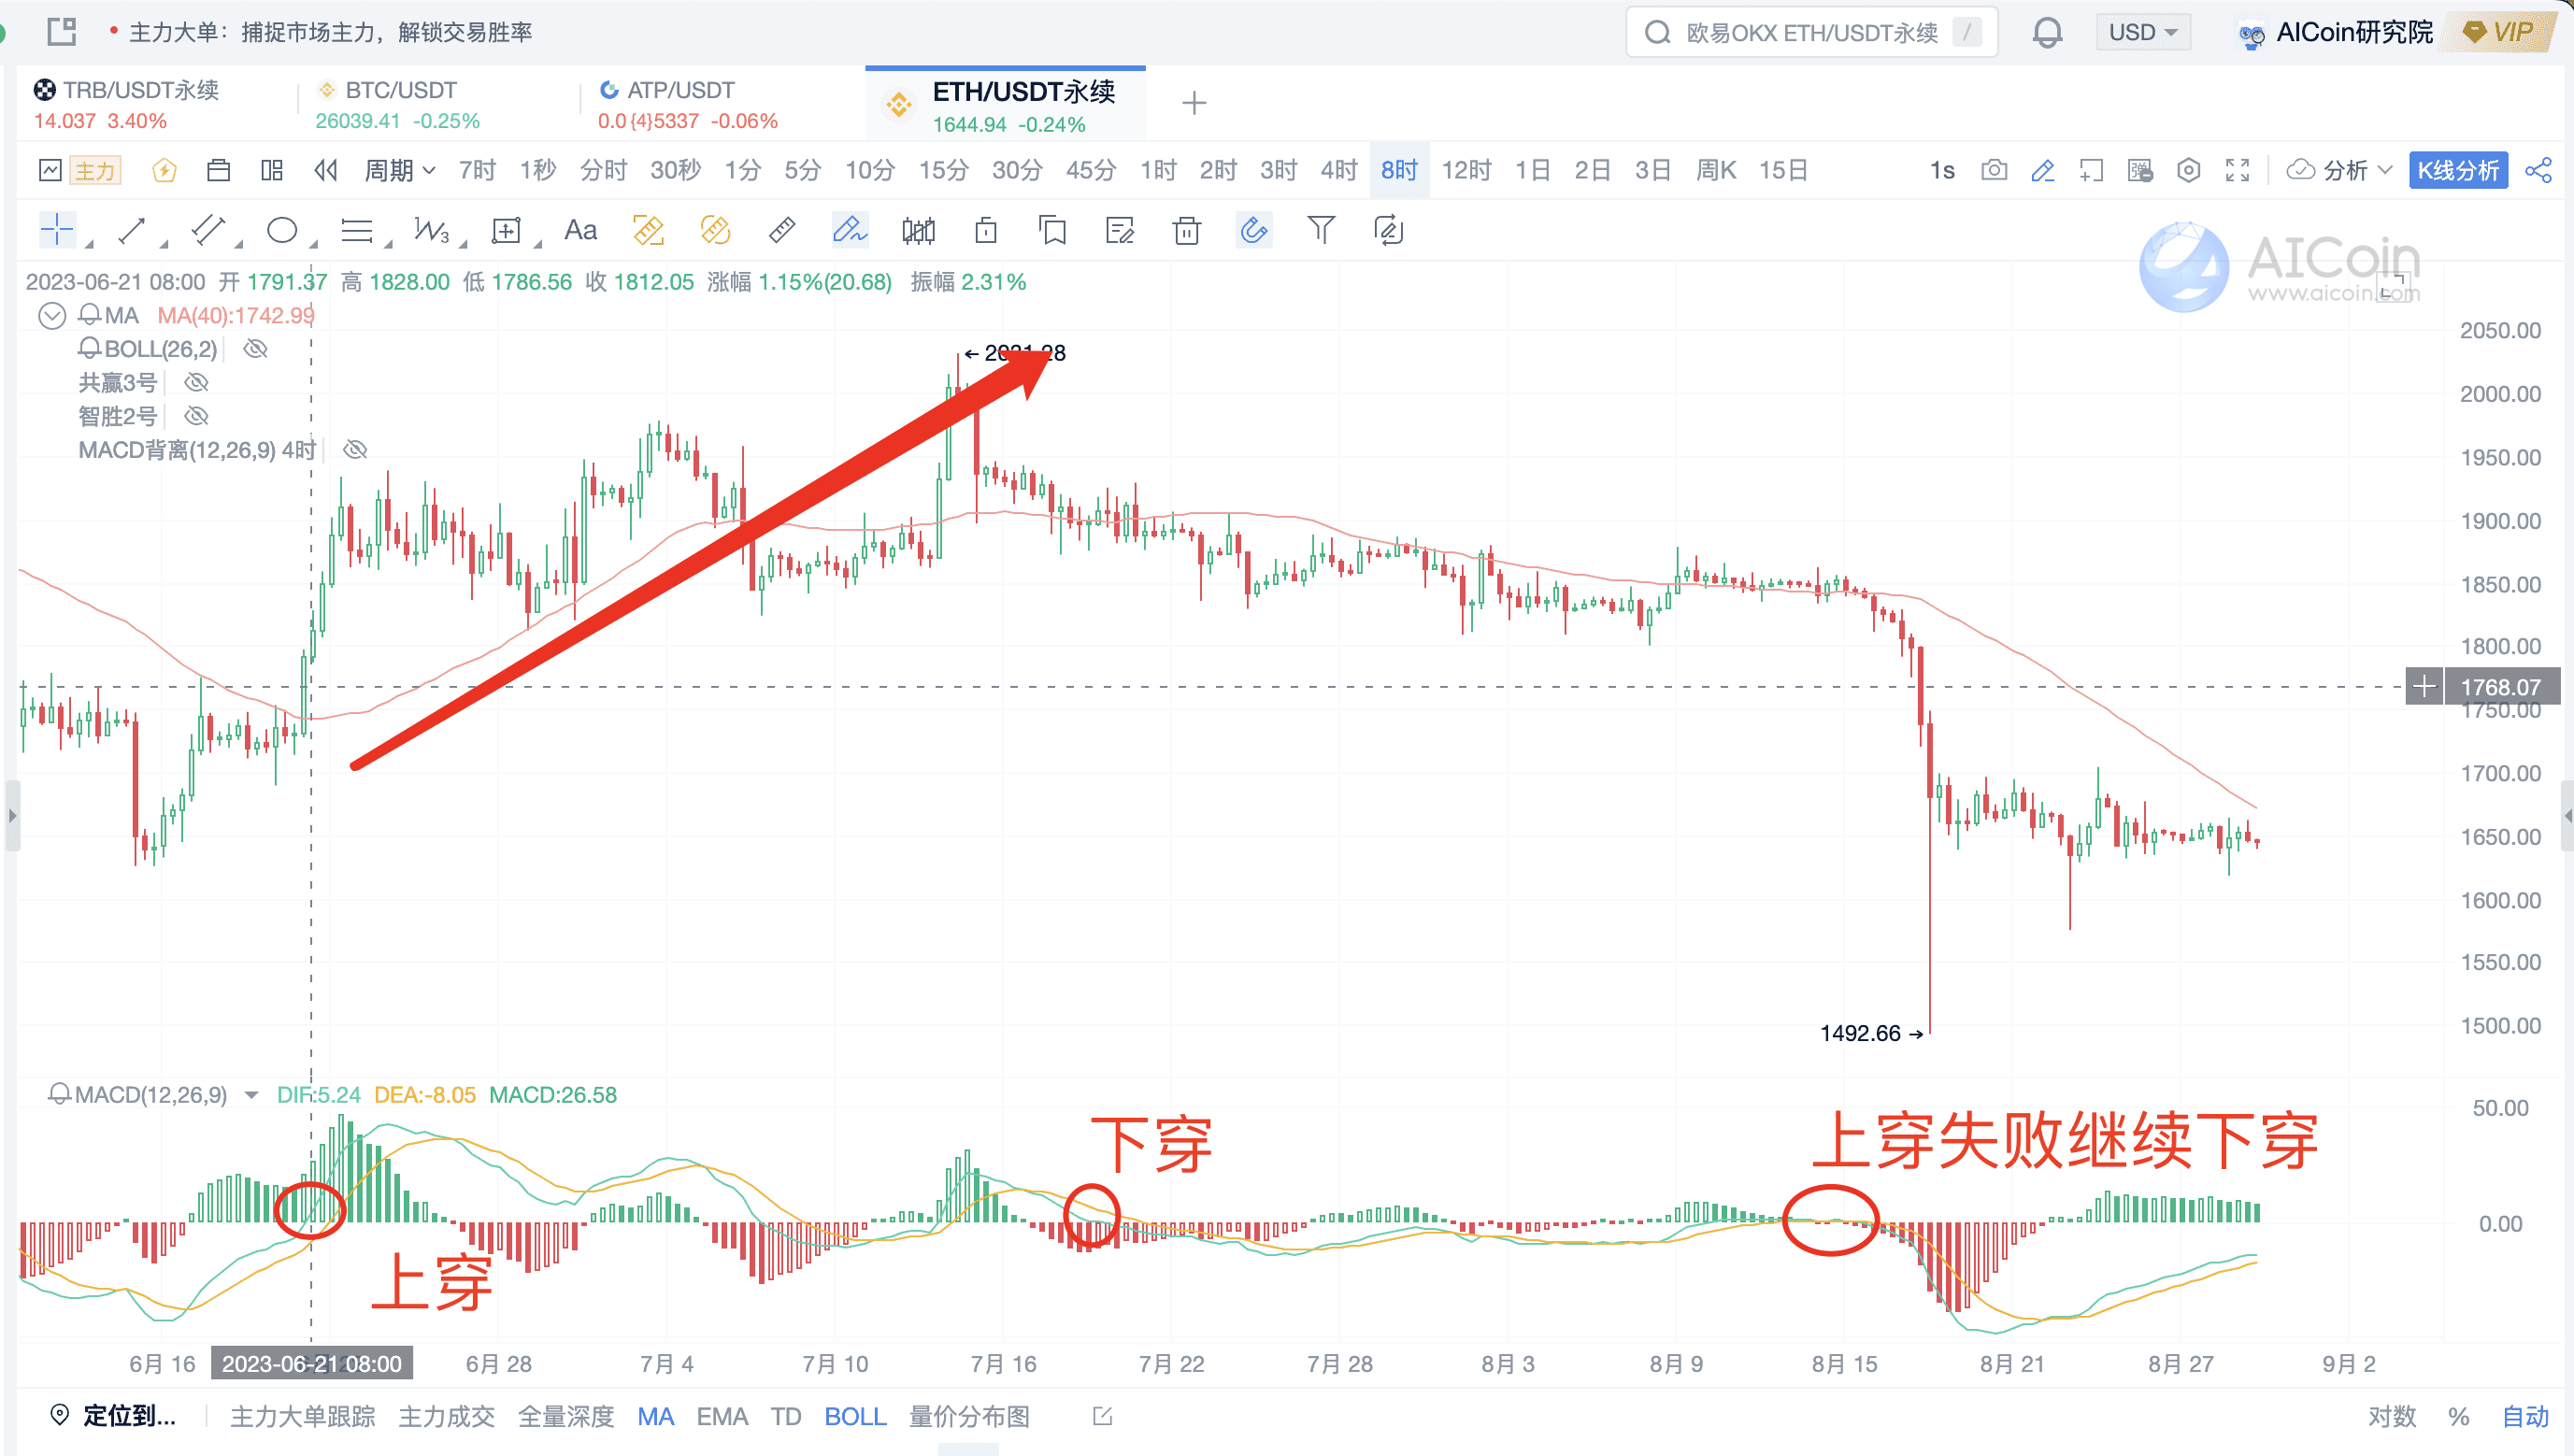
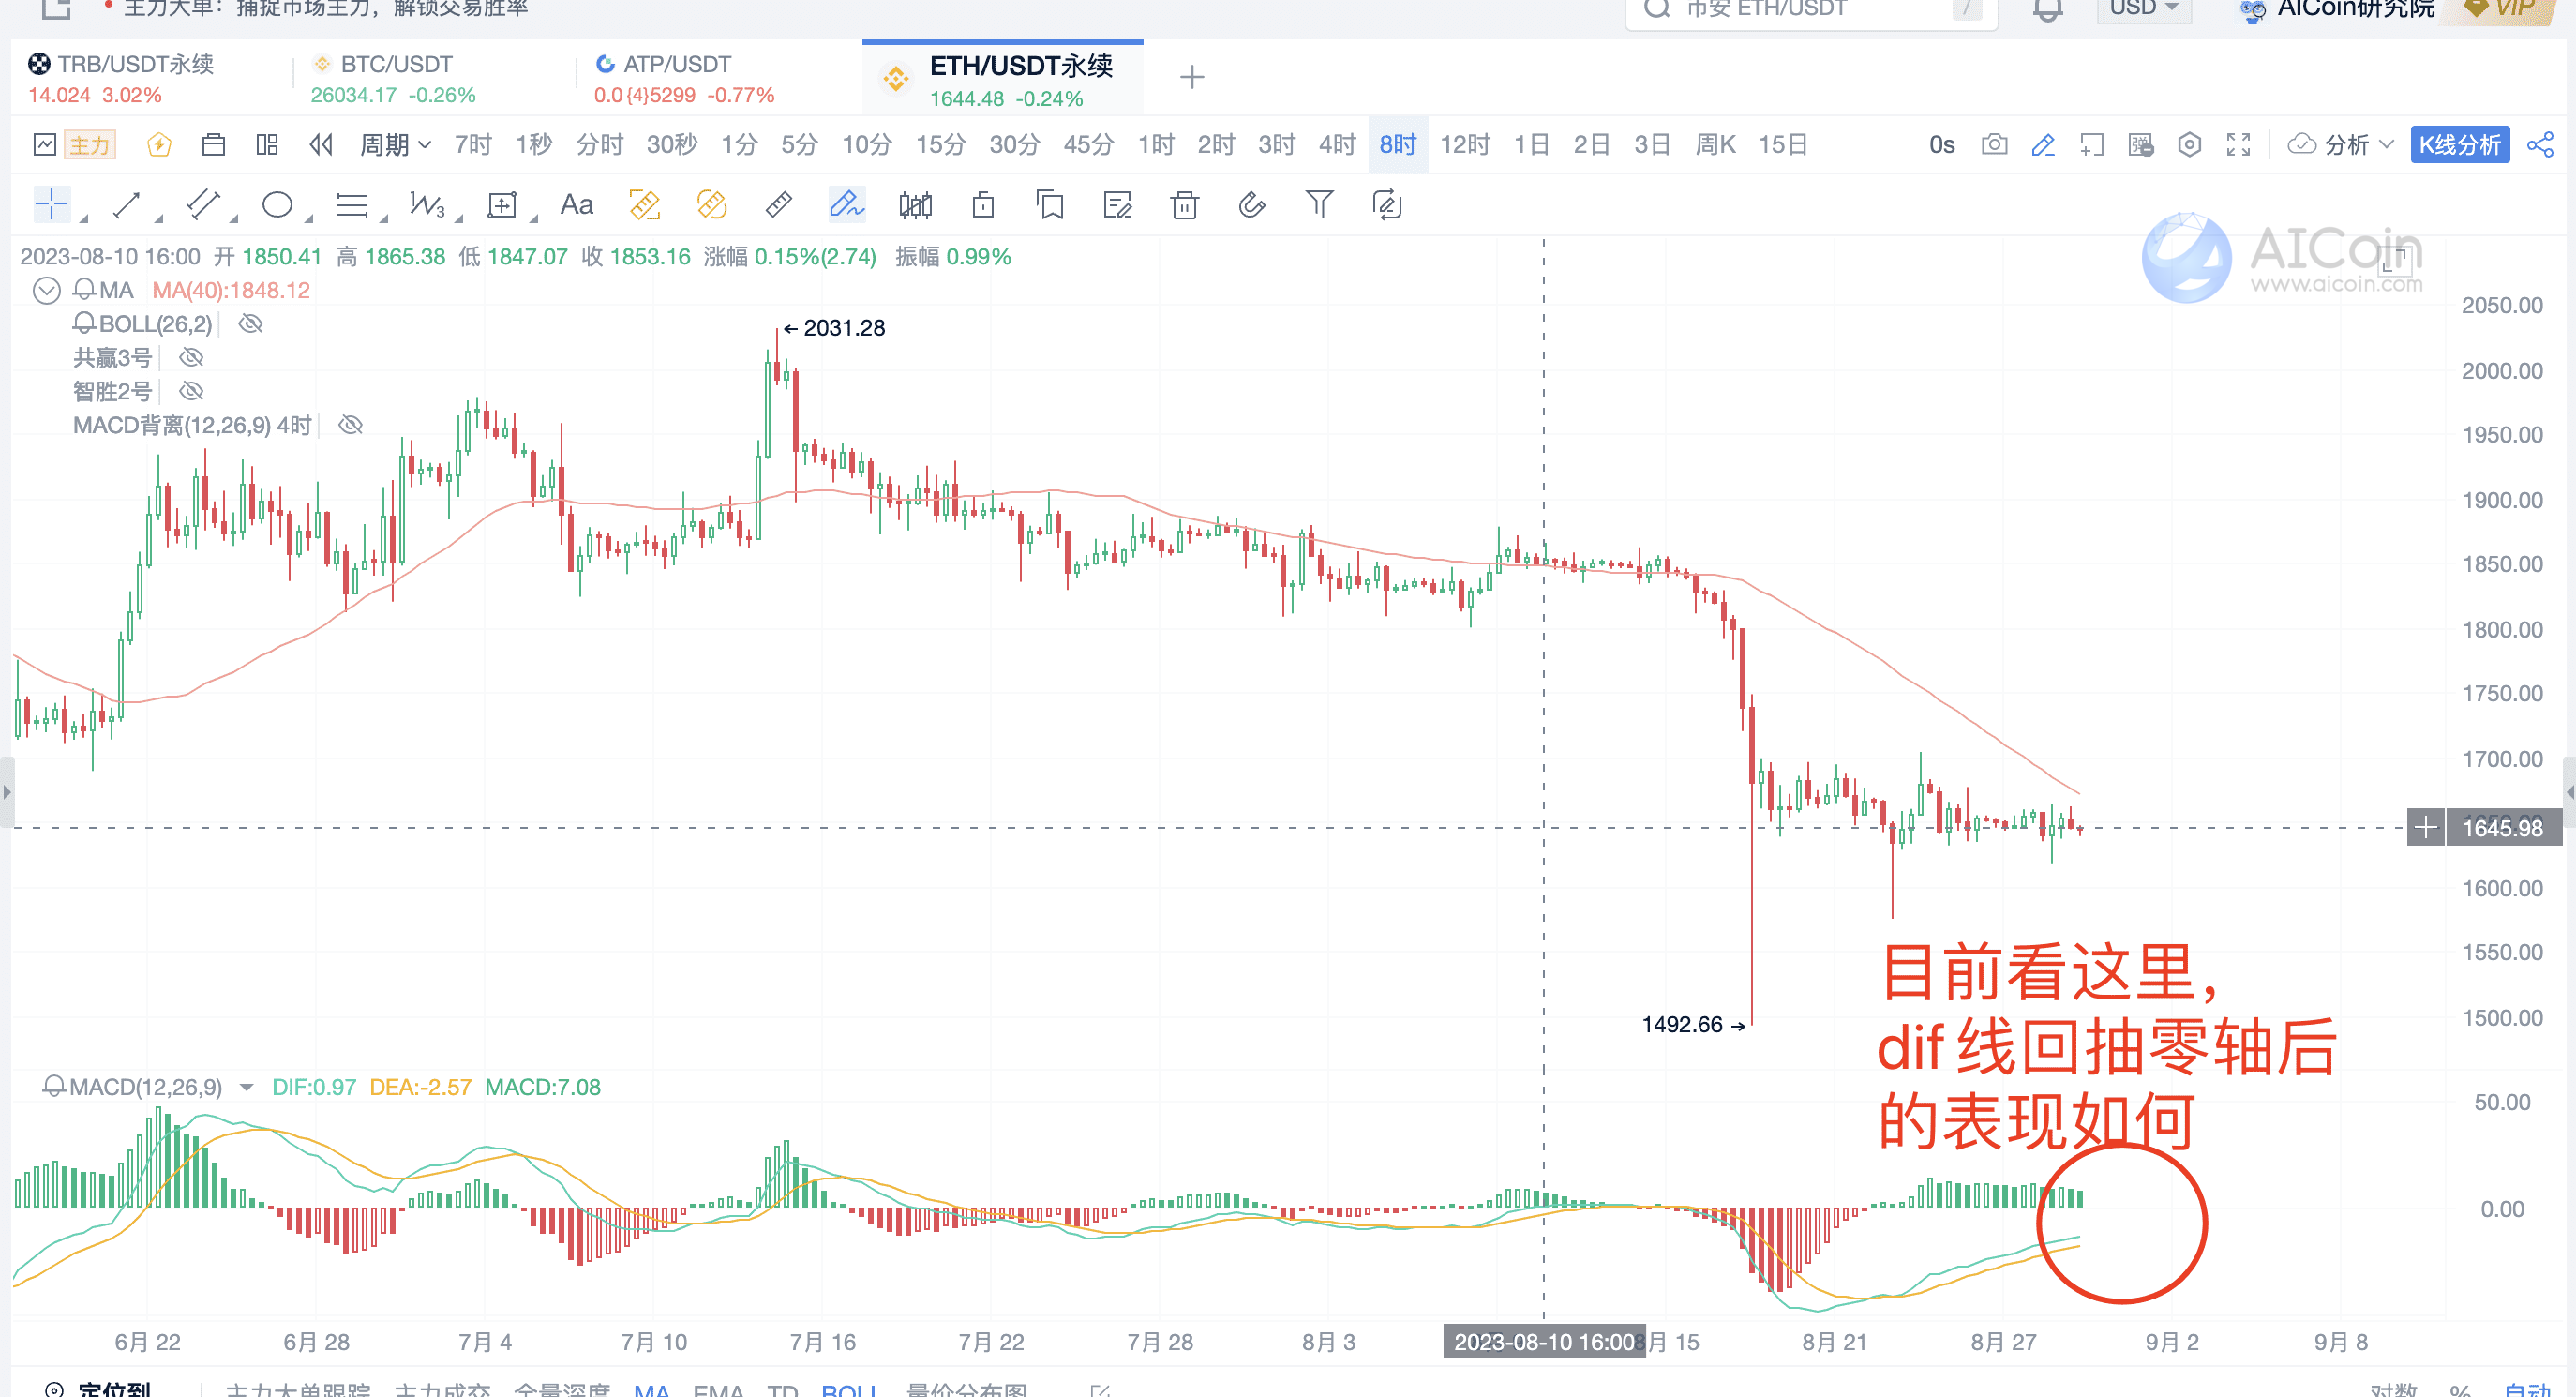
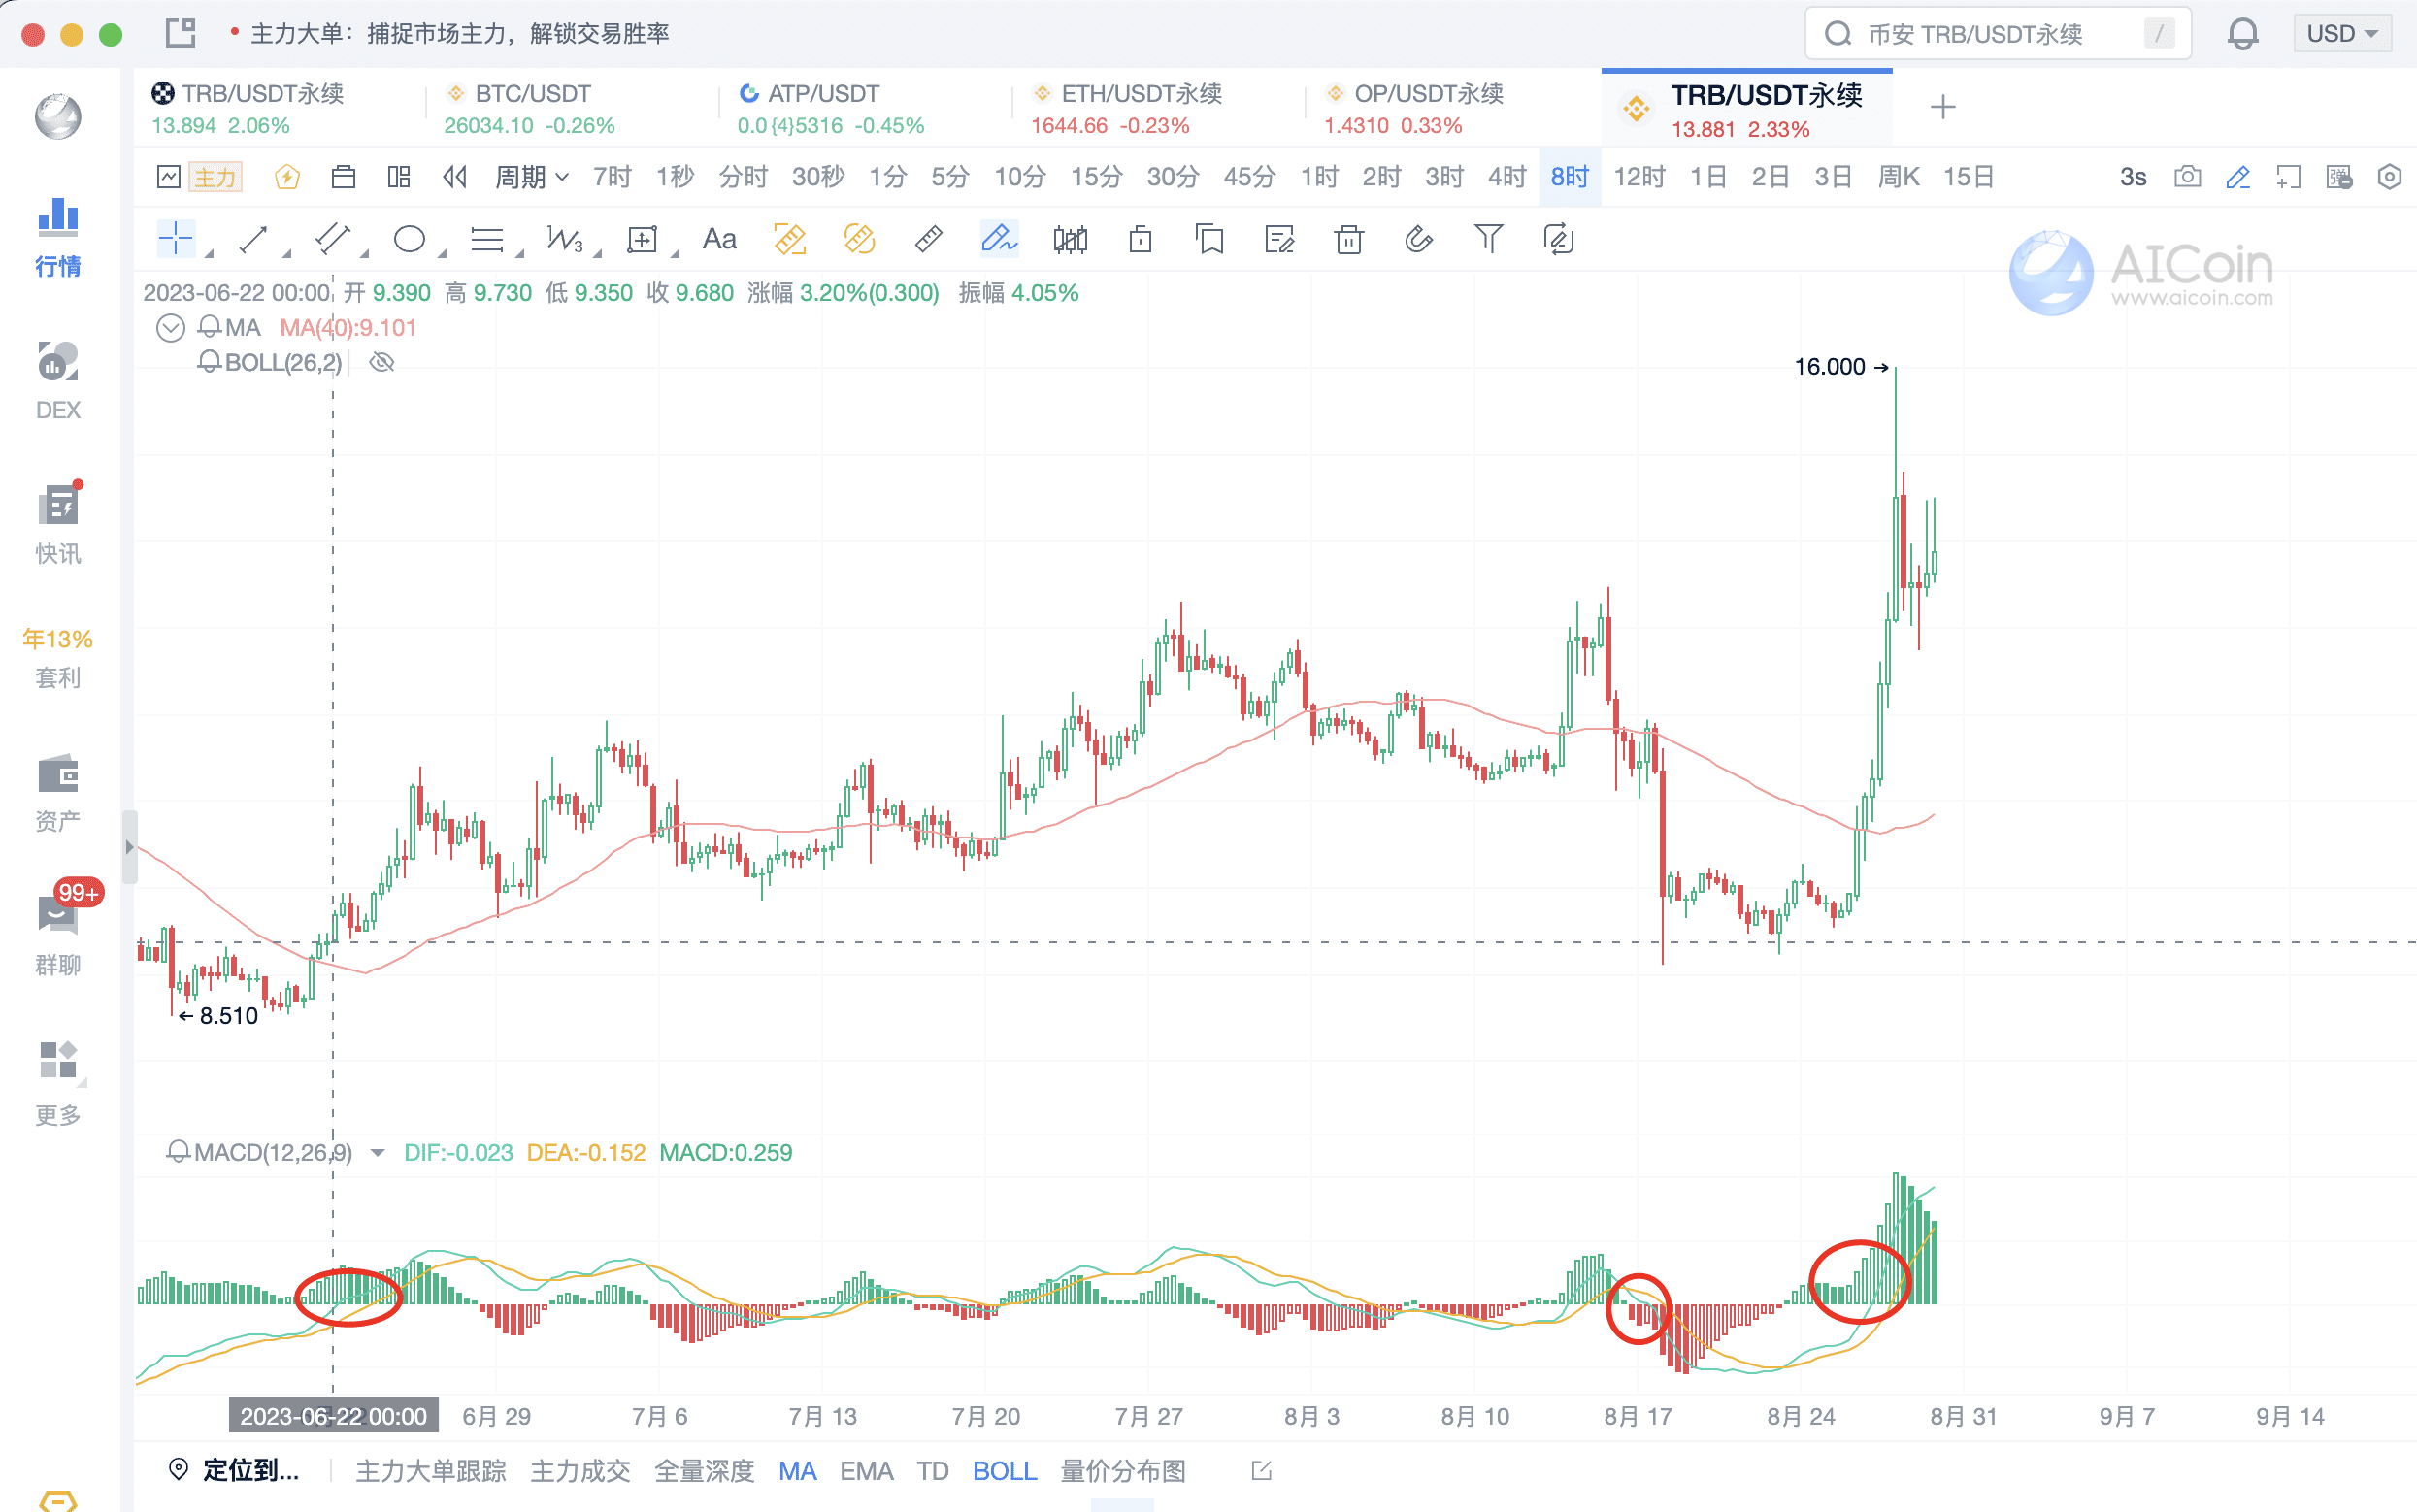
DIF crossing above the 0 axis indicates a bullish trend; if there is major order flow or chip movement at this time, it strongly indicates a bullish trend, and entry should be considered promptly.
DIF crossing below the 0 axis indicates a bearish trend; if there is major order flow or chip movement at this time, it strongly indicates a bearish trend, and exiting should be considered promptly.
Example analysis
① ETH/USDT Perpetual
② OP/USDT Perpetual
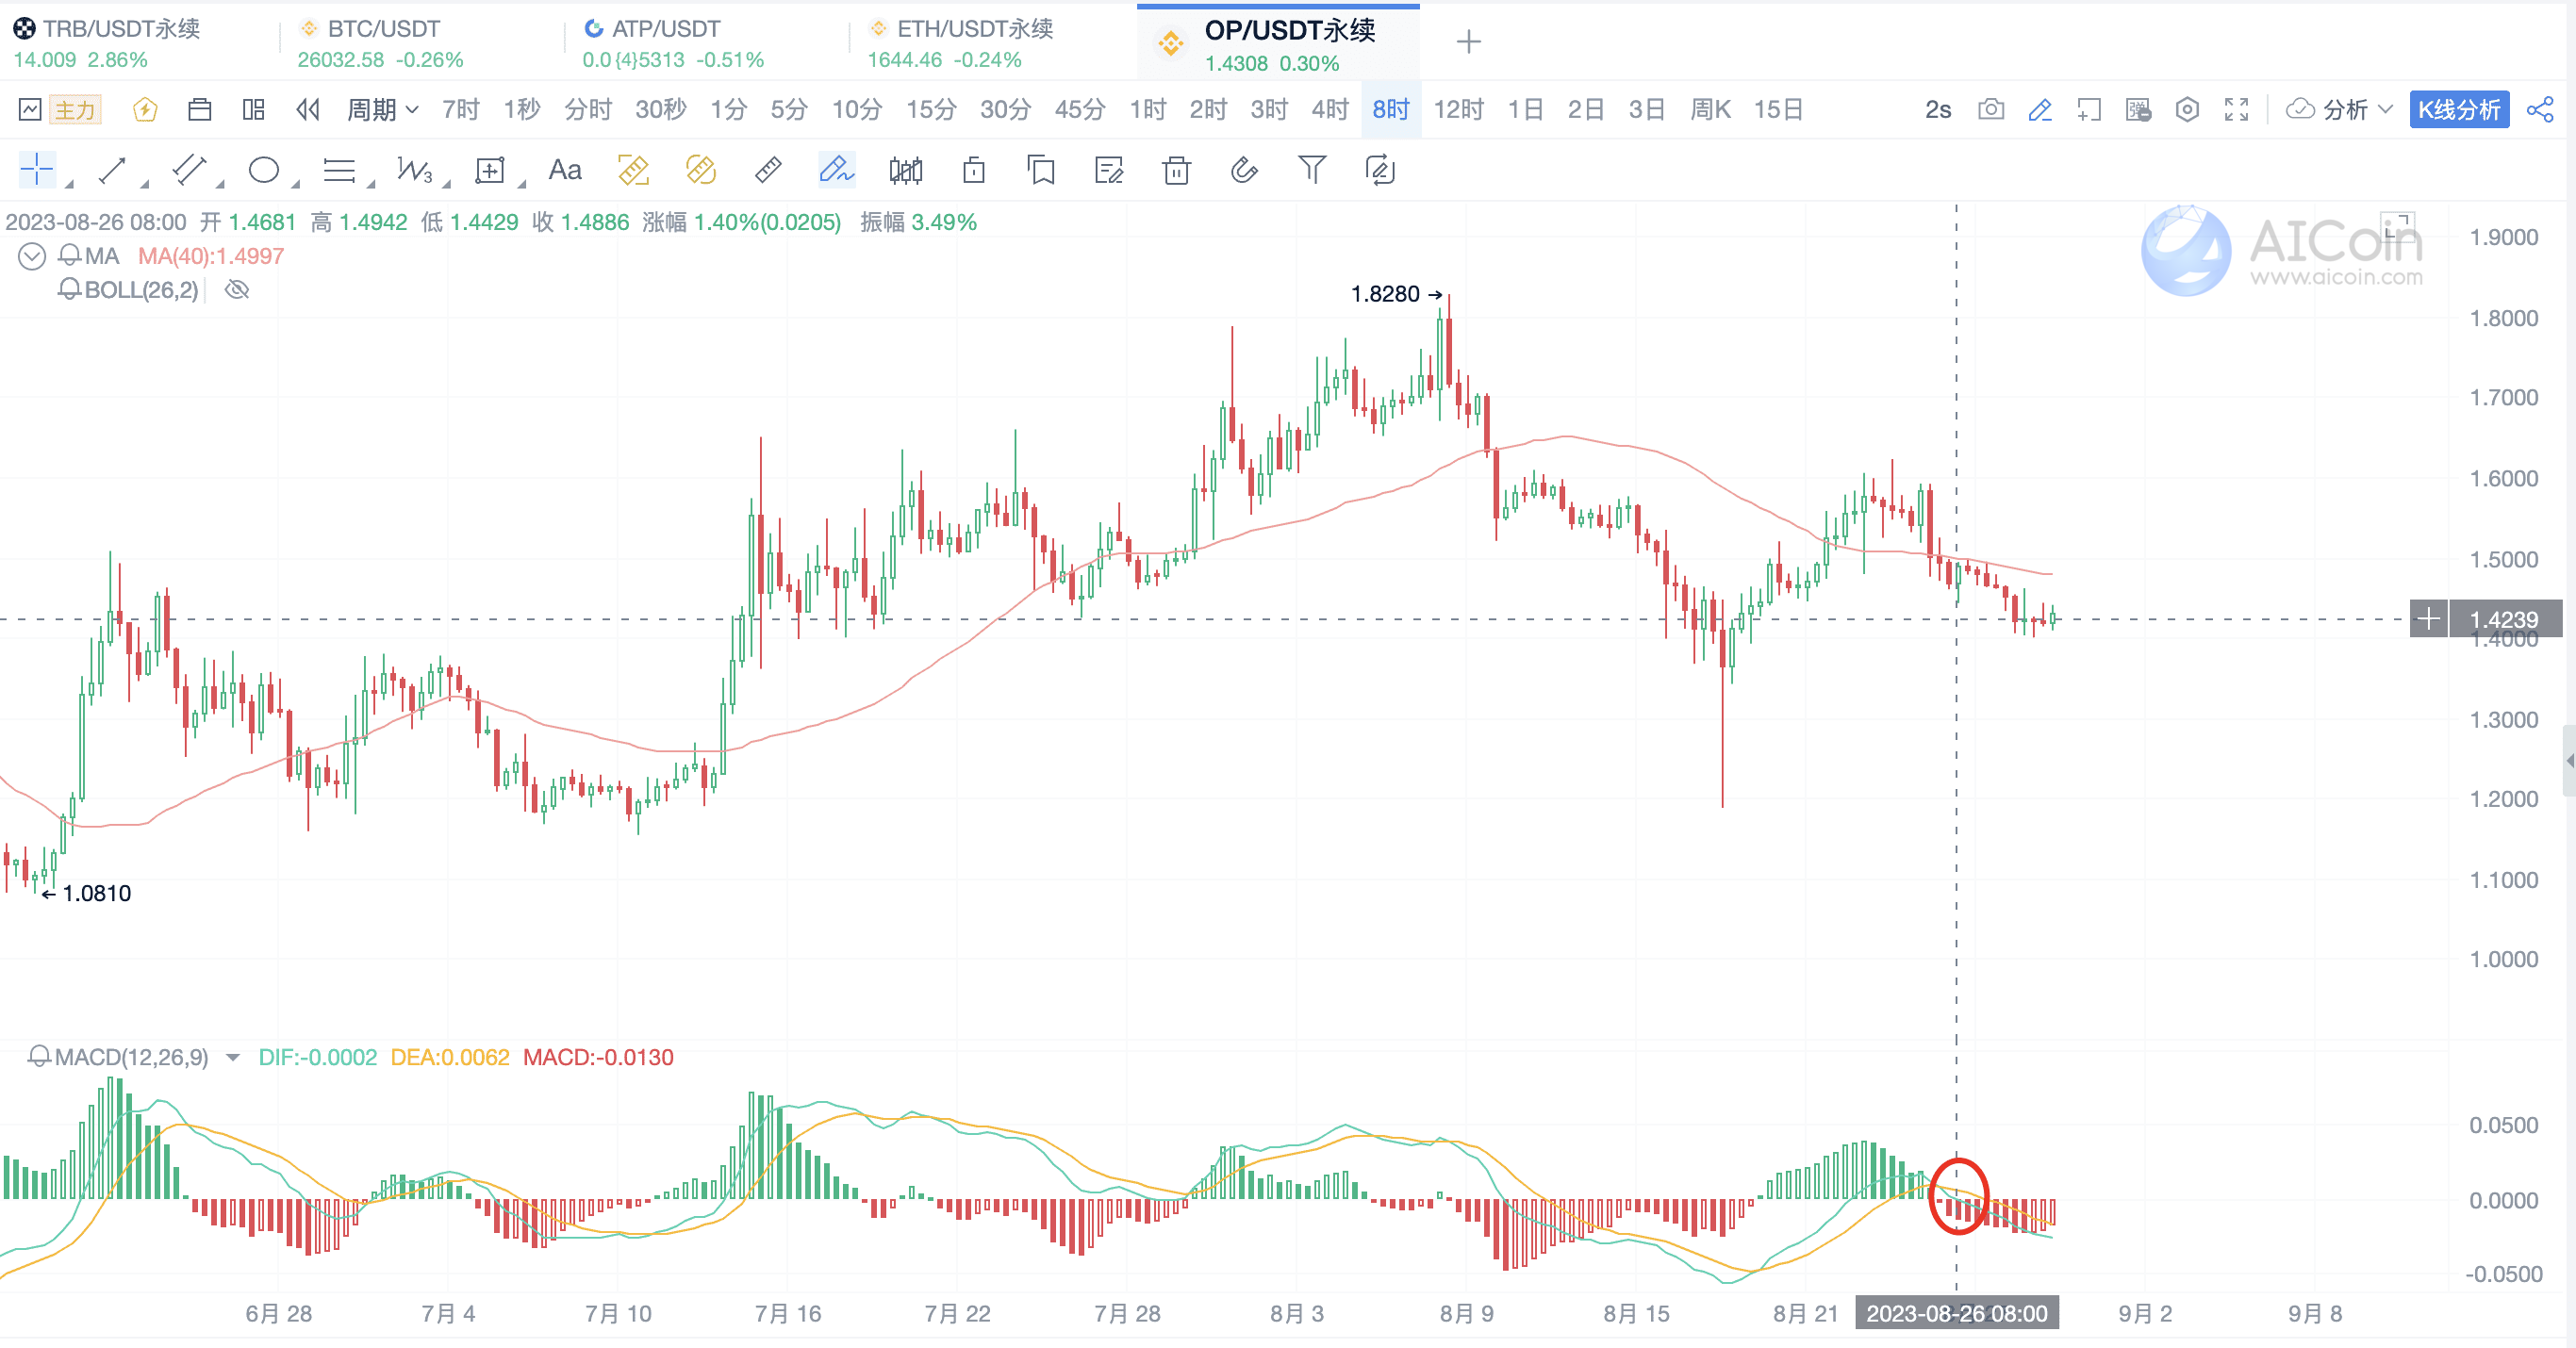
Note: Currently, the latest MACD volume has some contraction, and the next key opportunity will depend on the situation when it pulls back to the 0 axis.
OP has not formed a bullish divergence in the 8-hour period, and the probability of oscillating downward digestion is higher.
③ TRB/USDT Perpetual
You can use the 8-hour period by becoming a Pro member: https://aicoin.app/zh-CN/vip/chartpro
Recommended Reading
《Teaching You to Find Suitable Targets for Grid Trading, No Longer Easily Broken》
《Revealing the Market Leaders from the Perspective of Chip Distribution》
For more live content, please follow AICoin's "News/Information-Live Review" section, and feel free to download AICoin PC End.
免责声明:本文章仅代表作者个人观点,不代表本平台的立场和观点。本文章仅供信息分享,不构成对任何人的任何投资建议。用户与作者之间的任何争议,与本平台无关。如网页中刊载的文章或图片涉及侵权,请提供相关的权利证明和身份证明发送邮件到support@aicoin.com,本平台相关工作人员将会进行核查。


