On the evening of August 8th, AICoin researchers conducted a live graphic and textual sharing on "Reading the Main Force through Chips" in the AICoin PC-end group chat. Here is a summary of the live content.
I. Chip Distribution
1. Meaning
Chip distribution, also known as the volume-price distribution chart, essentially reflects the information of the main force's control, the fund situation of the long and short game, and the changing trend of market costs. 《Teach You to Identify Main Force Behavior through Chip Distribution》
By becoming a Pro member, you can view the volume-price distribution chart and screen for major single orders: https://aicoin.app/zh-CN/vip/chartpro
2. Uses of Chip Distribution
(1) Identify support and resistance levels;
(2) Understand the price movement trajectory in order to predict price development.
3. Market Analysis of Chip Distribution
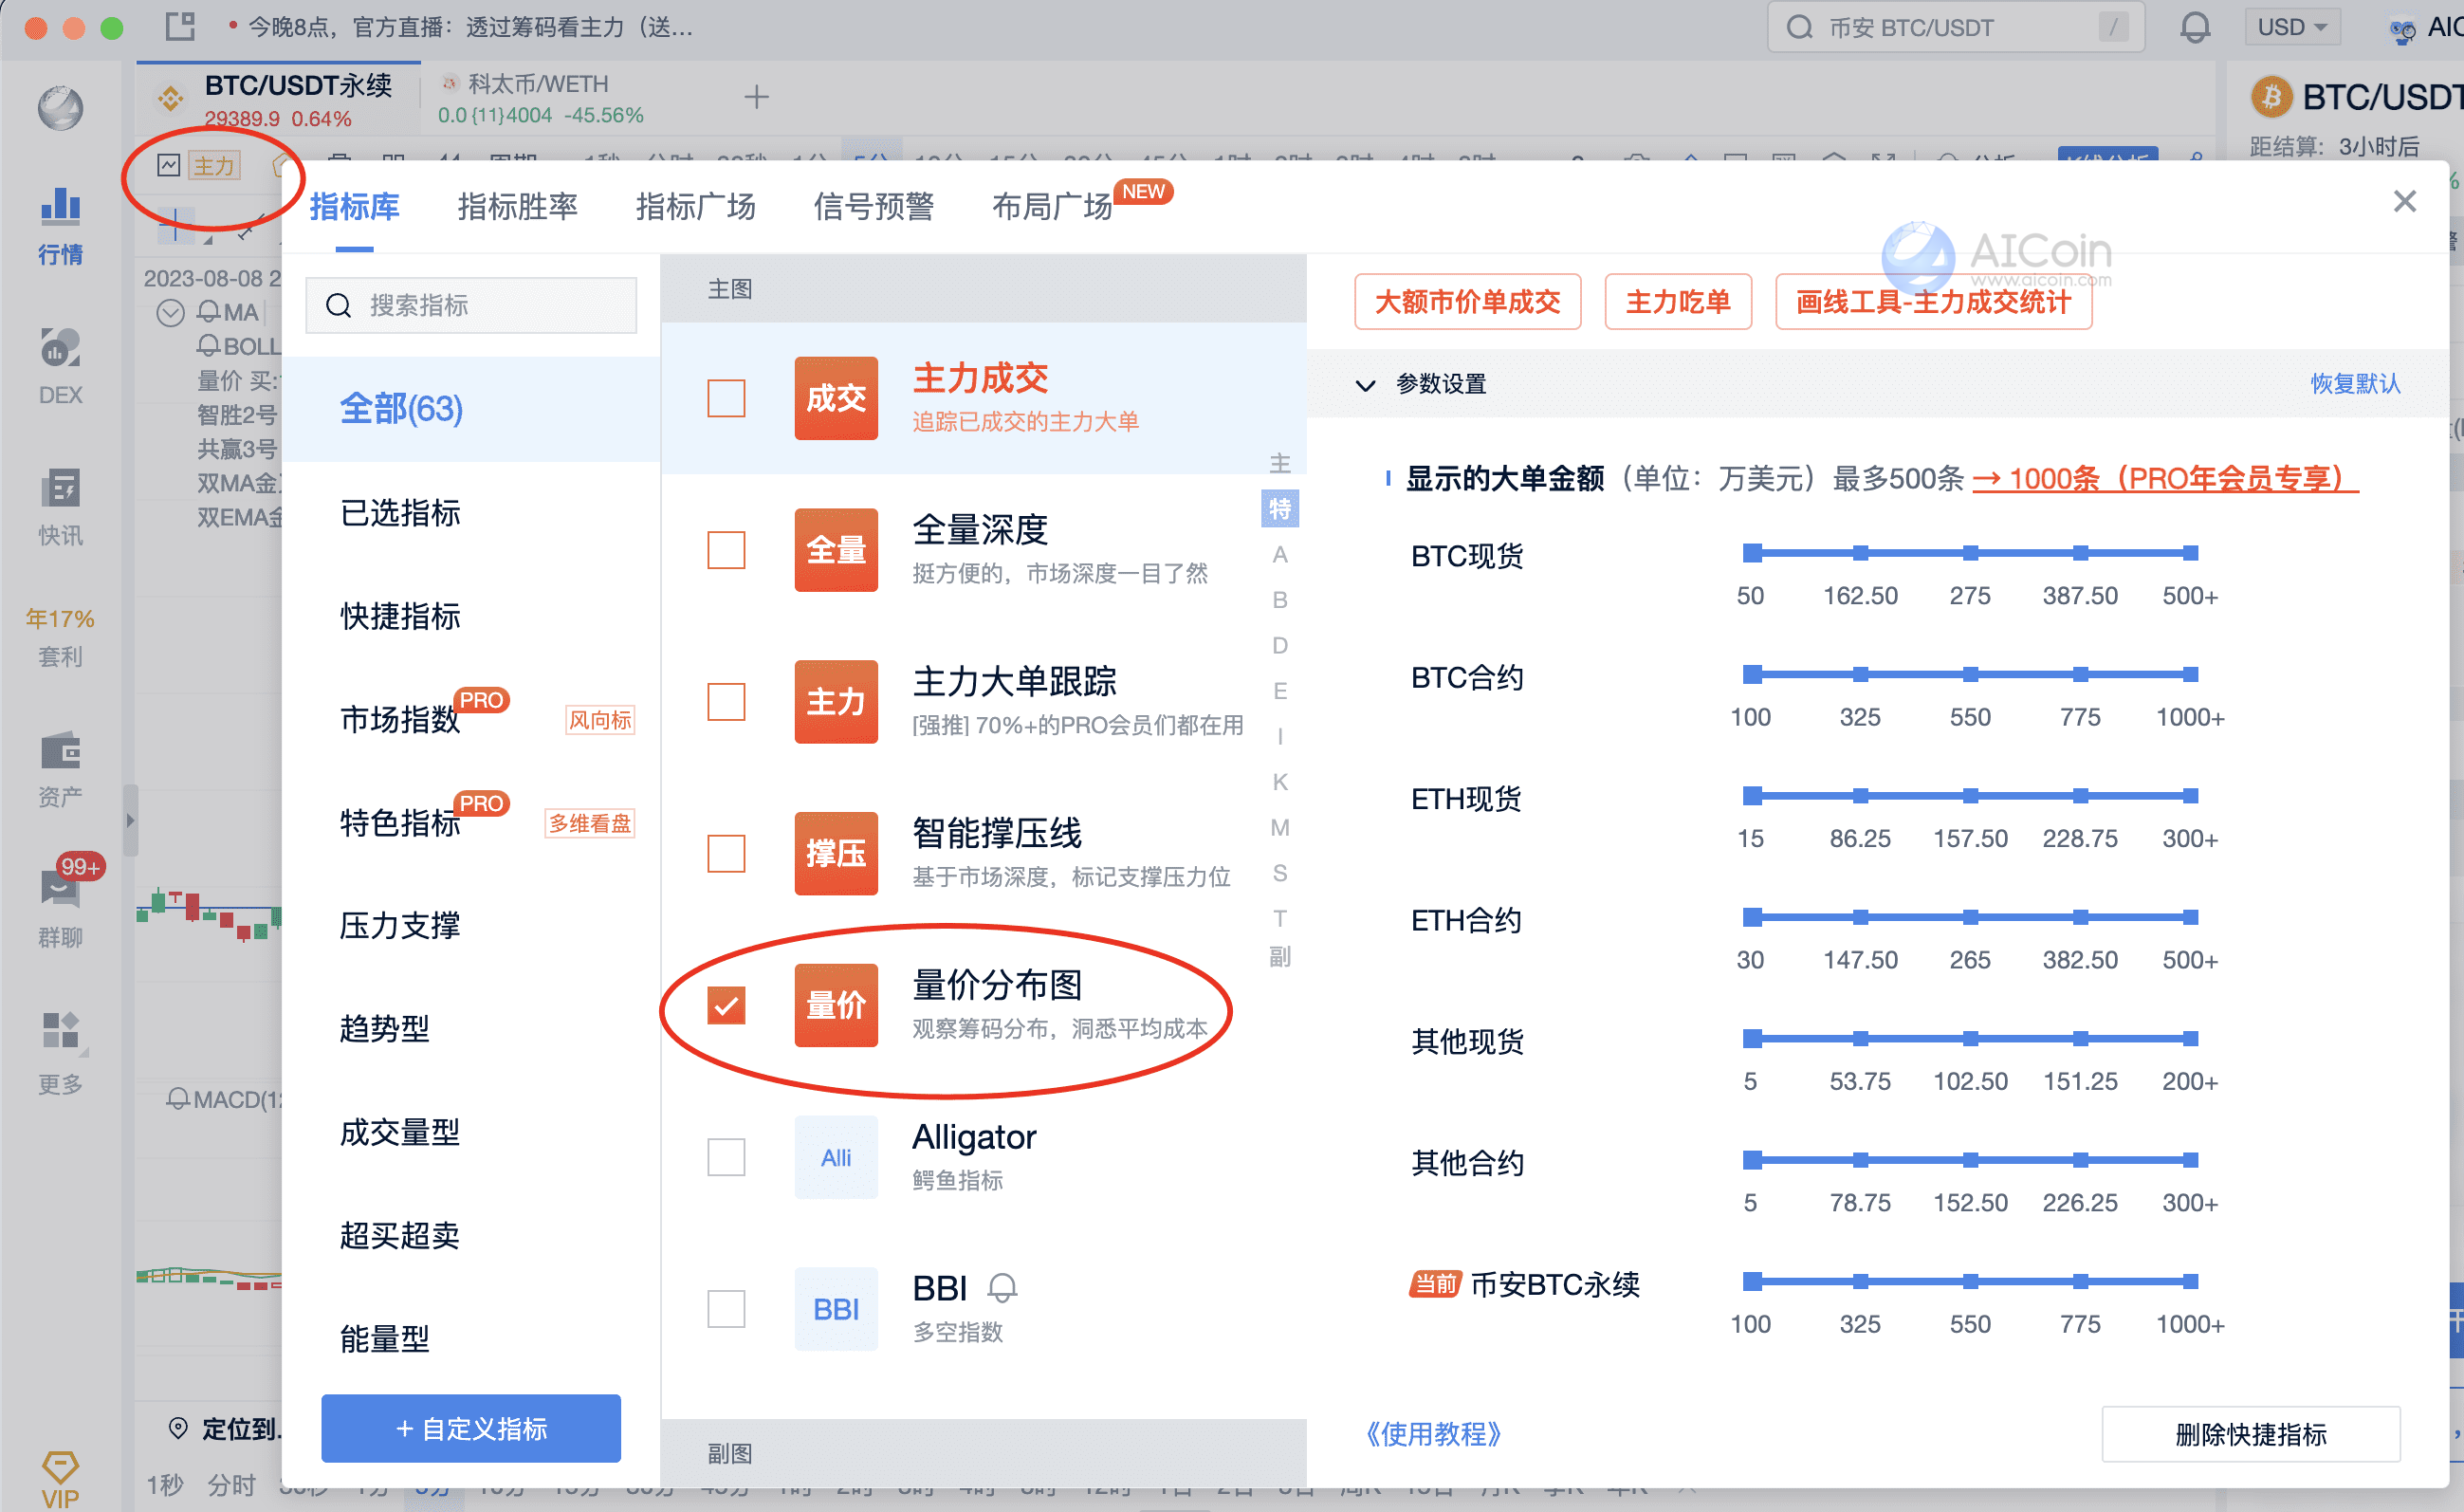
(1) Chip distribution position
(2) Example of ETH/USDT perpetual
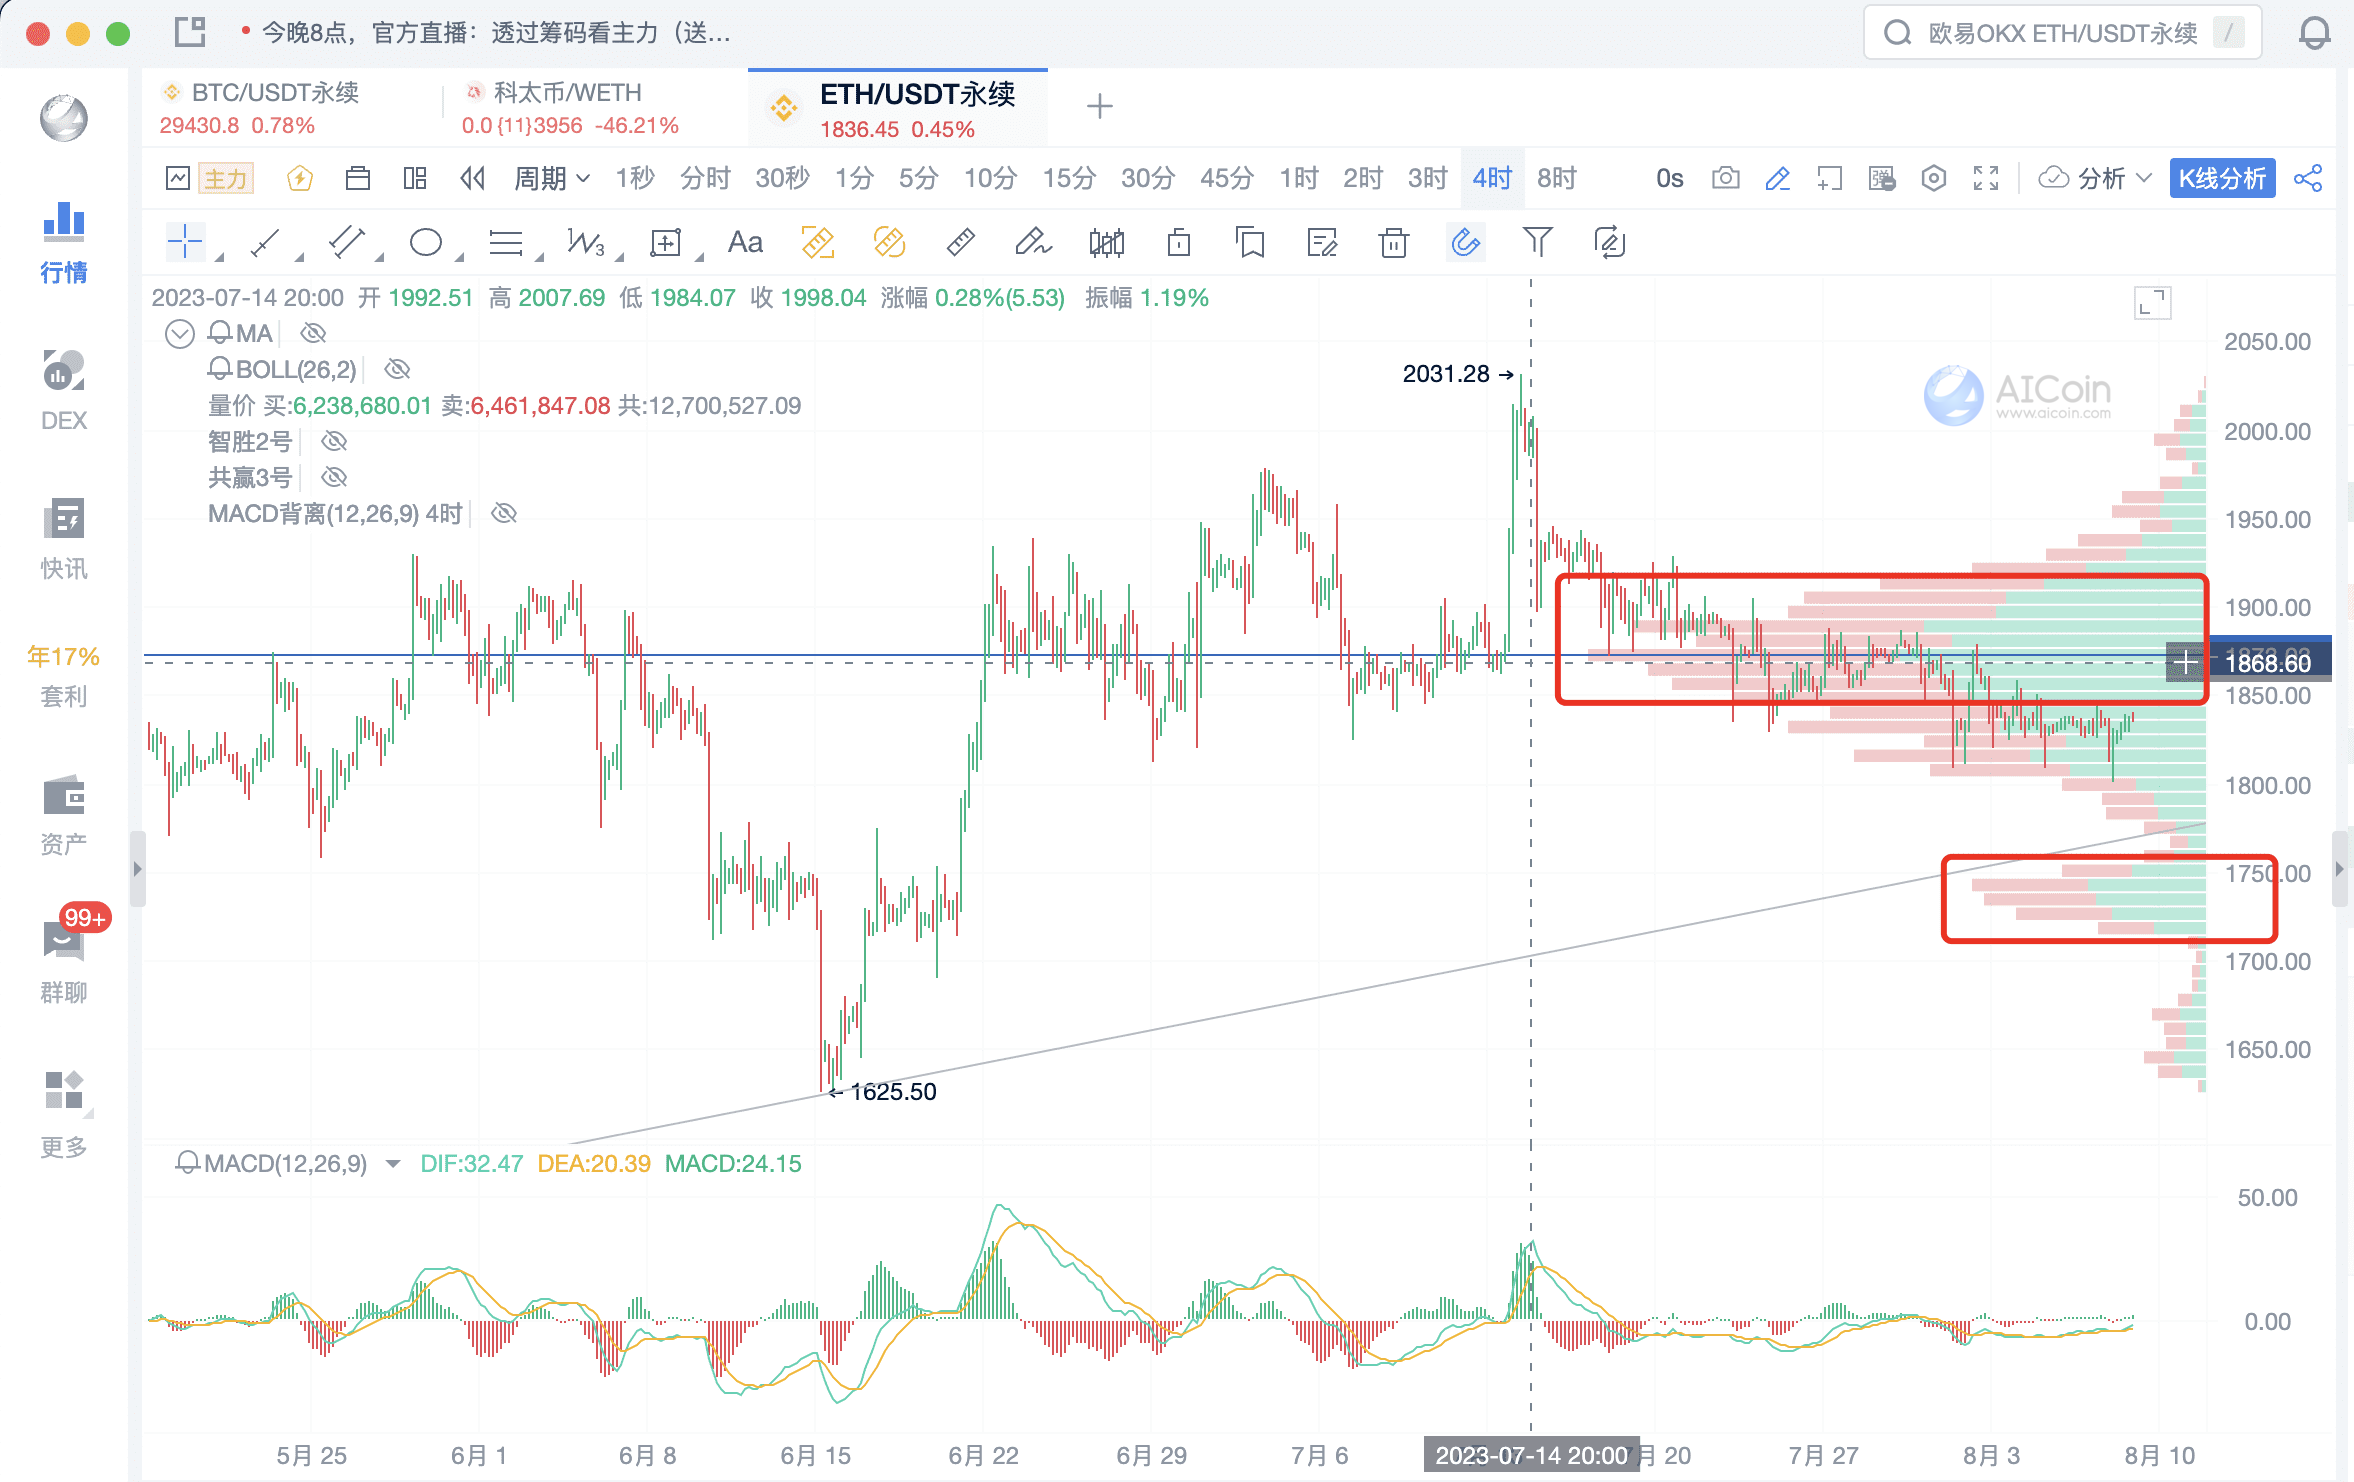
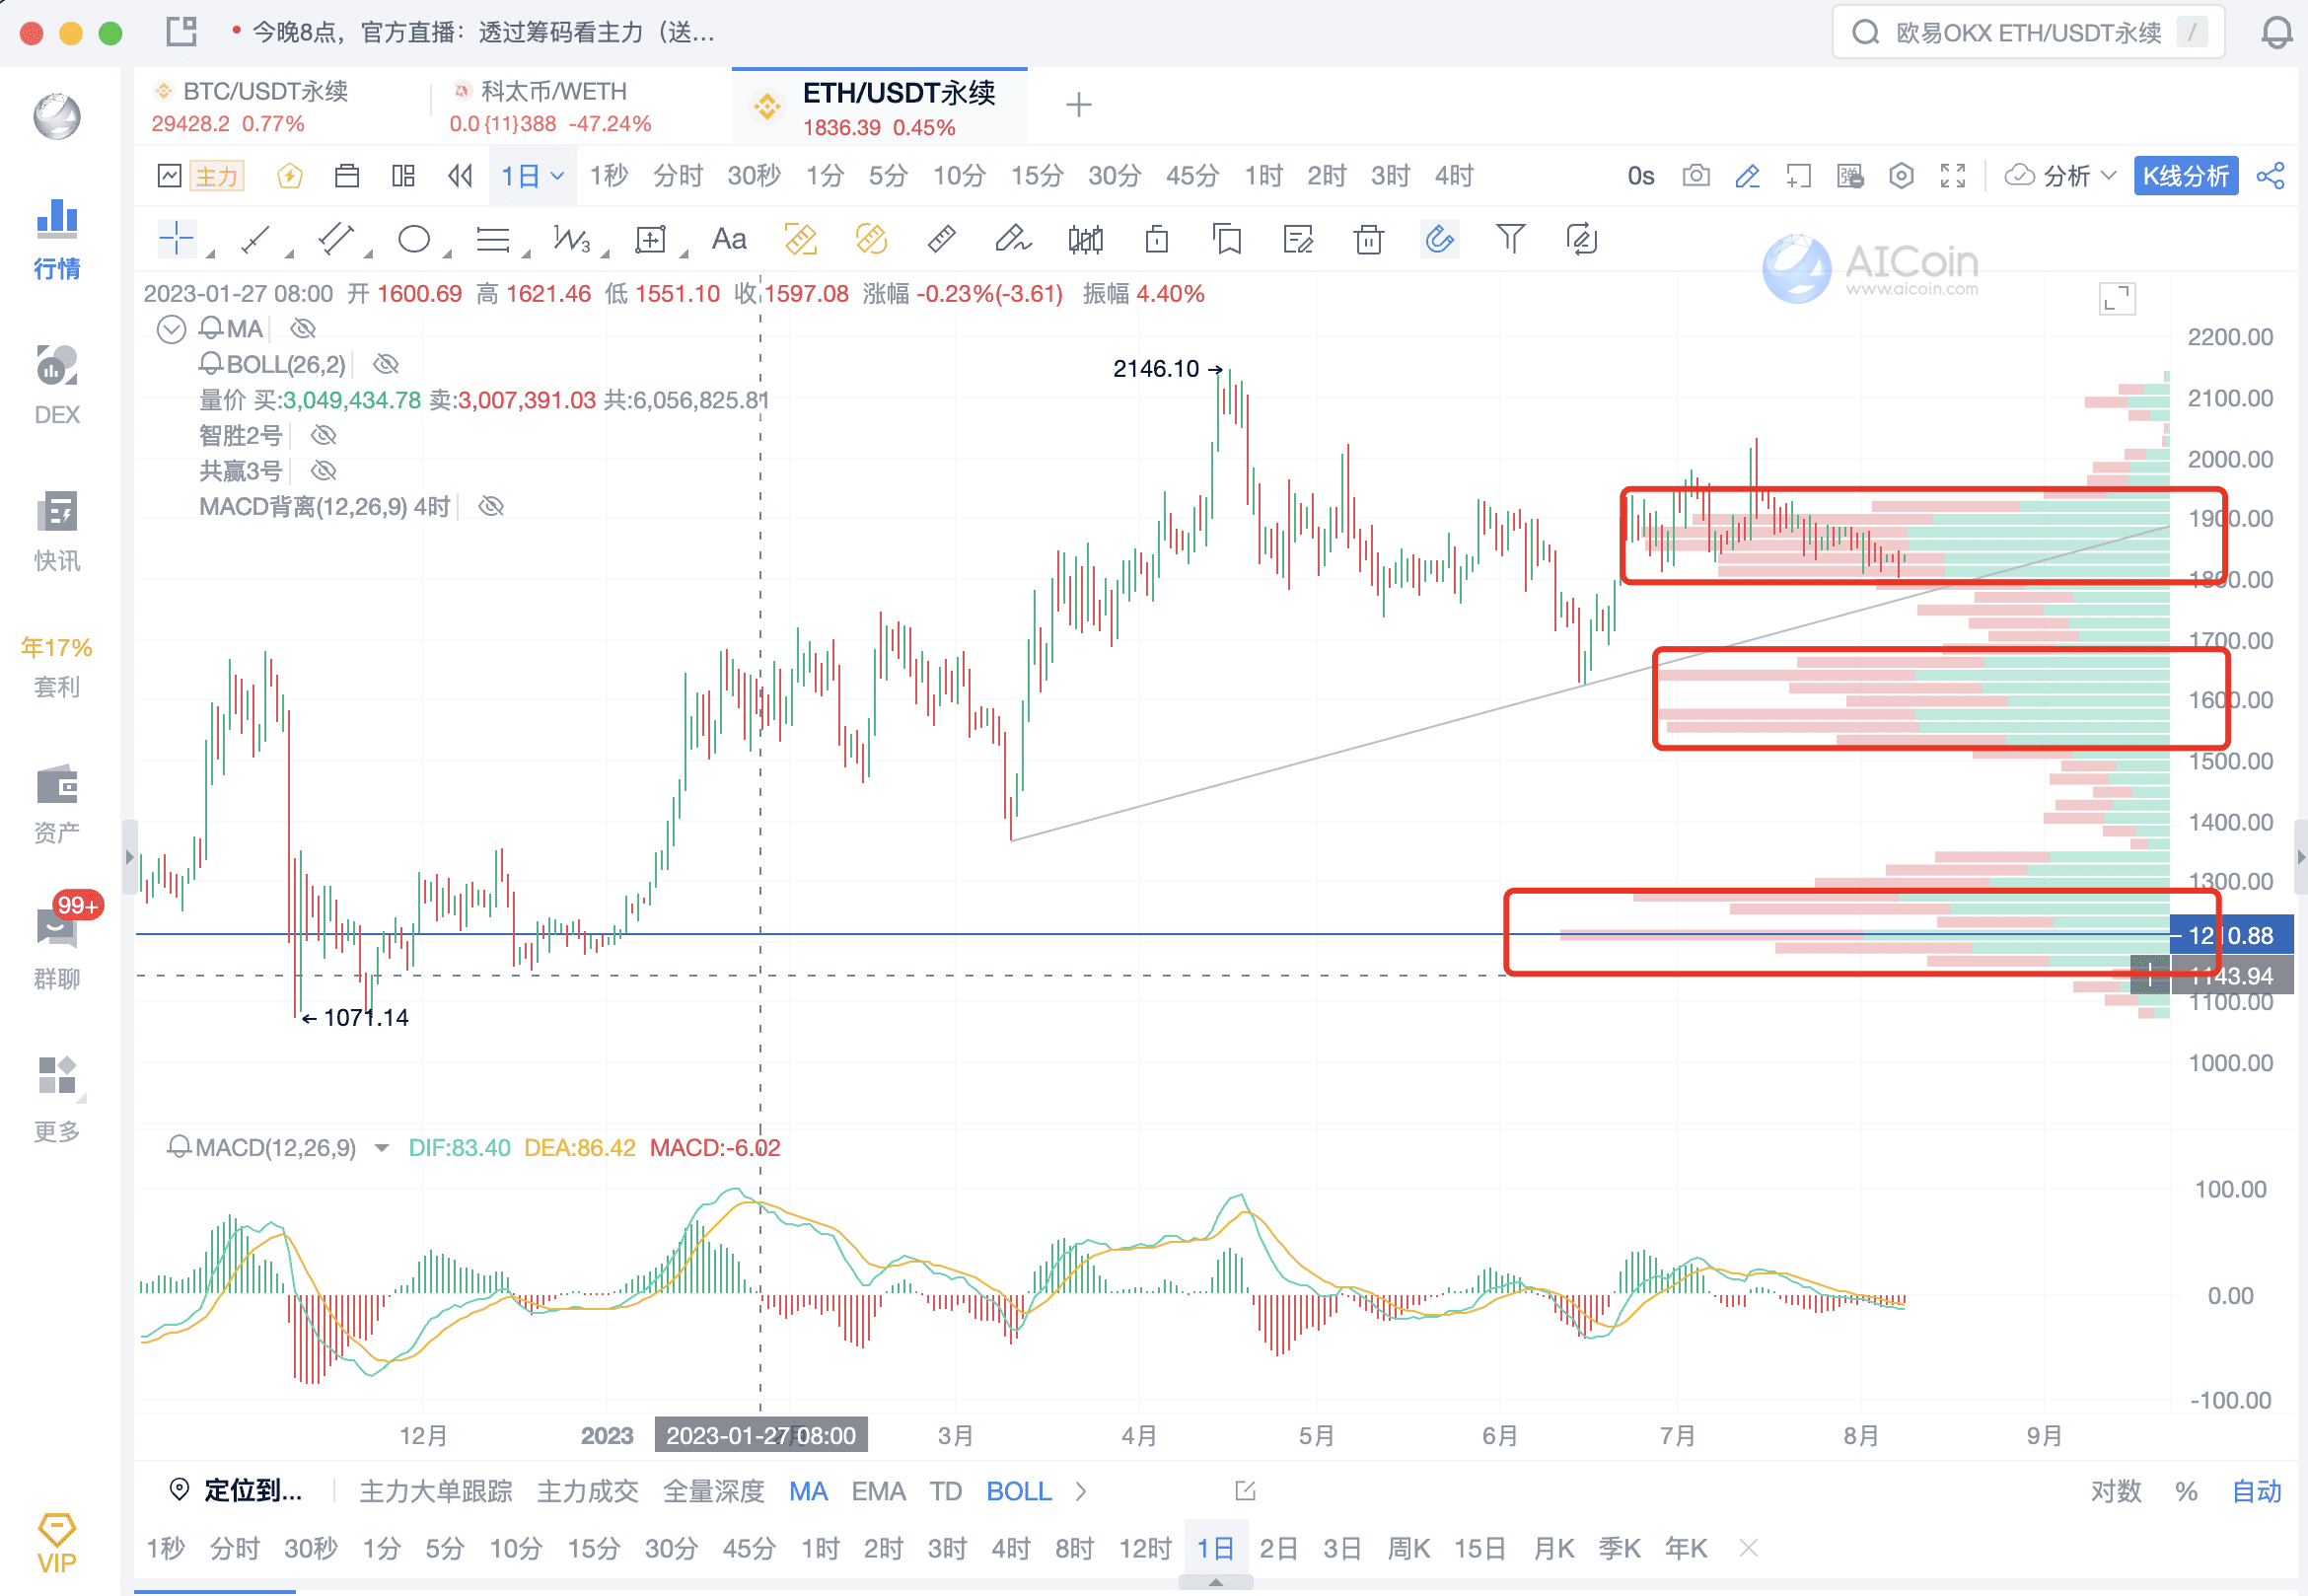
Note: On the daily chart, the appearance of 3 chip peaks indicates the situation of related price levels of support and resistance.
(3) Concept of chip distribution
① Chip distribution will have an average cost line
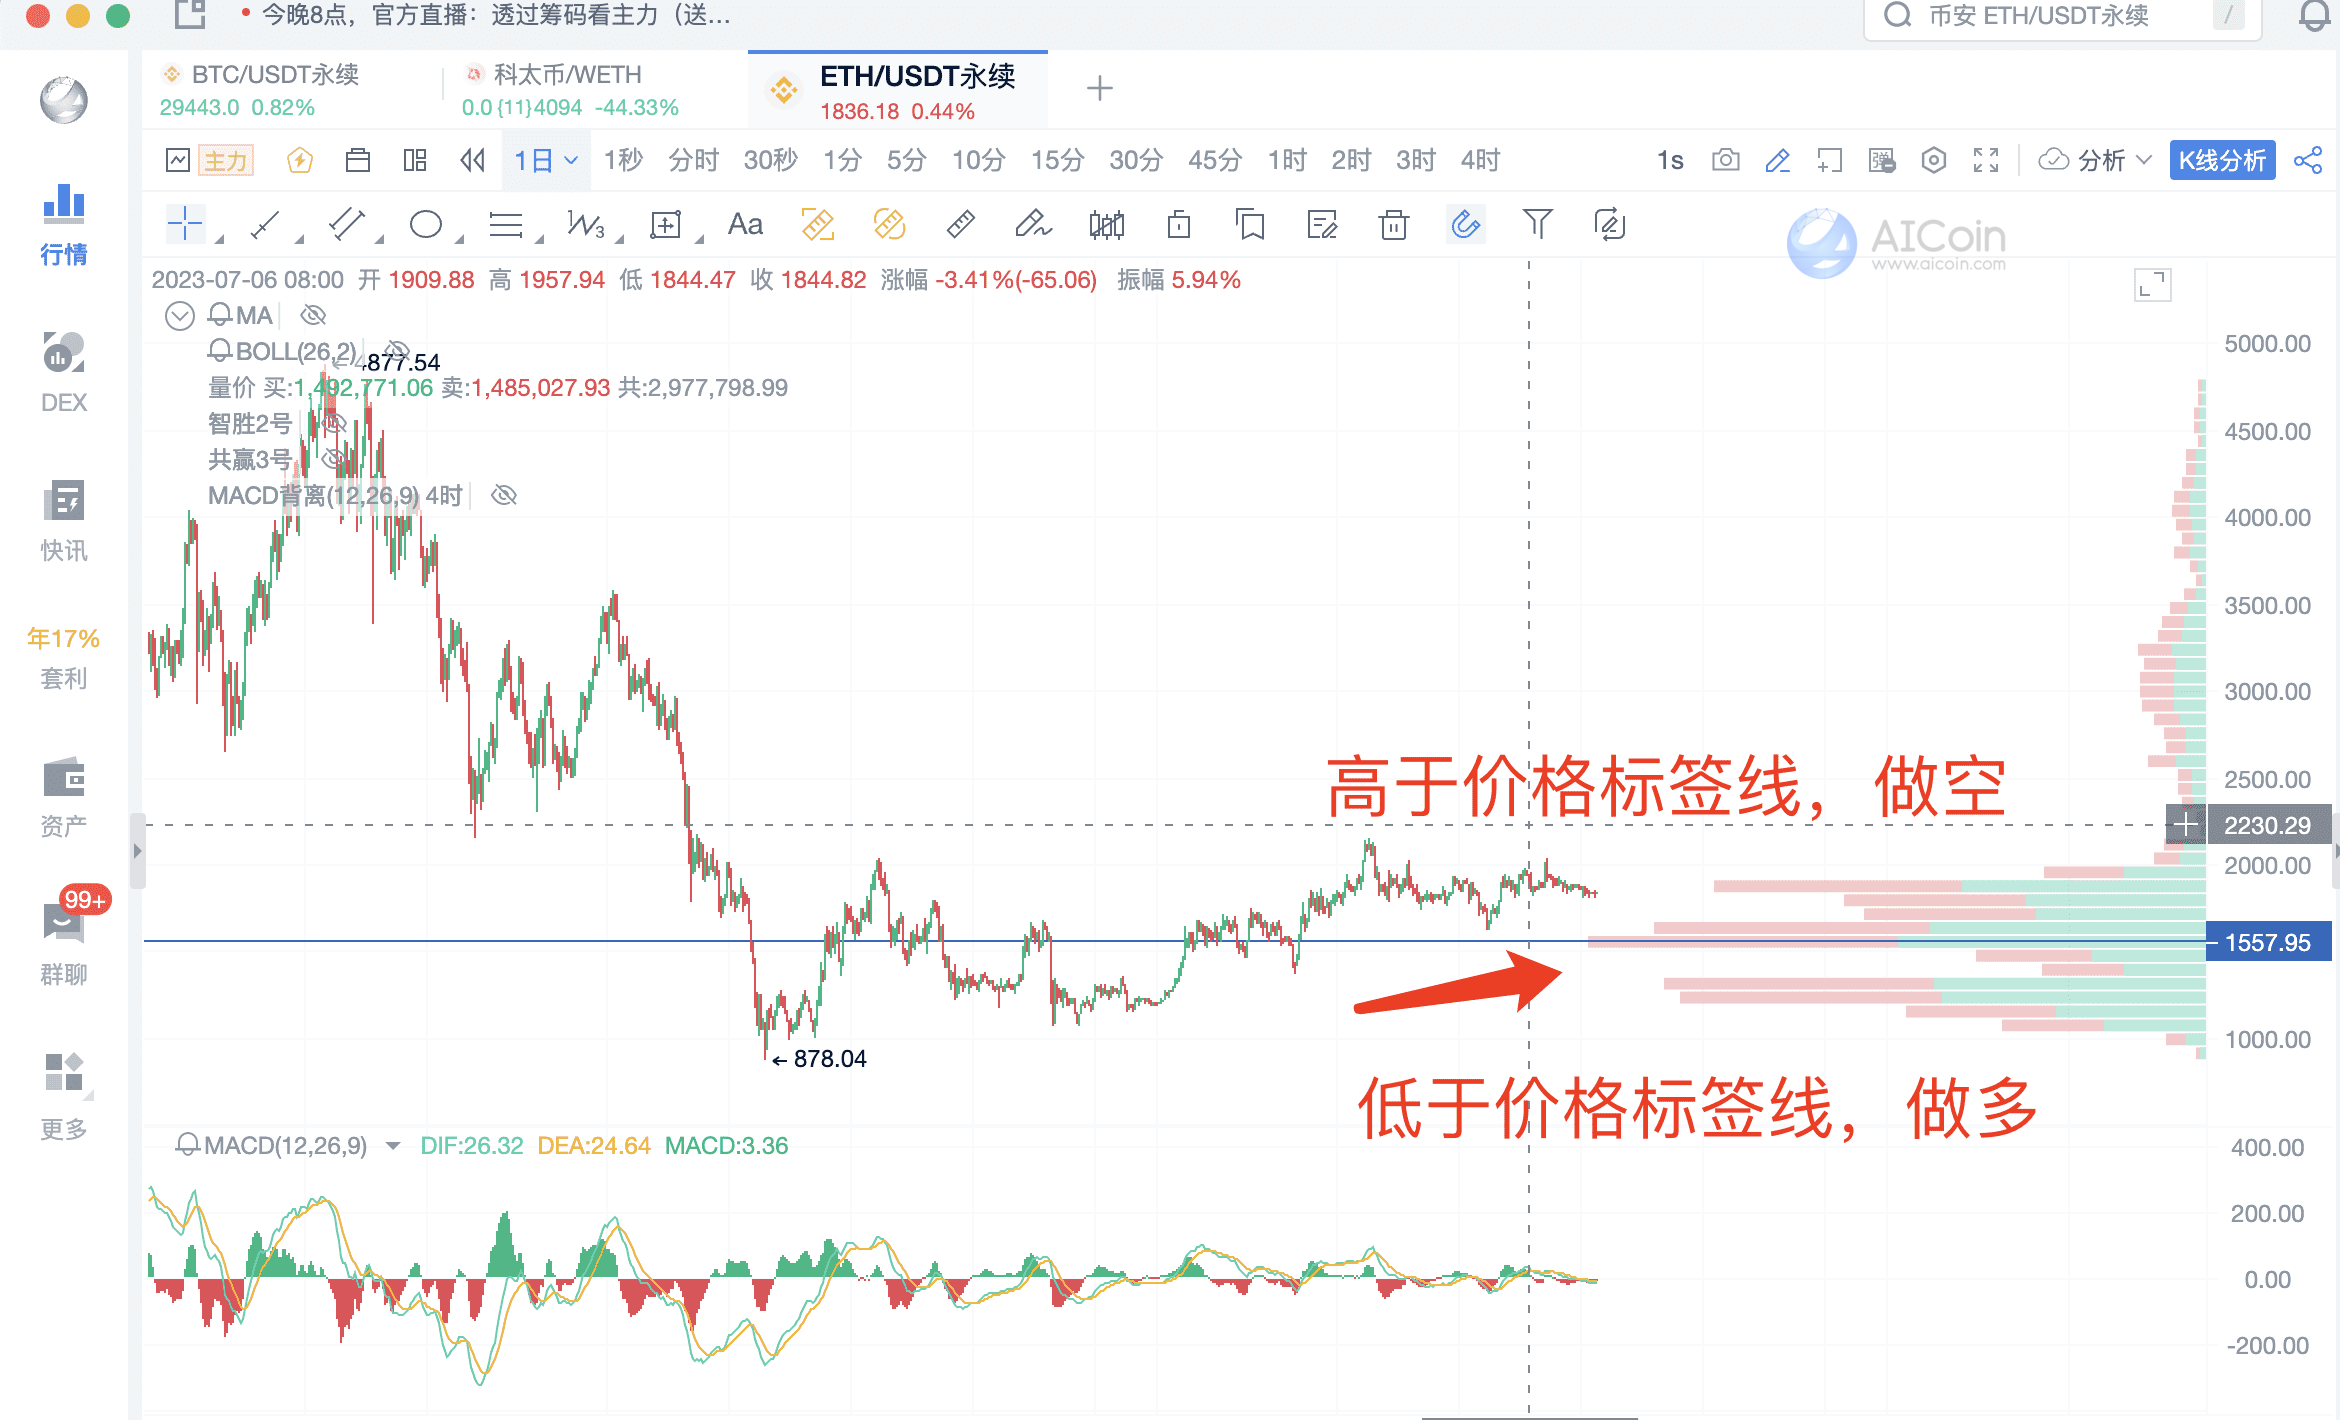
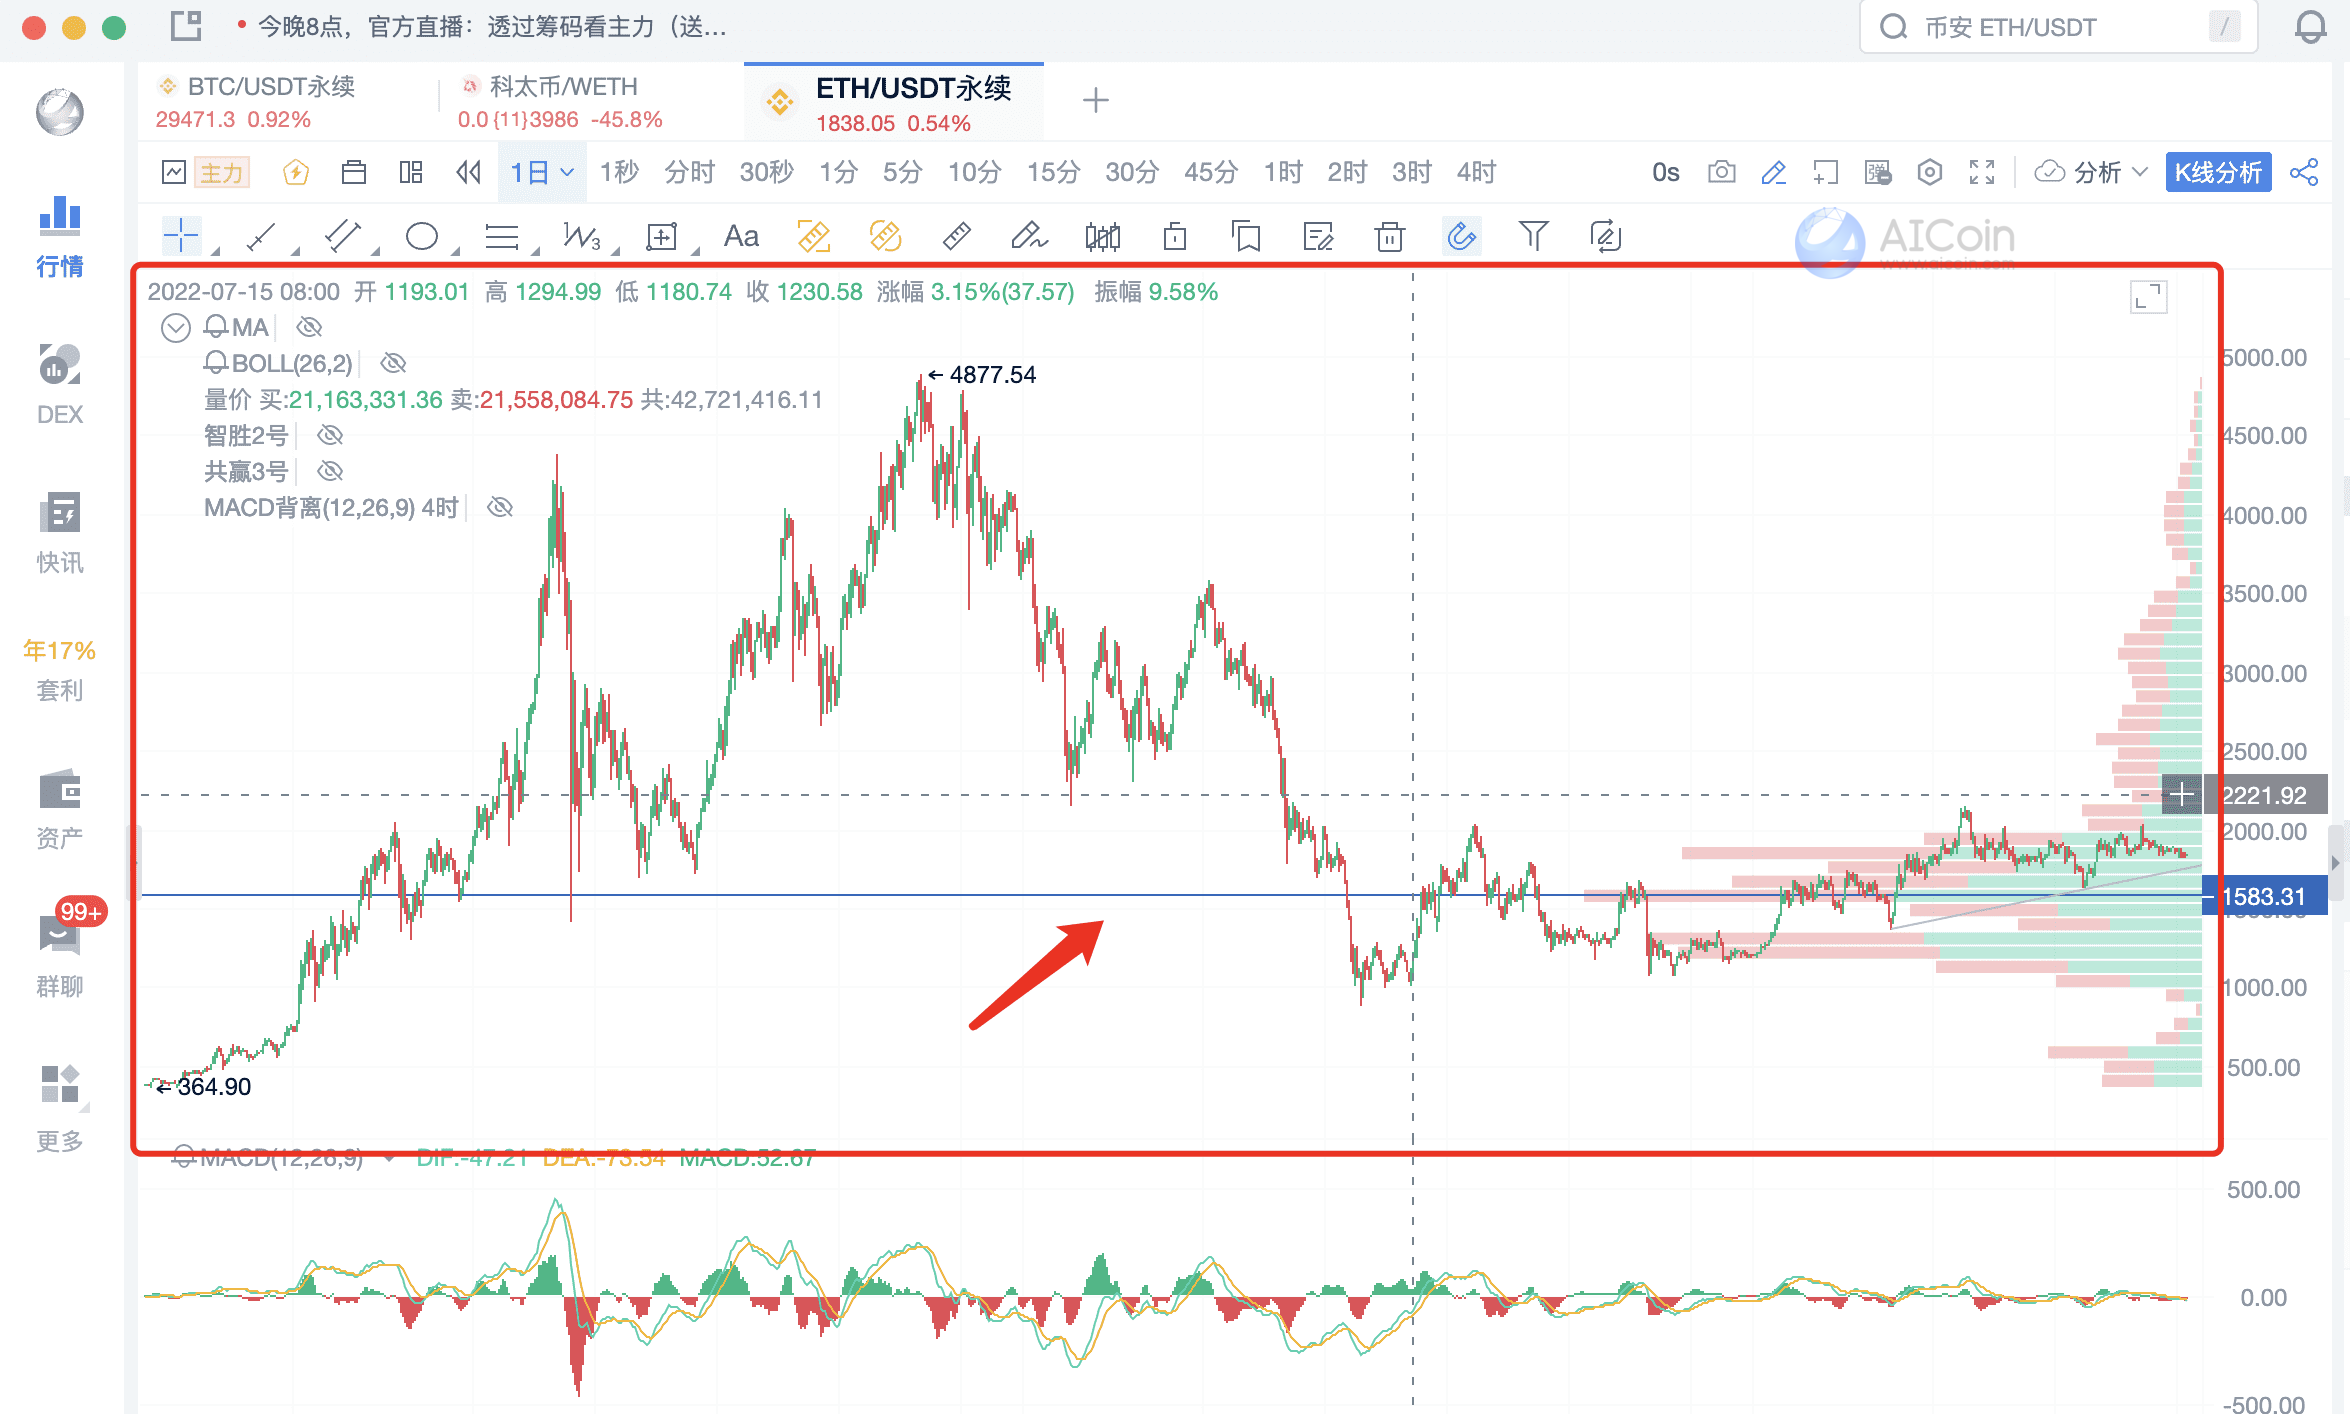
② Chip distribution will have profit-taking and trapped positions
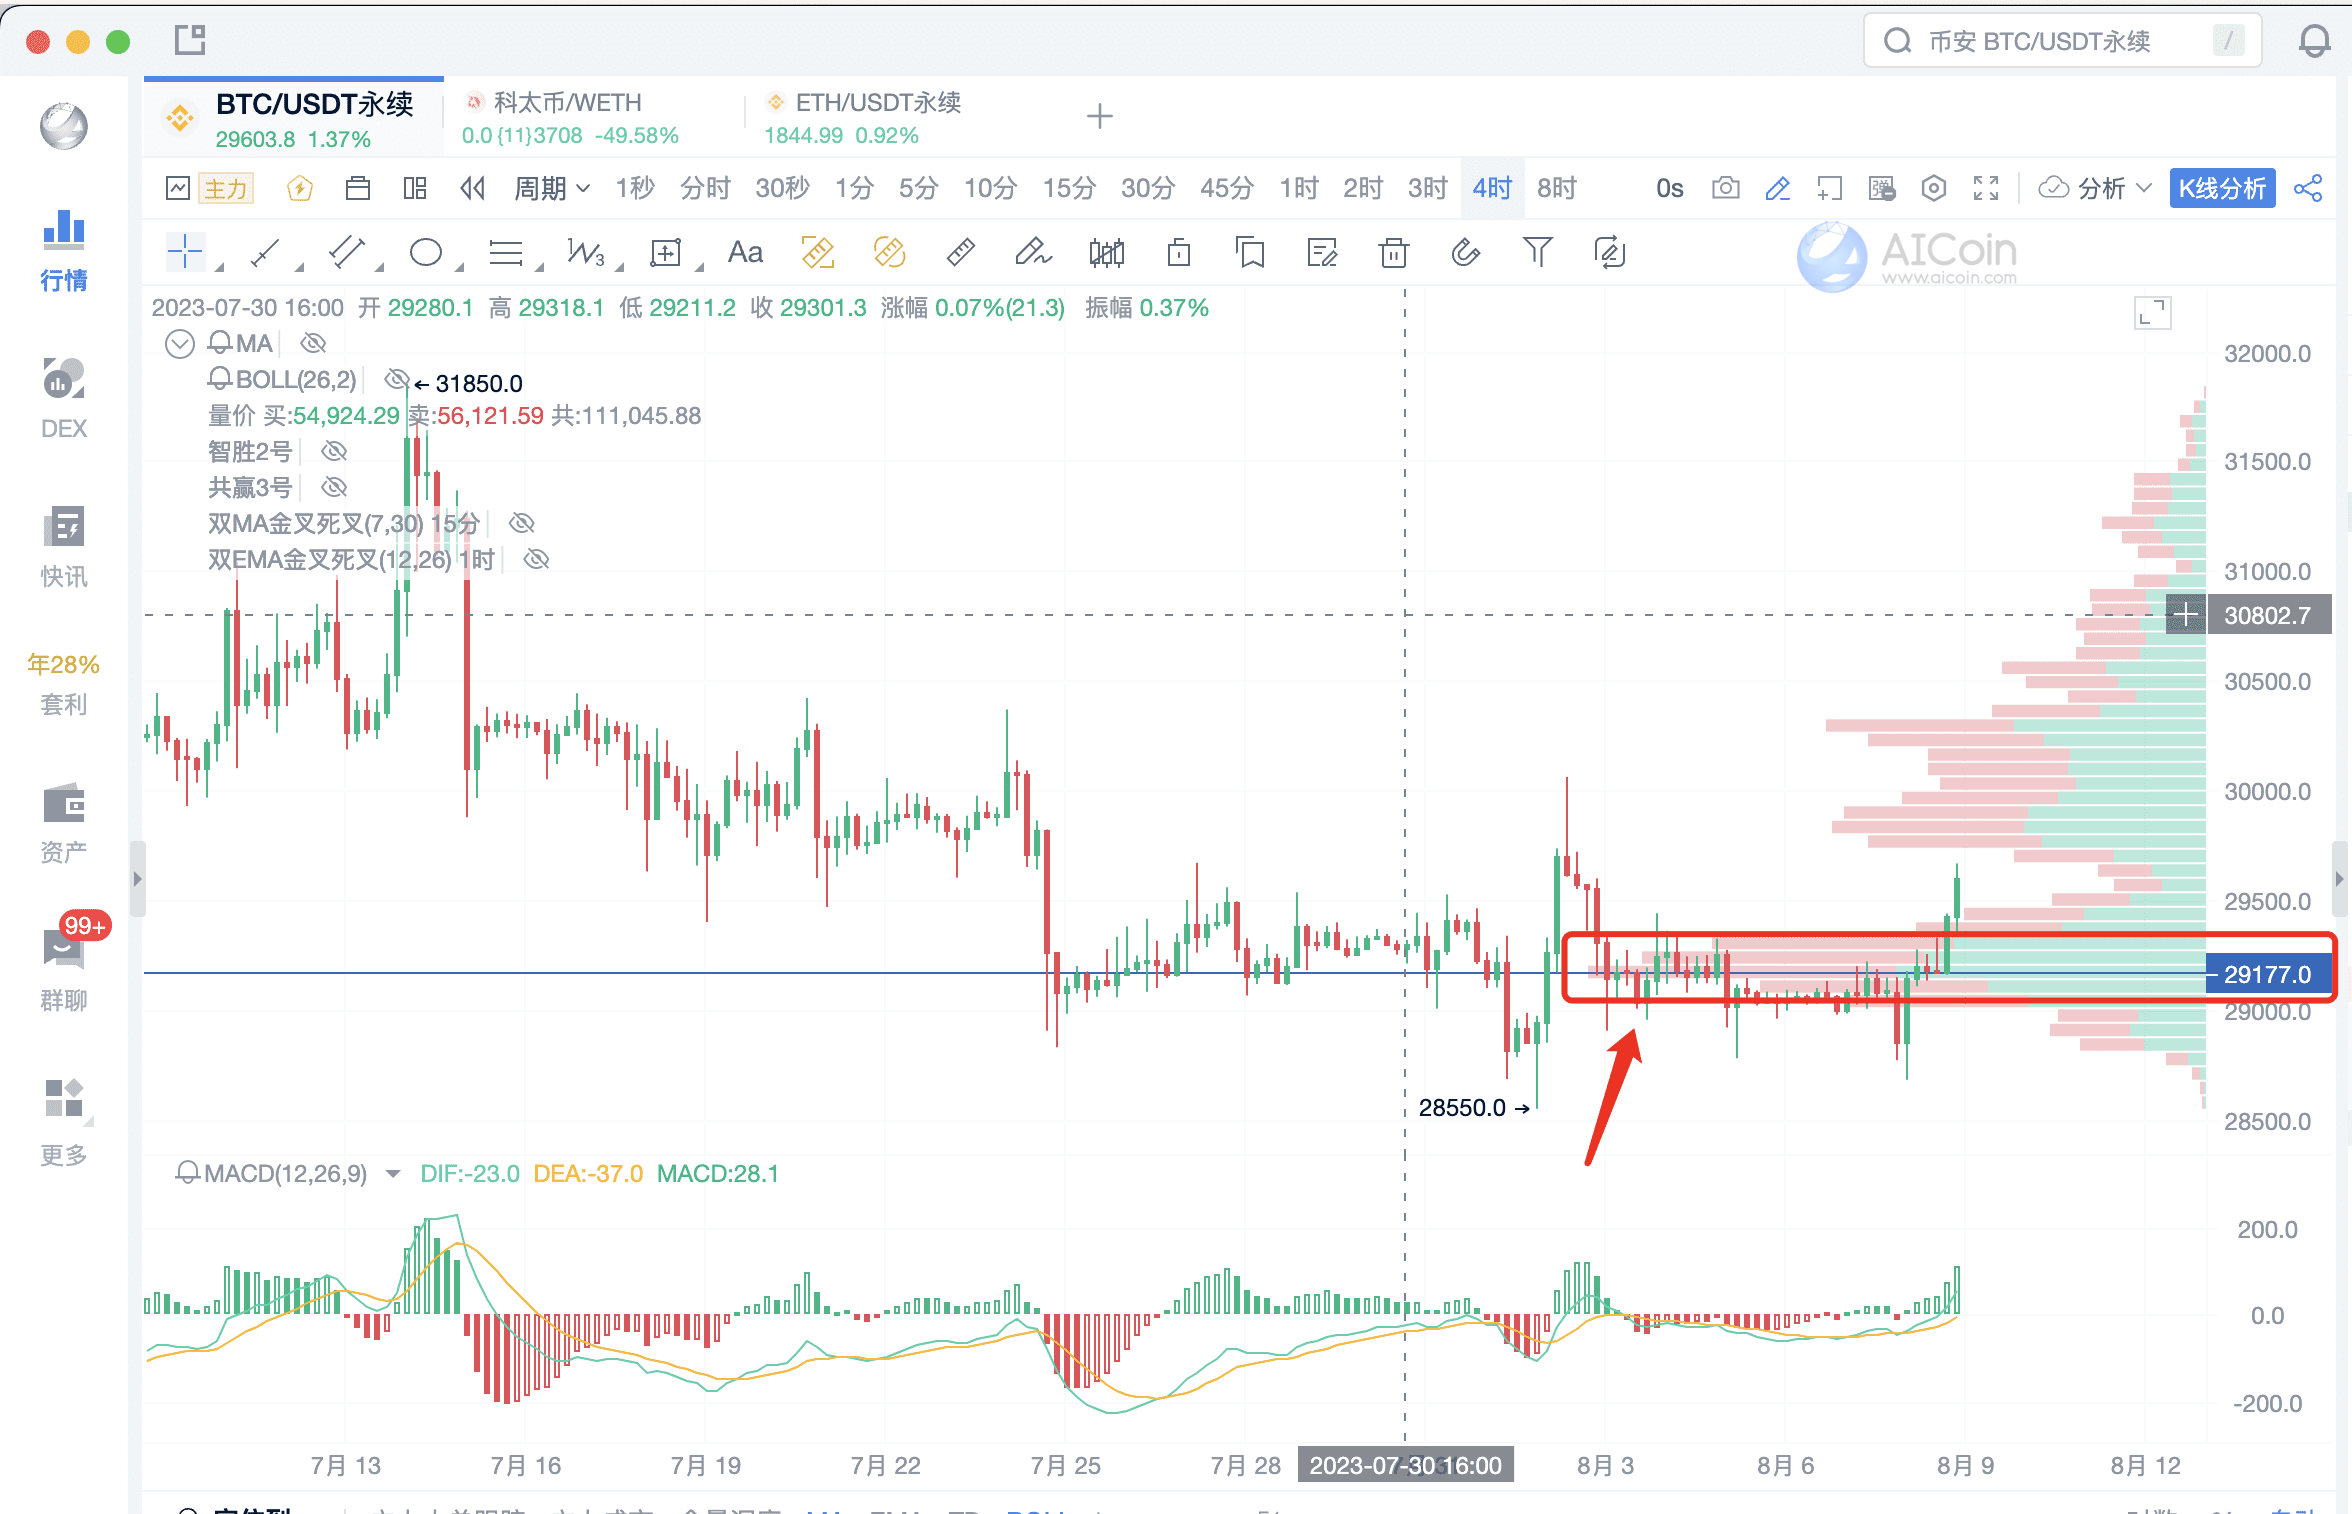
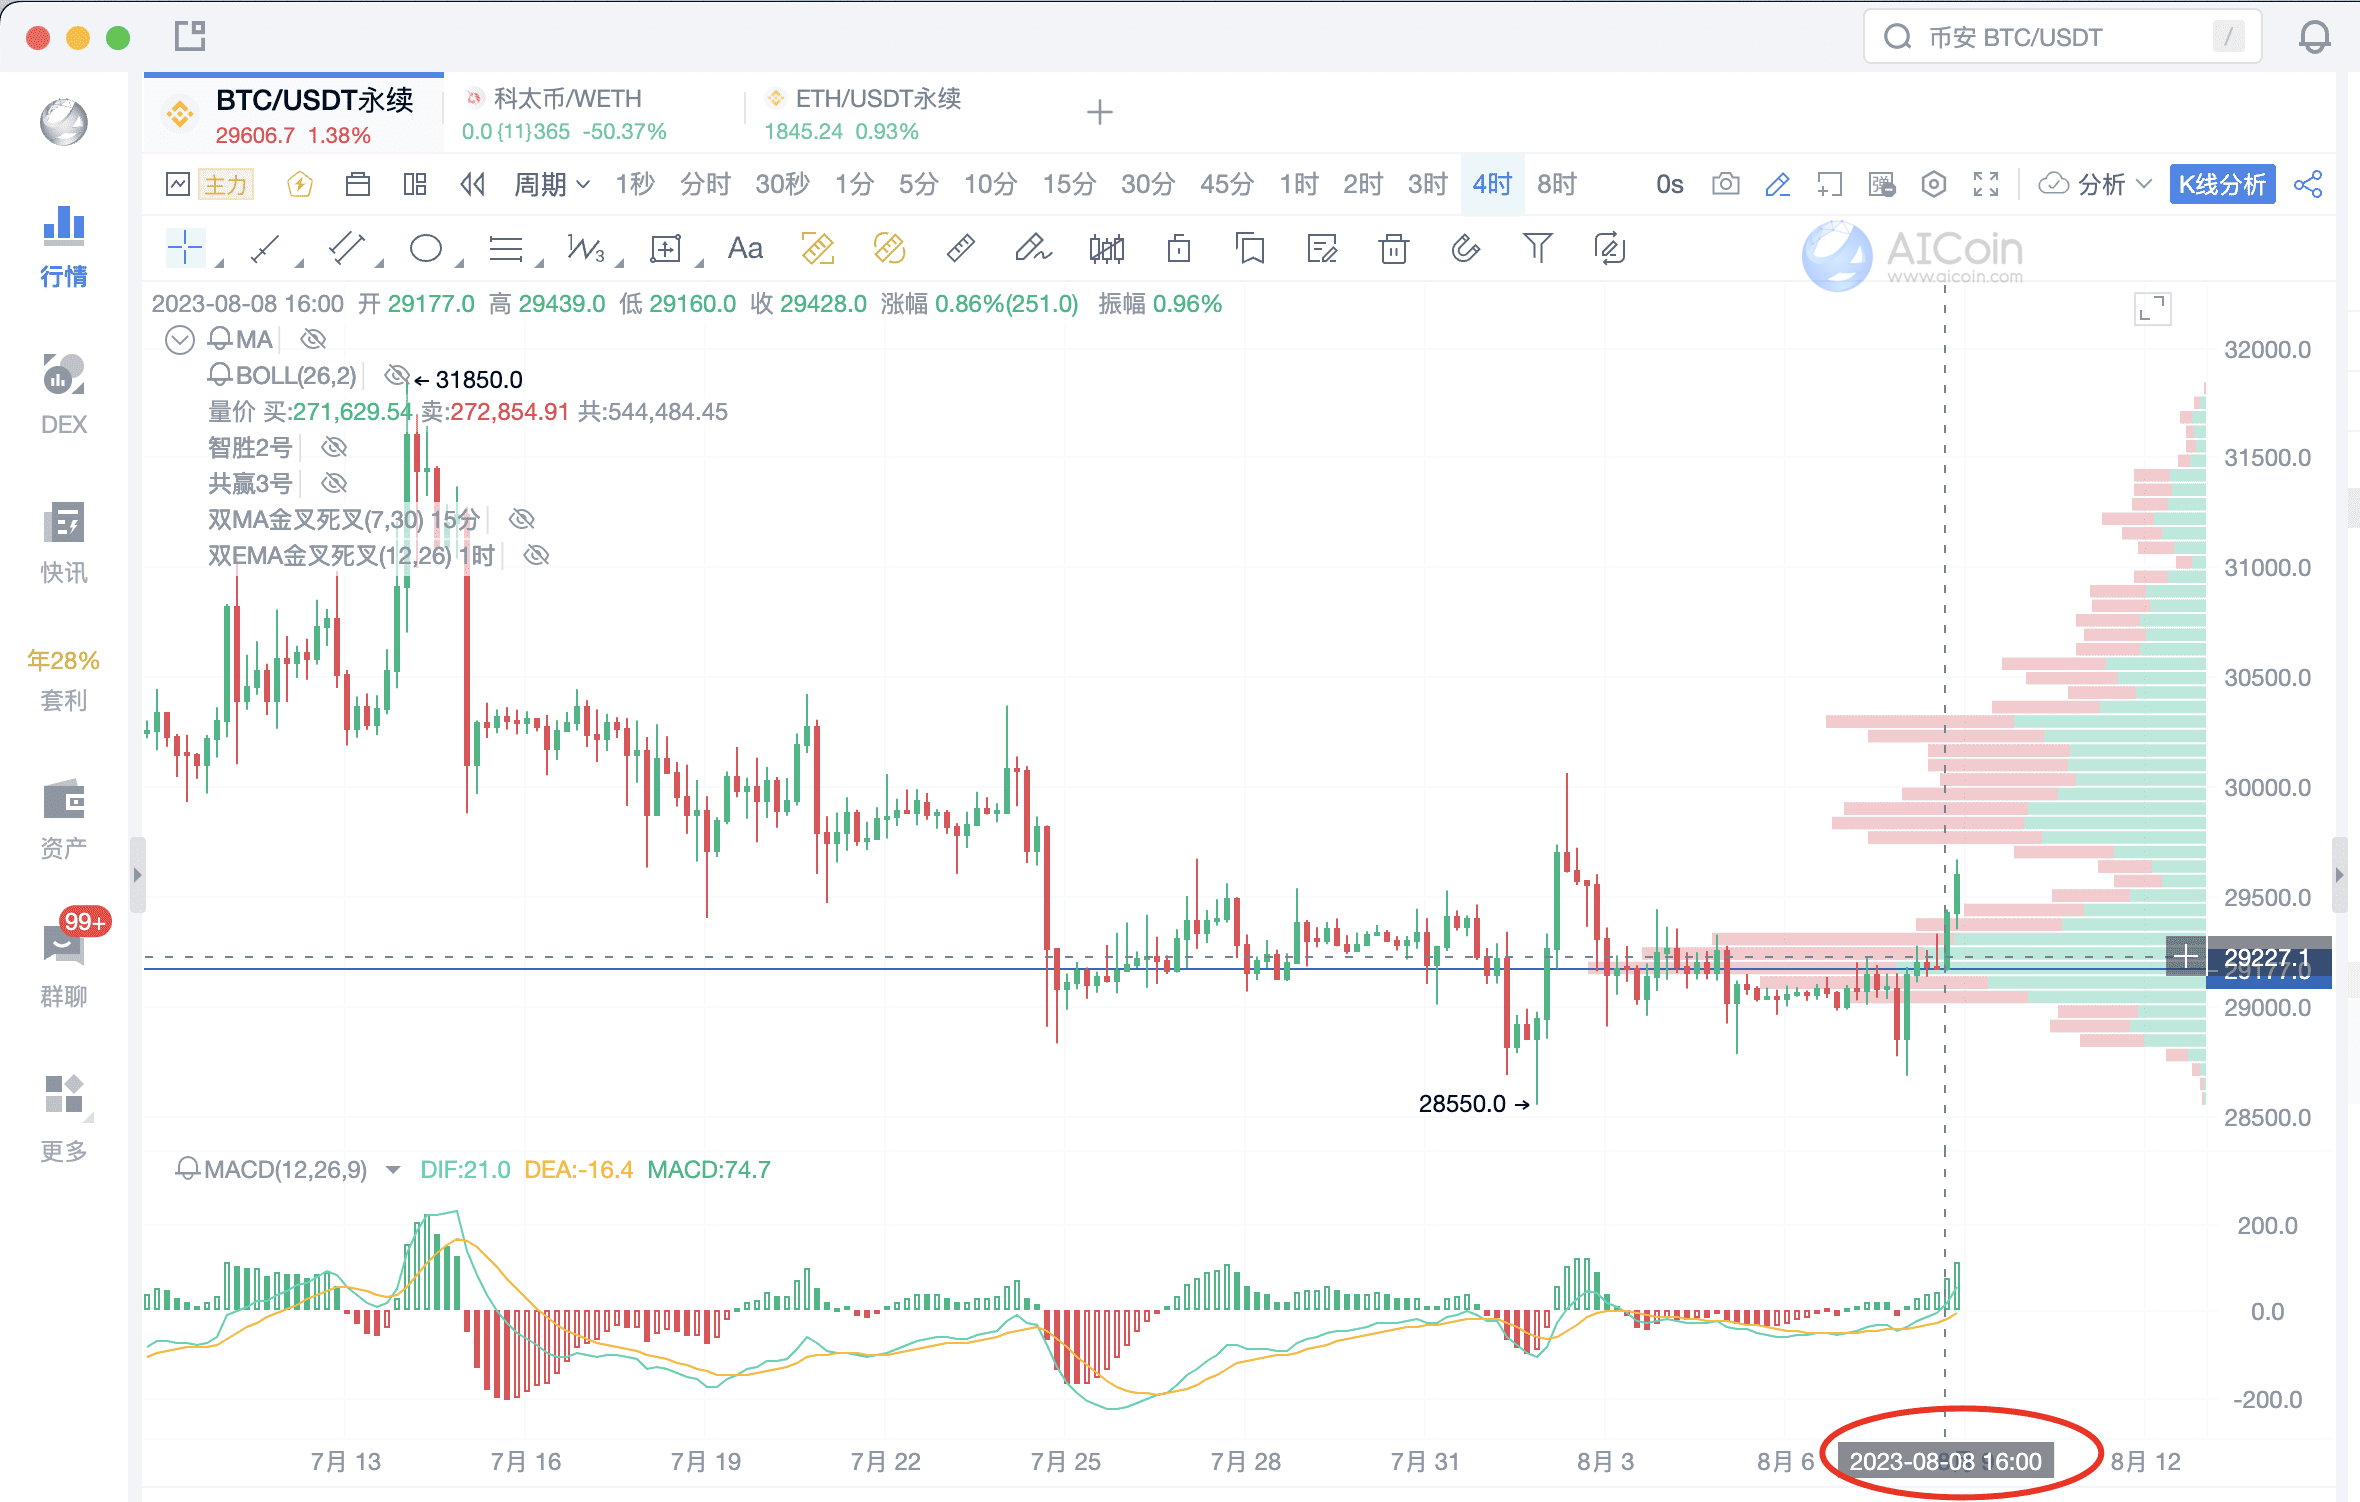
Chip peaks can serve as support and resistance levels. Generally, the focus is on the longest one in the dense range. Once the longest chip peak is broken, it is suitable for medium to long-term buying operations; the relevant low-level chip peaks then serve as support levels.
Example: BTC/USDT perpetual, 4h
Low-level chip peak
Breakthrough at 16 points
The next resistance level is around 29891
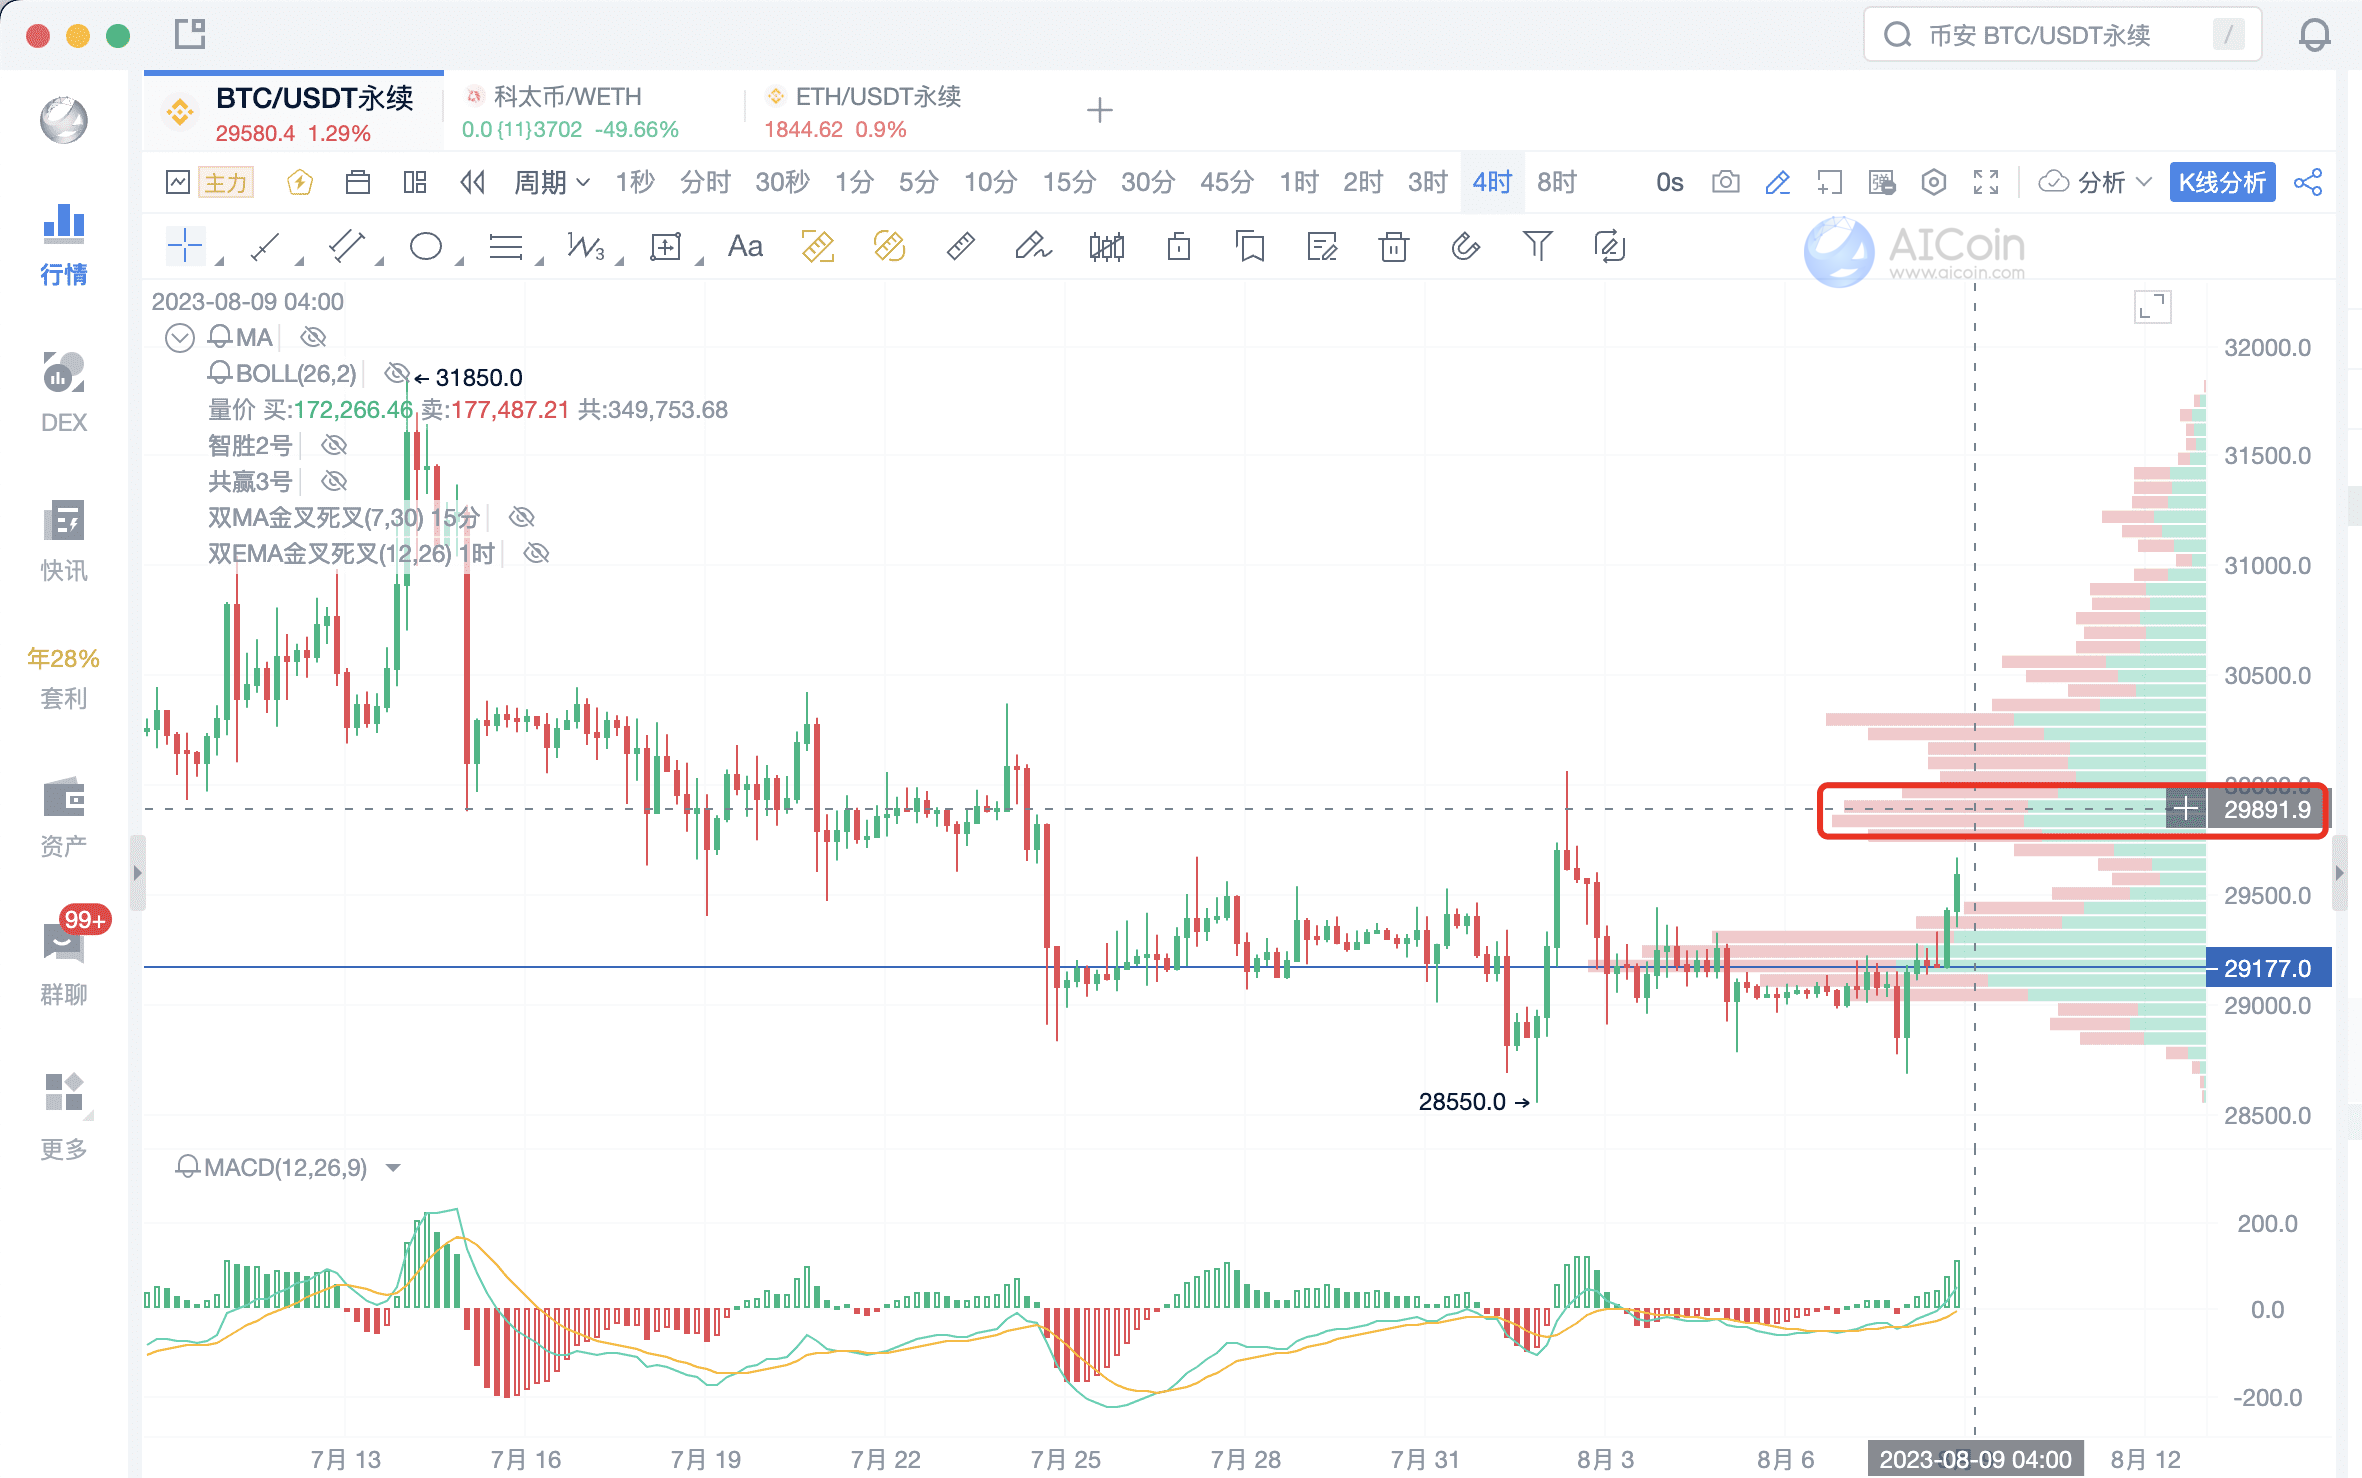
Note: The price tag line is also the average cost line (control point).
4. Recommended Tool: Major Single Order Screening List
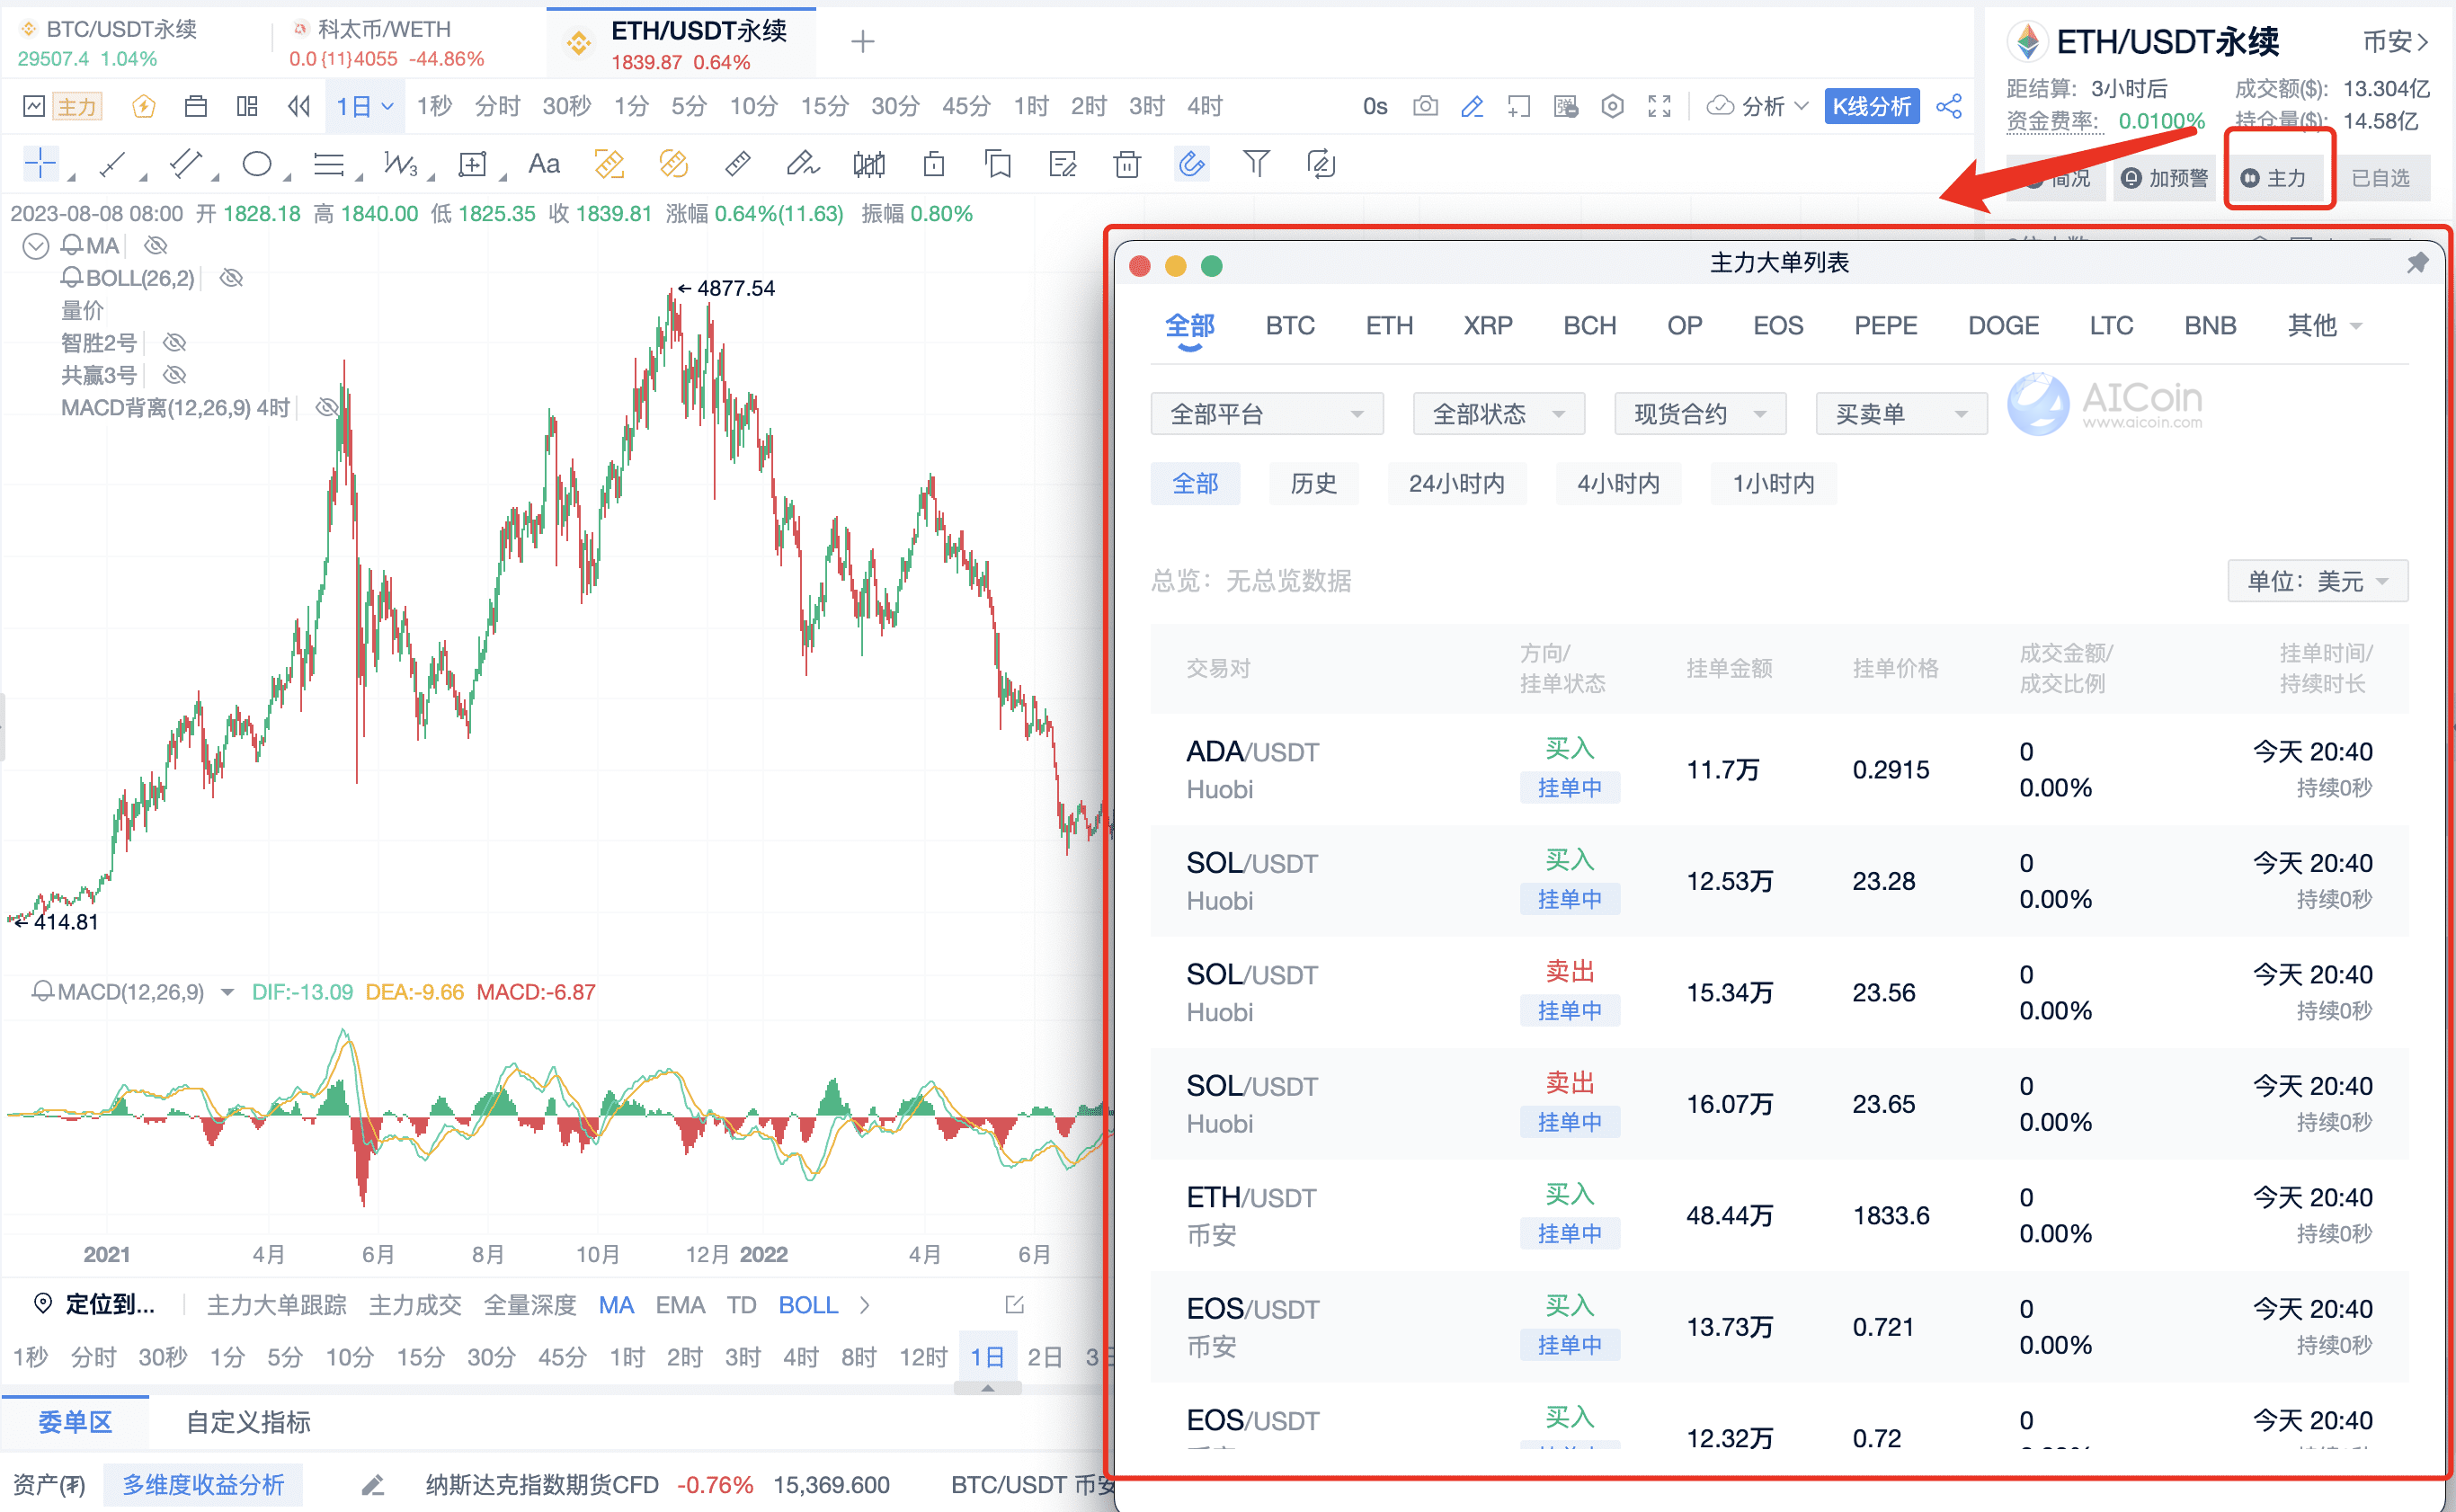
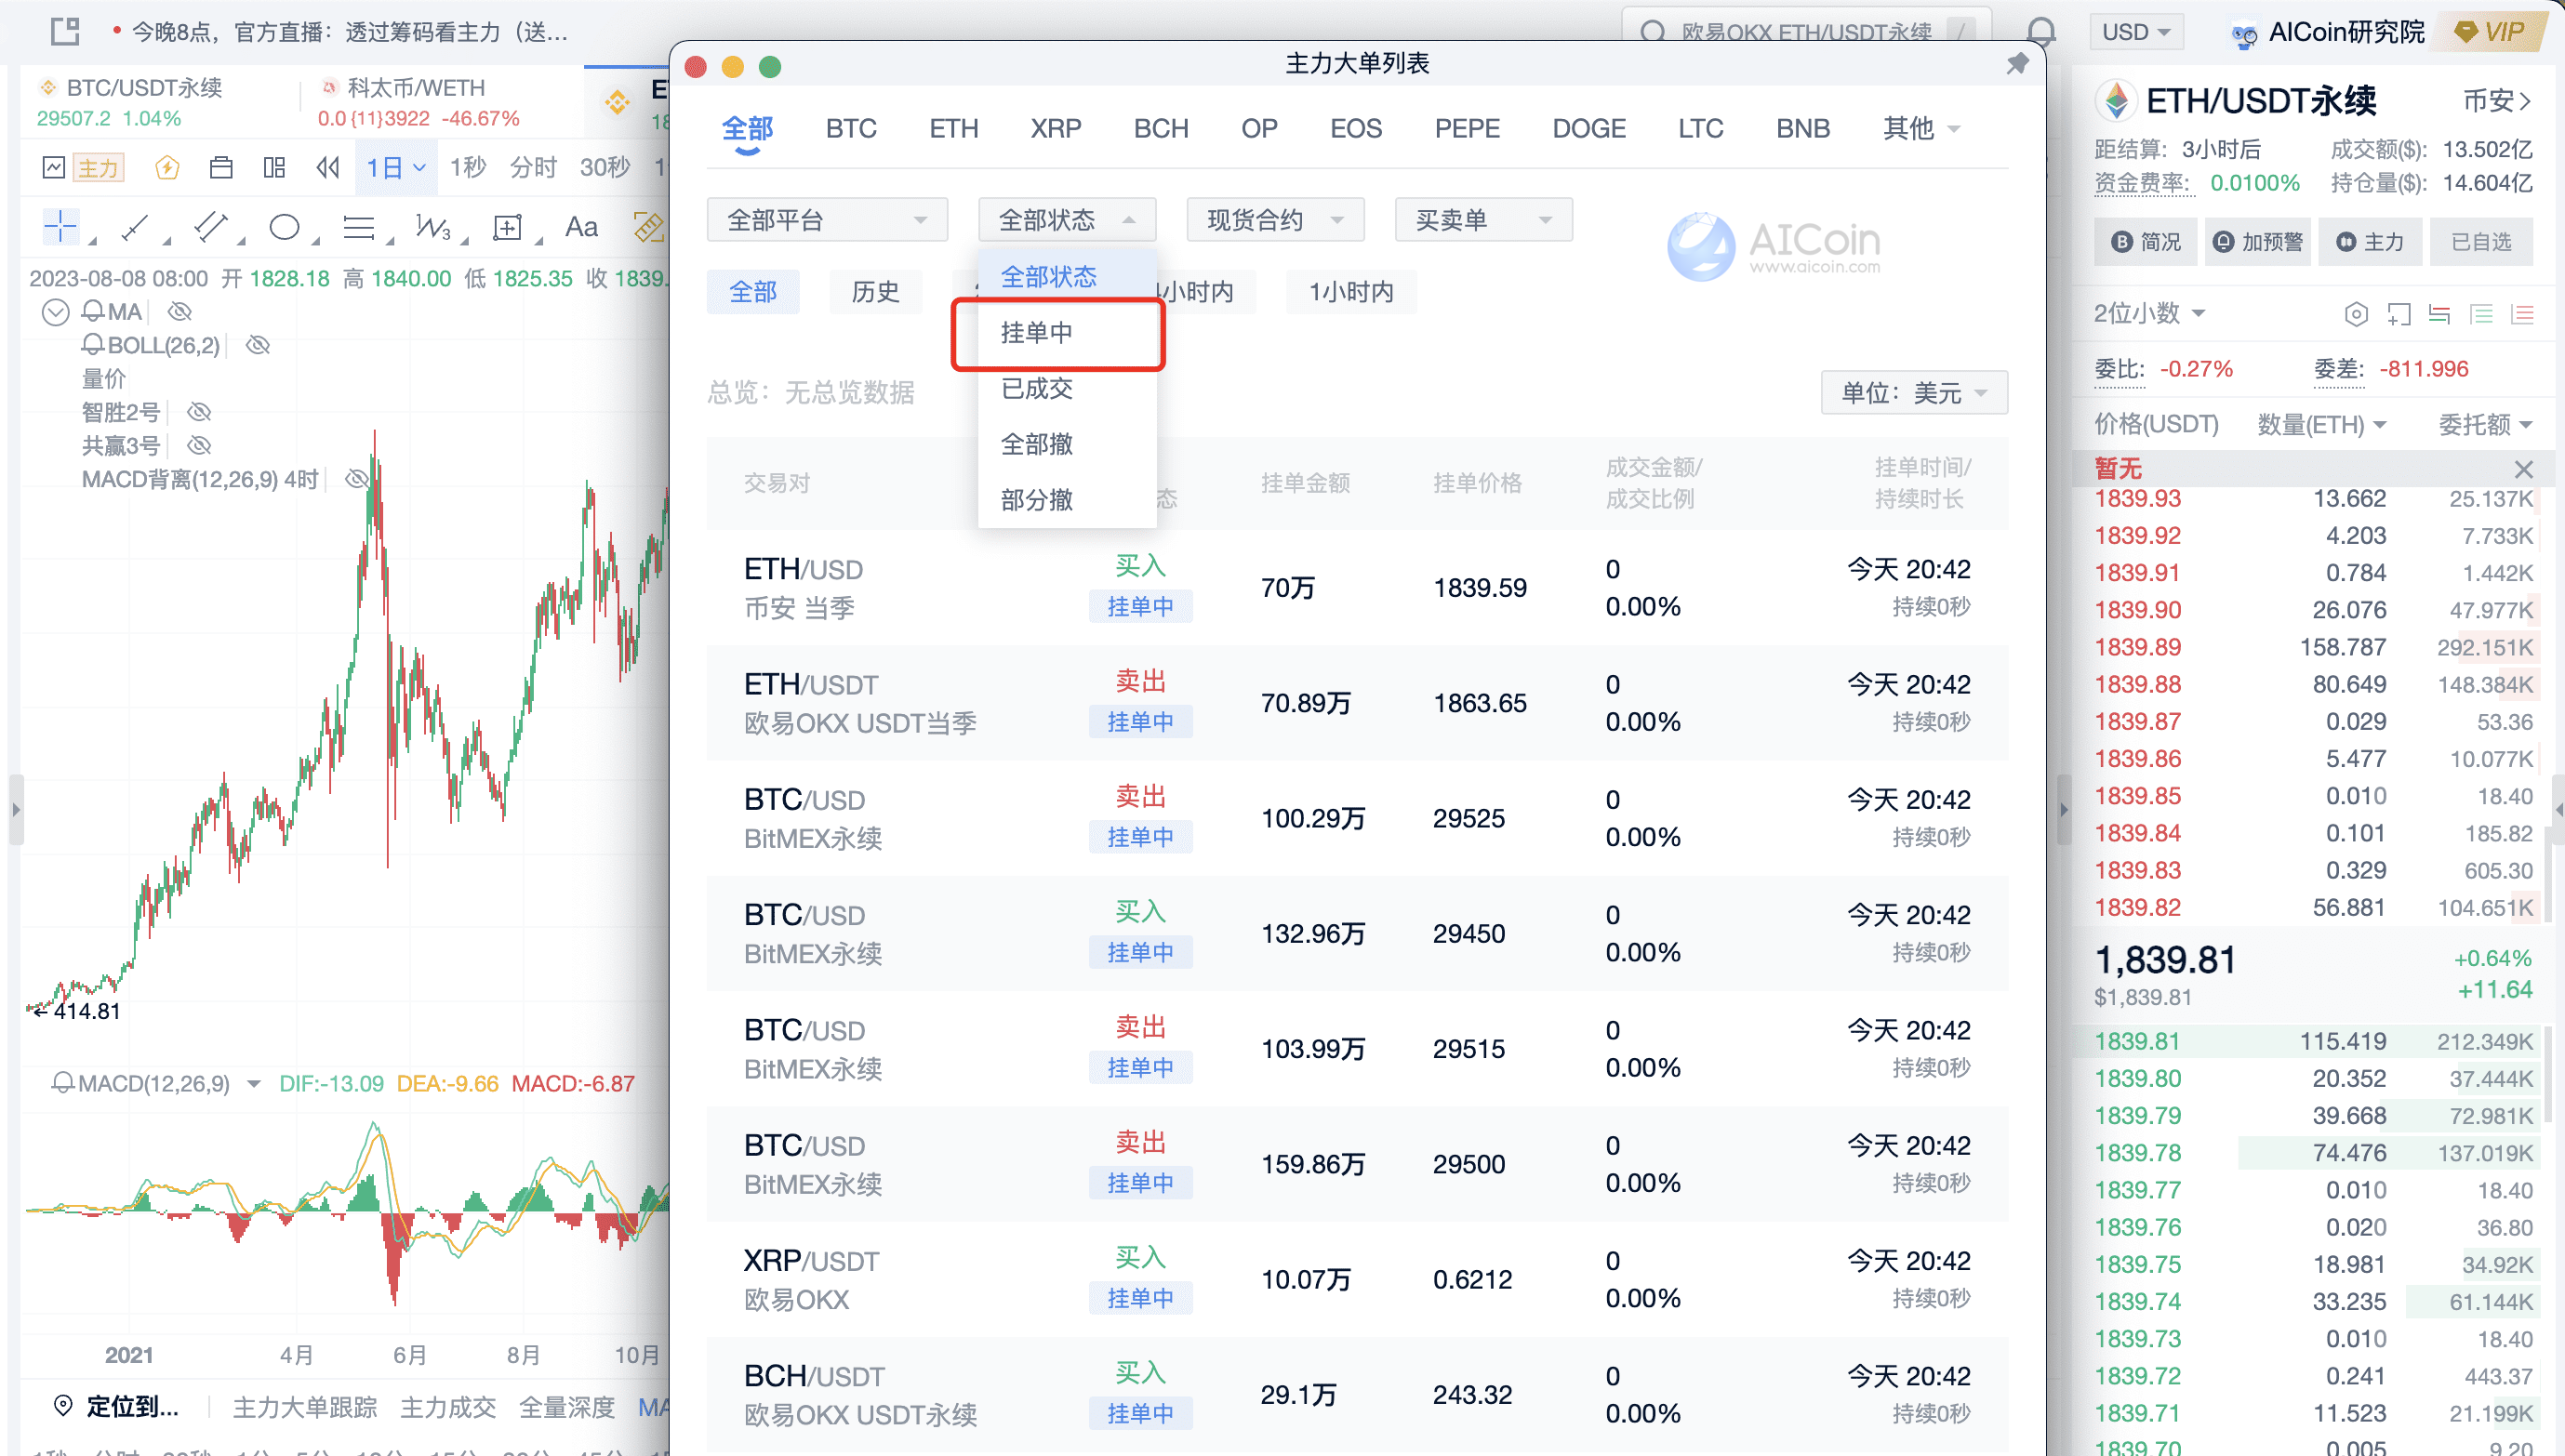
Note that the concept of reversing operations when a super large single order appears is incorrect.
① Large sell orders with a transaction level of tens of millions are generally bearish
② If there are still super large sell walls above that have not been executed, it may continue to lead the price to rise, consume the corresponding large sell orders, form larger-scale transaction orders, and then look for a decline.
By becoming a Pro member, you can view the volume-price distribution chart and screen for major single orders: https://aicoin.app/zh-CN/vip/chartpro
Recommended Reading
For more live content, please follow AICoin's "News/Information-Live Review" section, and feel free to download AICoin PC-end.
免责声明:本文章仅代表作者个人观点,不代表本平台的立场和观点。本文章仅供信息分享,不构成对任何人的任何投资建议。用户与作者之间的任何争议,与本平台无关。如网页中刊载的文章或图片涉及侵权,请提供相关的权利证明和身份证明发送邮件到support@aicoin.com,本平台相关工作人员将会进行核查。


