When ETH is at its peak price-to-earnings ratio, buy, and sell when it is at its lowest. Buy when ETH is at its highest valuation multiple, and sell when it is at its lowest.
Written by: SAM ANDREW
Translated by: Deep Tide TechFlow
Ethereum has the characteristics of a productive asset, capable of generating profits that accrue to token holders. But is it considered a productive asset like stocks? Does the valuation multiple of Ethereum affect its price?
The valuation multiple is a heuristic method for evaluating asset value. Google's price-to-earnings ratio is 30x. Nvidia's price-to-earnings ratio is 230x. If Google's current earnings continue for 30 years, it would take 30 years to recoup the investment in Google. If Google's earnings grow, the required years would be fewer. Compared to Nvidia, Google has a lower valuation. Price valuation, such as the difference between 30x and 230x, is not the sole driver of investment returns, but it is an important factor. Expensive assets like Nvidia imply high growth expectations in their current valuation multiples. If they fail to meet these high expectations, the price will plummet.
Similar valuation multiples can also be applied to cryptocurrencies. Market cap divided by total fees is a valuation multiple for cryptocurrencies. Market cap represents the current market's view of the asset's value. Fees are the total revenue generated by the protocol. Blockchain revenue is similar to the profits distributed throughout the network. Therefore, blockchain revenue and earnings multiples are the same.
What is Ethereum's valuation multiple?
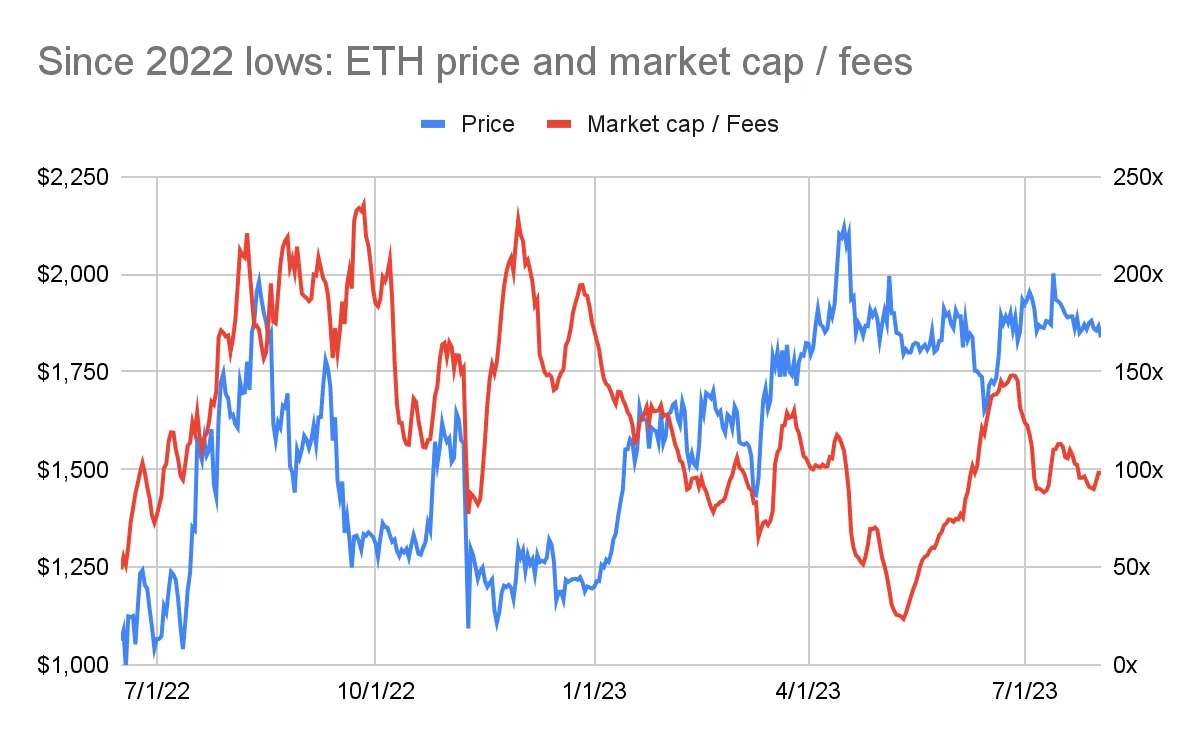
Ethereum's current trading valuation is 100 times its seven-day annualized fee. Since the summer of 2022, Ethereum's fee multiples have fluctuated between 25x and 235x (see the chart below: ETH price and market cap/fees since the 2022 low).
Unexpected Relationship
The chart above shows an inverse relationship between Ethereum's price and valuation multiples. The best time to buy Ethereum was at the end of 2022 when the price was around $1200. However, at that time, Ethereum's valuation multiple was higher, reaching 200 times the fee. By the spring of 2023, Ethereum's price approached $2000, but its fee multiple dropped to 50-100 times.
The inverse relationship between price and valuation multiples is unexpected. Typically, when an asset's valuation multiple is low, it is more attractive for investment. Multiples are usually lower before assets reach a turning point. The market realizes the asset is undervalued. Prices start to rise, and valuation multiples also increase.
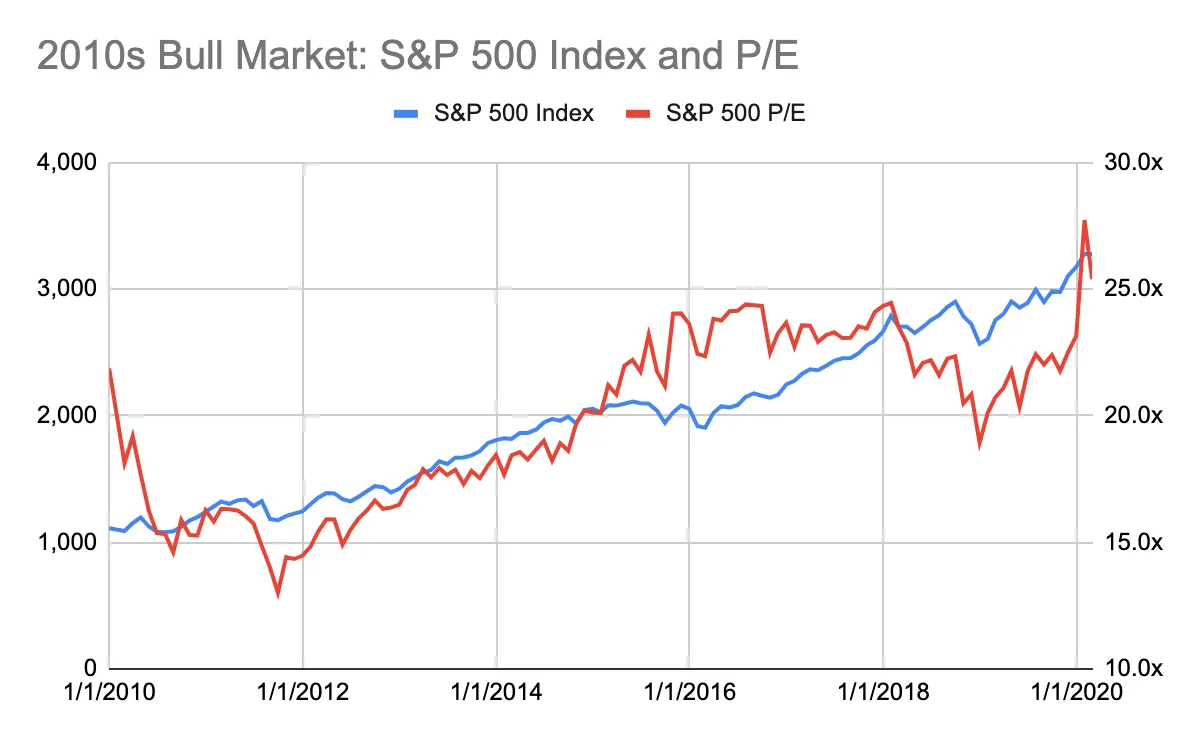
The chart below (2010s bull market: S&P 500 index and price-to-earnings ratio) illustrates the general relationship between price and multiples. It describes the bull market in the US stock market before the outbreak of the COVID-19 pandemic. At the beginning of the decade, the S&P 500 index's price-to-earnings ratio was around 15x. The average price-to-earnings ratio for the S&P 500 index since 1928 is 18x, and since 2000 is 26x. In 2011, the US emerged from the global financial crisis, and interest rates approached historic lows, marking a turning point. Subsequently, prices and multiples began to rise steadily.
So, what can we infer from Ethereum's multiples?
Do Ethereum's multiples indicate whether ETH is "cheap" or "expensive"?
How does "cheap" or "expensive" translate into ETH's price performance? Is this a good indicator for buying opportunities, similar to the stock market?
These questions can be answered by analyzing historical data.
In the past five years, ETH's price has risen from $10 to over $4000. This 400x price change makes it difficult to observe the relationship in a single chart. Instead, we can highlight different periods to illustrate the trends.
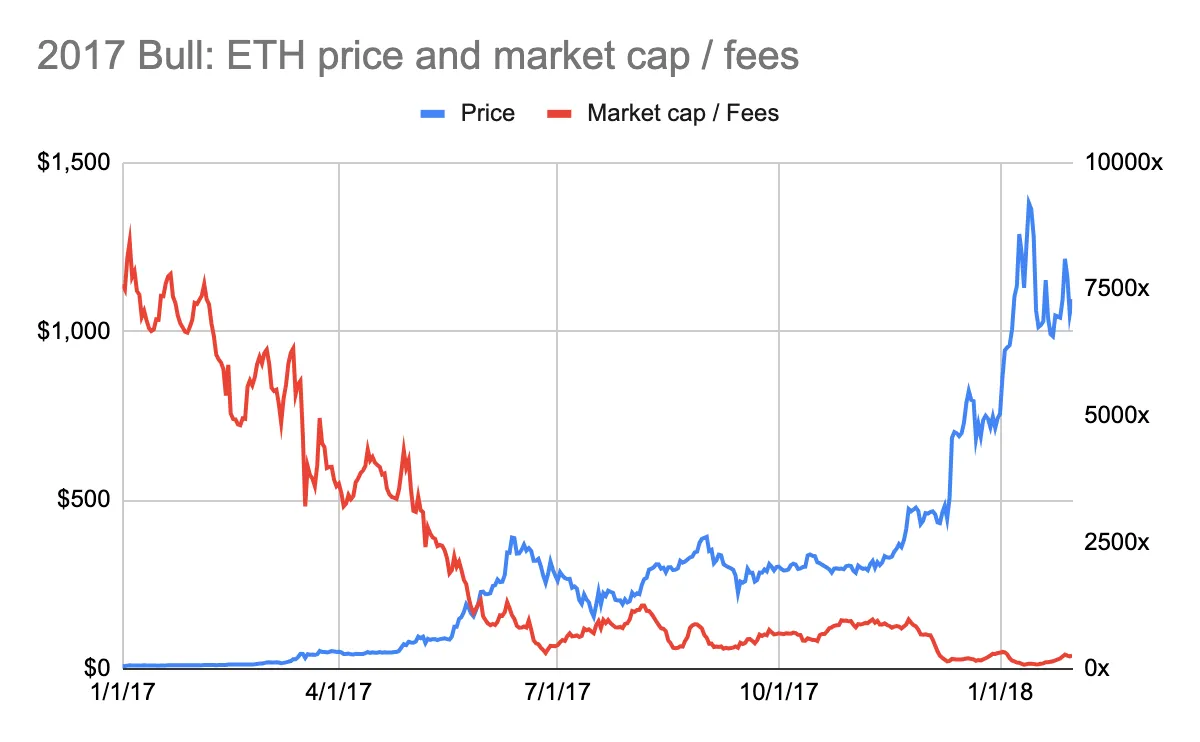
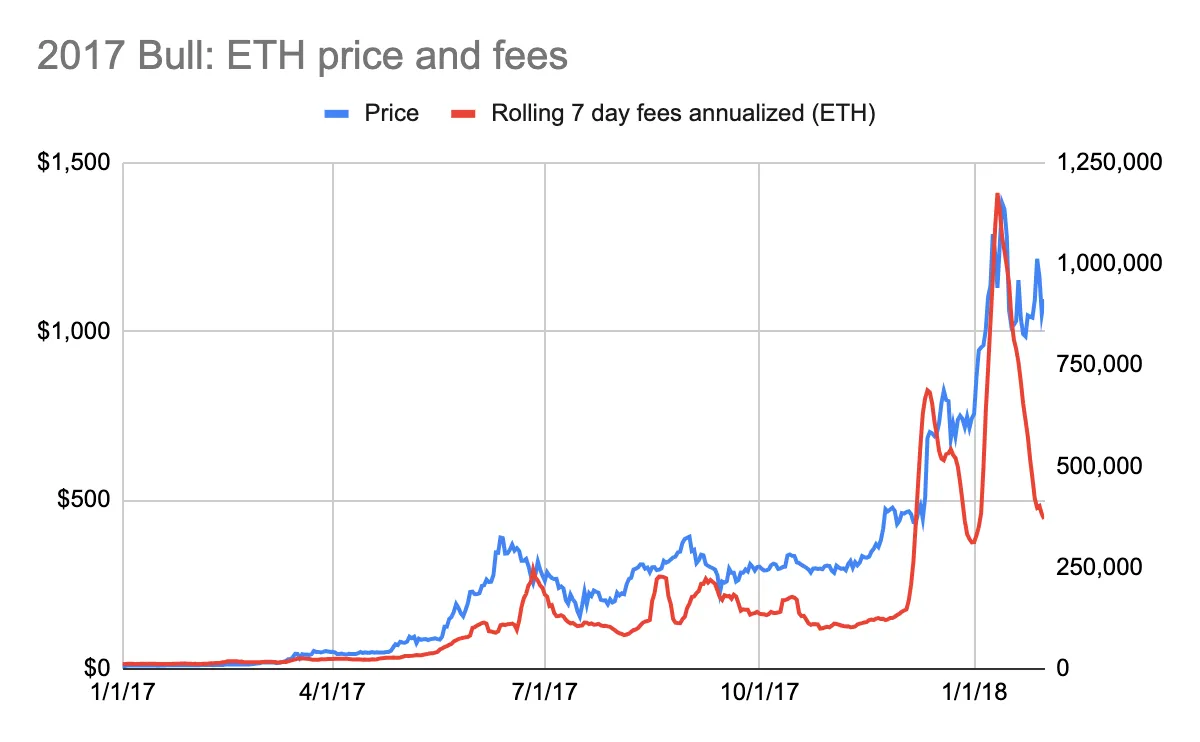
The bull market of 2017 highlighted the inverse relationship between multiples and prices. In early 2017, Ethereum's multiple reached an astonishing 7700 times the fee (see the chart below: 2017 bull market: ETH price and market cap/fees). However, from the perspective of price changes, it was a good time to buy Ethereum, with the price around $10. Subsequently, Ethereum's price increased tenfold, and the multiple dropped to 100x.
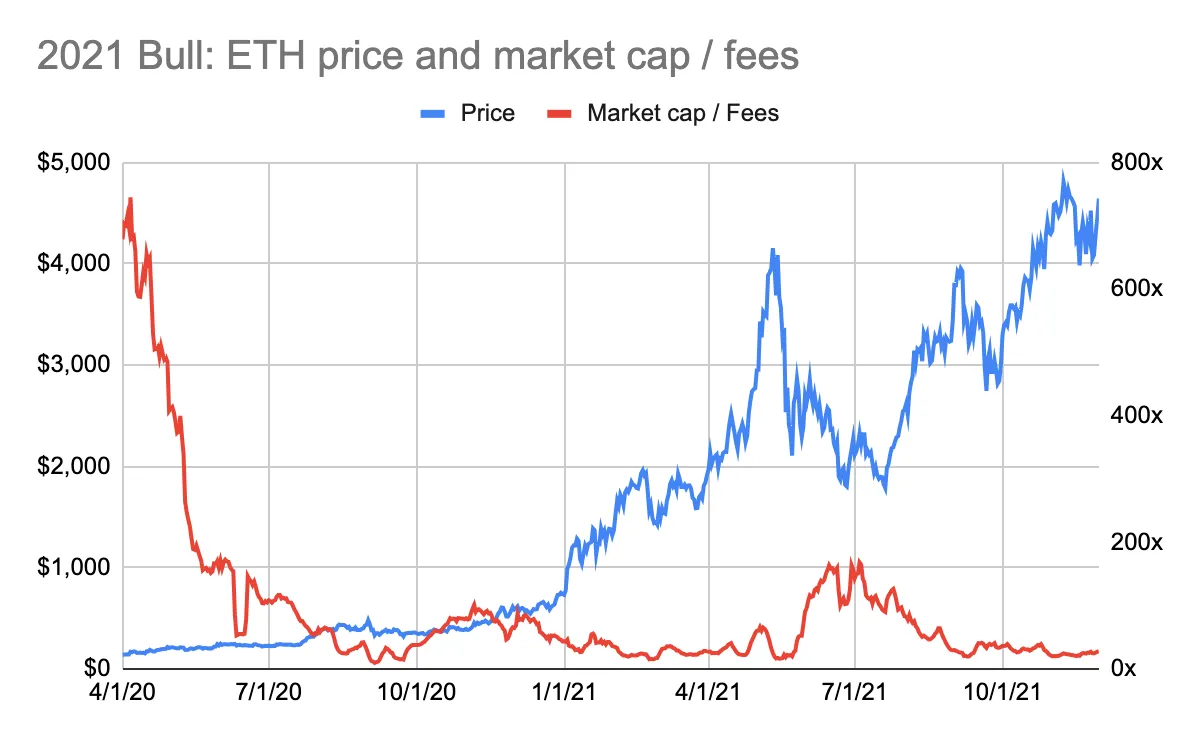
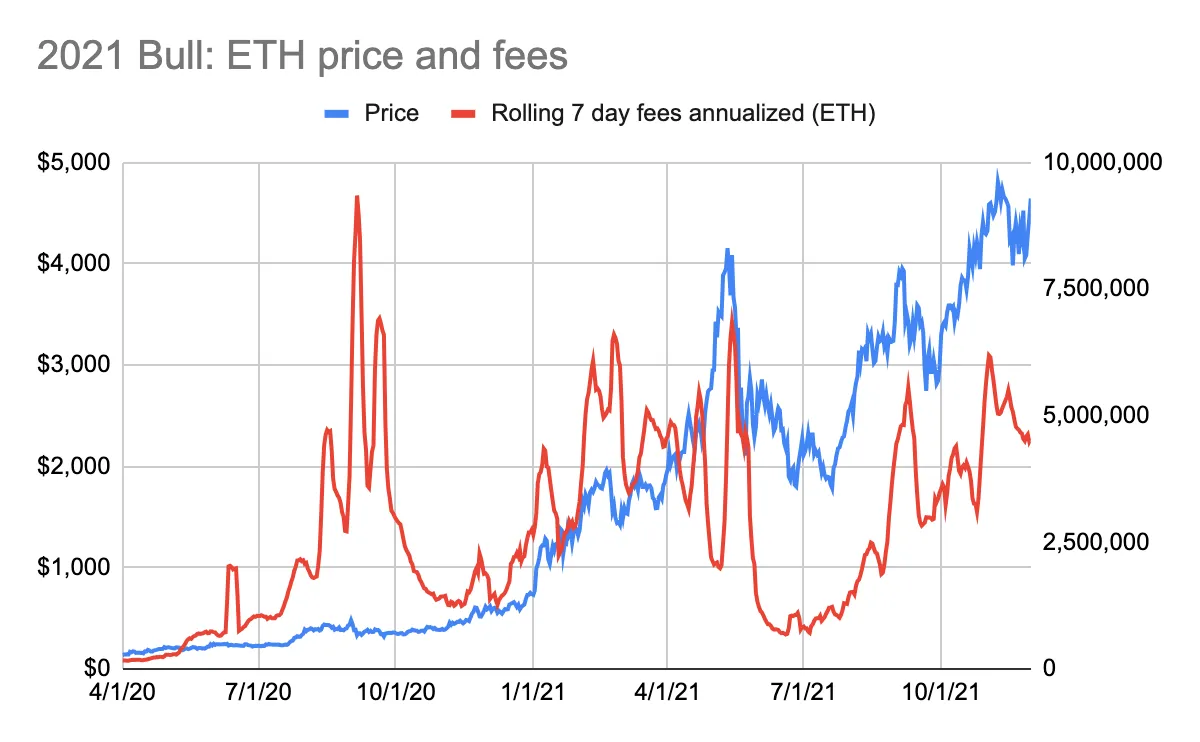
The 2021 bull market also exhibited a similar trend. Buying Ethereum at around $200 in early 2020 coincided with Ethereum's multiple reaching 650 times the fee (see the chart below: 2021 bull market: ETH price and market cap/fees). Ethereum's price increased 24 times, while its multiple compressed to 22x.
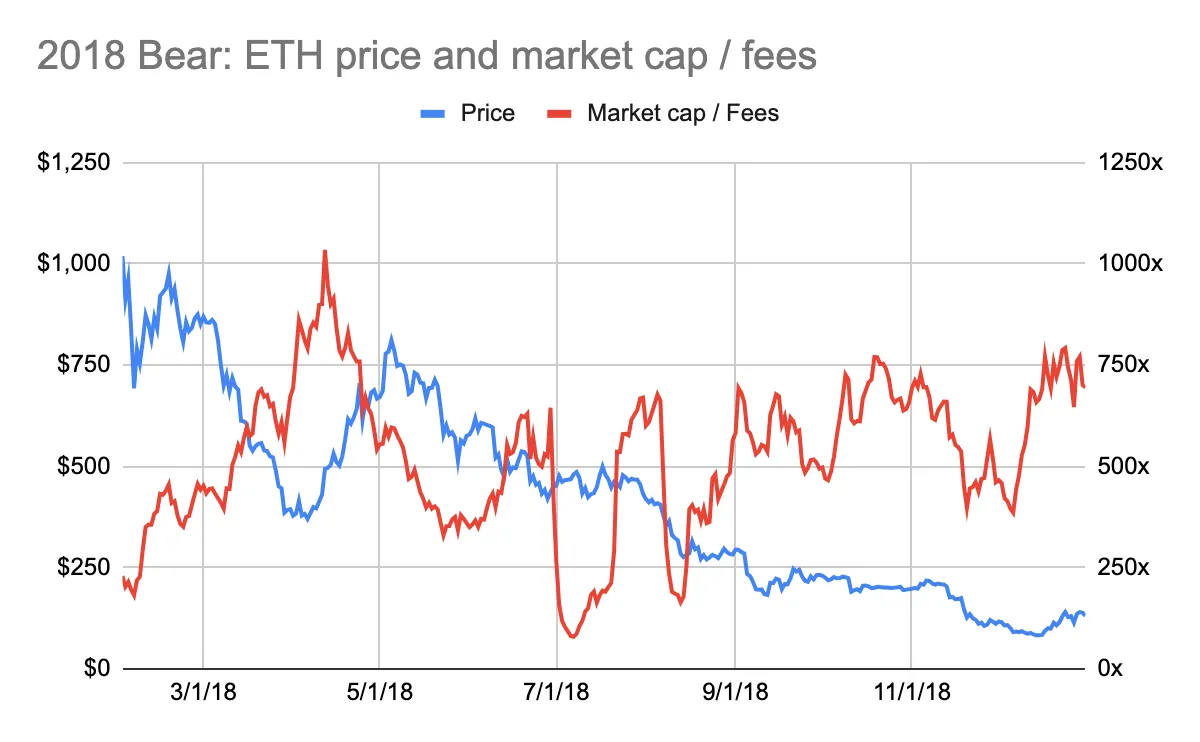
The bear market of Ethereum also showed the same inverse relationship. In early 2018, Ethereum's price approached a peak of $1000, while Ethereum's multiple dropped to 200 times the fee (see the chart below: 2018 bear market: ETH price and market cap/fees). Just a few months earlier, Ethereum's multiple had exceeded 3000 times the fee (see the chart above: 2017 bull market: ETH price and market cap/fees). This indicates that selling Ethereum at that time was a good opportunity.
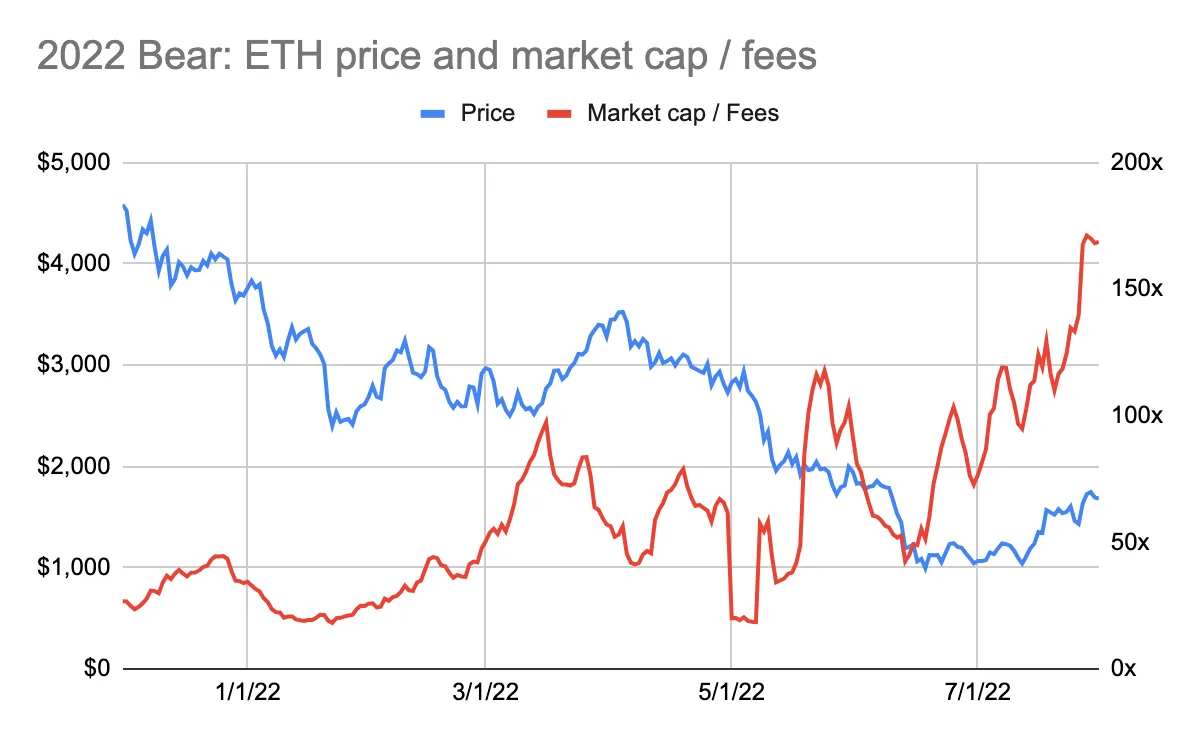
Similarly, at the end of 2021, Ethereum's price reached a historical high of over $4000, while Ethereum's multiple dropped to 25 times the fee (see the chart below: 2022 bear market: ETH price and market cap/fees). This indicates that selling Ethereum at that time was a good opportunity.
Multiple Conclusions
ETH's price and multiples are inversely related. Historical data shows that it is best to buy ETH when it is at its peak price-to-earnings ratio, and sell when it is at its lowest. Buy when ETH is at its highest valuation multiple, and sell when it is at its lowest.
This conclusion is indeed counterintuitive.
How can this unique relationship be explained?
This counterintuitive conclusion can be explained as follows:
The market is forward-looking.
Ethereum's value is not based on fee multiples.
1. The market is forward-looking
Whether in the stock, commodity, or cryptocurrency markets, they are all forward-looking. Prices reflect expectations for the future, not events that have already occurred. It can be understood as follows: a company's value is based on its future cash flows.
The market cap/fee multiple reflects Ethereum's fee at a specific point in time. The fee data used to calculate the multiple is the sum of fees over the past seven days multiplied by 52 weeks. It does not reflect Ethereum's future fee potential. This fee data is not a forward-looking indicator.
Analyzing historical data confirms the forward-looking nature of the Ethereum market. In the 2017 bull market, Ethereum's price rose before Ethereum fees (priced in Ethereum) increased (see the chart below: 2017 bull market: ETH price and fees). Note that the decline in prices at the beginning of 2018 did not match the rapid decline in fees.
In the 2021 bull market, a similar but weaker trend emerged. By May 2021, prices began to rise before the corresponding increase in fees (see the chart below: 2021 bull market: ETH price and fees). However, in the summer of 2010, fees almost doubled, but Ethereum's price did not change accordingly. In addition, the growth in fees in early 2021 led to an increase in Ethereum's price. This reversal of the order can be explained by the COVID-19 pandemic. In the summer of 2020, people were locked down at home. DeFi applications experienced explosive growth, leading users to spend more on Ethereum fees. However, the investment community did not pay attention to cryptocurrencies.
The fluctuation of ETH prices when expecting Ethereum fee growth is most evident in bull markets. This relationship is neither negated nor confirmed during price declines or sideways trading.
2. ETH is not valued based on fee multiples
The market may not value Ethereum based on fee multiples. If it did, ETH's price and fee multiples should move somewhat in sync. The logic should be that a lower price-to-earnings ratio often implies a more attractive entry price, not the other way around.
Ethereum's fee multiples fluctuate dramatically and tend toward high valuation multiples. Since 2016, Ethereum's trading prices have fluctuated between 10x and 8,800x its fees. Since 2021, this range has compressed to 20x to 235x. Valuation multiples are still relatively high.
Ethereum has the characteristics of a productive asset, commodity, and store of value asset. The valuation of productive assets is based on earnings multiples, while commodities and store of value assets are not. The difficulty in explaining ETH's valuation based on fee multiples may indicate that ETH is more viewed as a store of value asset rather than a productive asset.
However, there is a question here…
If ETH is not considered a productive asset, why does the price fluctuate when expecting fee growth?
Prices should not fluctuate. After all, if ETH is a store of value asset, then the growth in Ethereum fees should not have a significant impact on its valuation.
But fees do indeed have an impact on prices.
How significant is this impact?
It's hard to say. ETH prices are influenced by multiple variables, including macro factors, regulations, and competition. It's impossible to determine which variable has the greatest impact on prices.
In the cryptocurrency field, especially in Ethereum, fundamental factors (such as fees) are important. Fundamentals determine the health and prospects of the network. For first-layer blockchains, fundamentals can only play a role in valuing the network. The value of a blockchain largely lies in its monetary properties, its ability to store and transfer value, and its ability to secure the network. Protocols and applications built on top of the first-layer blockchain rely more on their properties as productive assets.
Therefore, you cannot derive ETH's price from trading multiples. Ethereum's "cheap" or "expensive" multiples do not explain much. But Ethereum's indicator, its fees, drives price fluctuations.
免责声明:本文章仅代表作者个人观点,不代表本平台的立场和观点。本文章仅供信息分享,不构成对任何人的任何投资建议。用户与作者之间的任何争议,与本平台无关。如网页中刊载的文章或图片涉及侵权,请提供相关的权利证明和身份证明发送邮件到support@aicoin.com,本平台相关工作人员将会进行核查。


