Article Editing Time
August 1, 2023, 11:45 AM. All views do not constitute any investment advice! For study and communication only.

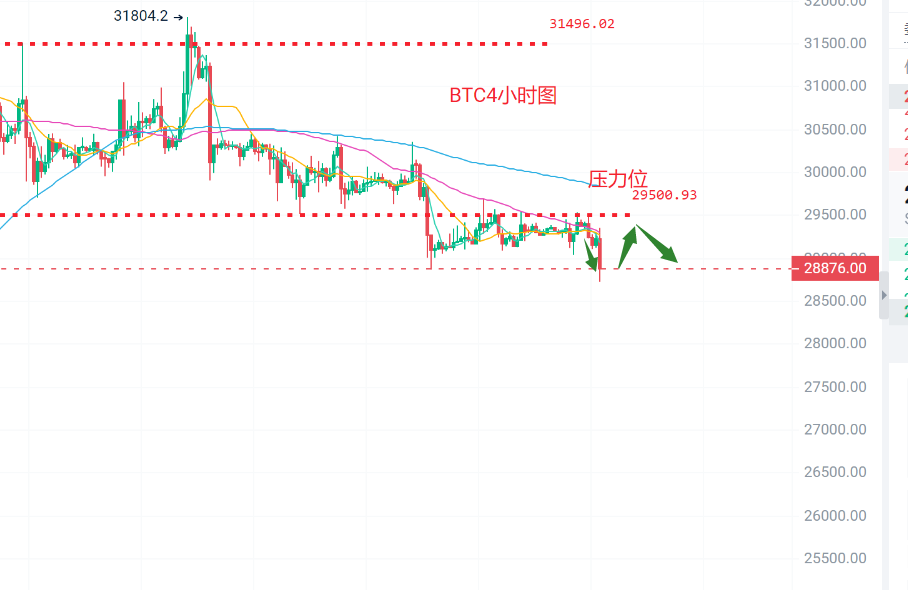
Bitcoin reached a high near 29530 yesterday and a low near 29100. The overall fluctuation of Bitcoin was not significant yesterday. After testing the 29500 level again in the evening, it started to fall back. In the early morning today, it quickly dropped and hit a low near 28700 before rebounding and oscillating. Currently, there is significant selling pressure around the 29500 level, and short-term bearishness prevails. Without effectively breaking through 28500, the market is expected to continue in a oscillating trend.
On the daily chart, a small bearish candle was formed yesterday, and the Bollinger Bands are trending downward, supported by the Bollinger lower band at 28600. The MACD is decreasing with shrinking volume. On the 4-hour chart, the Bollinger Bands have widened, the candle pierced the lower Bollinger Band, and the MACD is decreasing with increasing volume. In terms of operation, it is suggested to go long with a light position near 28500 on a pullback, with a target of 28900-29300. If it fails to break through 29500, a light short position is recommended, with a target of 29200-28600 and a stop loss of 350 points. The market is ever-changing, and real-time strategy should be the primary consideration.

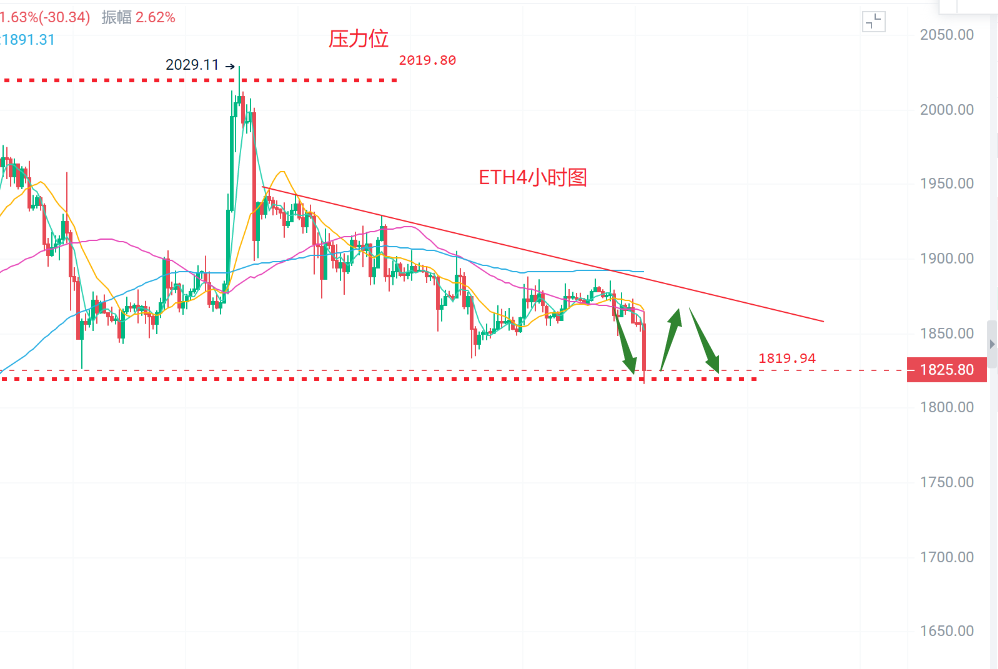
Ethereum reached a high near 1877 and a low near 1850 yesterday. Ethereum's trend is mainly influenced by Bitcoin and is weaker than Bitcoin. In the early morning today, it experienced a decline, rebounding after hitting a low near 1816, without effectively breaking through the support at 1820. It is currently still in a downtrend.
On the daily chart, a small bearish candle was formed yesterday, and the Bollinger Bands are running parallel, suppressed by the Bollinger midline at 1890. The MACD is decreasing with increasing volume. On the 4-hour chart, it is still in a downtrend, with widened Bollinger Bands and the MACD decreasing with increasing volume. In terms of operation, it is suggested to go long with a light position near 1820 on a pullback, with a target of 1850-1870. A light short position is possible near 1880, with a target of 1850-1820 and a stop loss of 25 points. The market is ever-changing, and real-time strategy should be the primary consideration.
Disclaimer: The above content is purely personal opinion, and the strategy is for reference only. It should not be used as a basis for investment. Follow at your own risk.

Friendly Reminder: The above content is from the public account: "Floating Bamboo Li Jun." The advertisements at the end of the article and in the comment section are unrelated to the author. Please discern carefully. Thank you for reading.
免责声明:本文章仅代表作者个人观点,不代表本平台的立场和观点。本文章仅供信息分享,不构成对任何人的任何投资建议。用户与作者之间的任何争议,与本平台无关。如网页中刊载的文章或图片涉及侵权,请提供相关的权利证明和身份证明发送邮件到support@aicoin.com,本平台相关工作人员将会进行核查。


