原文:David Puell,Ark Invest 分析师;
译者:CryptoLeo
编者按:
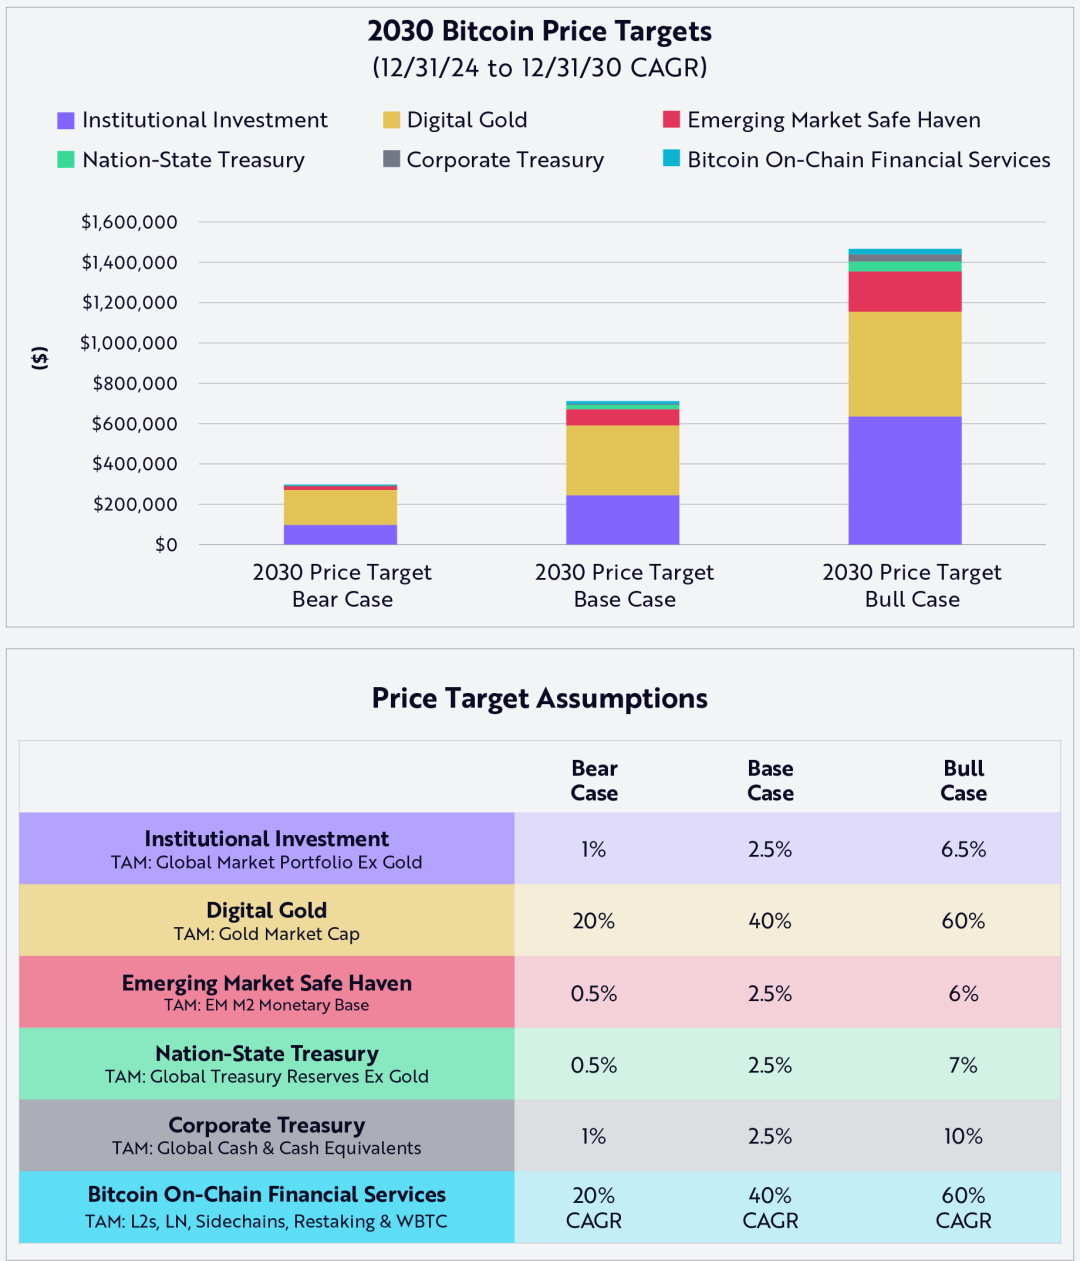
年初,比特币“死多头”、木头姐的 Ark Invest 发布 Big Ideas 2025 报告,提到比特币 2030 年有望实现的三个价格目标,分别是: 30 万美元(熊市)、 71 万美元(基准市场)和 150 万美元(牛市)。彼时其只是“单纯地狂喊”出一个远超市场预期的价格(像 Plan B 一样疯),并未公布实际的估算过程。
两个月后,Ark Invest 终于公布了其对比特币 2030 价格目标的建模方法和逻辑假设,该模型通过比特币总潜在市场规模(TAM)和渗透率(普及程度或占有率)来预测比特币 2023 年的价格。
更鼓舞人心(夸张)的是 Ark Invest 创建的基于比特币活跃供应指标的运算下,比特币 2030 年的价格分别为: 50 万美元(熊市)、 120 万美元(基准市场)和240 万美元(牛市)。如果其中任何一项 TAM 或渗透率未达预期,比特币可能无法达到这些价格目标。所以该模型也存在一些风险和偏差。以下为比特币价格预测的具体细节,由Odaily星球日报编译。
价格目标和假设
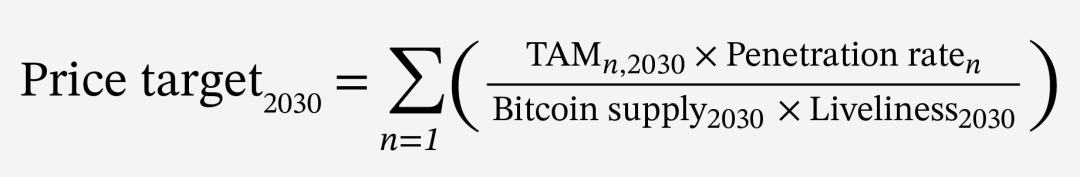
我们的价格目标是 2030 年底 TAM(总潜在市场)贡献的总和,基于以下公式:
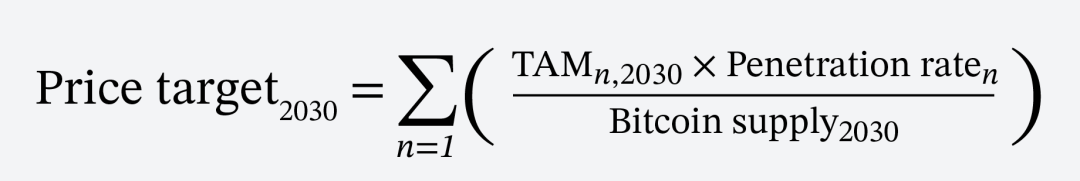
Odaily星球日报注:该公式通过量化市场需求和比特币流通的动态关系来预测 2030 年比特币的价格。通过细分市场的最大美元基准需求规模与比特币在其市场的渗透率相乘并除以比特币的流通供应量得出比特币价格,并将所有细分市场(以下细分市场/概念)的价格求和得出比特币在 2030 年的预测价格。
我们对供应量的估算基于比特币的流通量,到 2030 年将接近 2050 万枚 BTC 被开采。每个变量对价格目标的贡献如下:
预计资本累积的贡献者(主要):
1、机构投资,主要通过现货 ETF;
2、比特币被一些人称为“数字黄金”,相对于黄金而言,它是一种更灵活、更透明的价值存储手段;
3、新兴市场投资者寻求可以保护他们免受通货膨胀和货币贬值影响的避风港。
预计资本累积的贡献者(次要):
4、国家国库储备,其他国家效仿美国,建立比特币战略储备;
5、企业财库储备,随着越来越多的公司利用比特币实现法定现金多元化;
6、比特币链上金融服务,比特币作为传统金融的替代品。
排除数字黄金(由于它是比特币最直接的零和竞争者,因此我们的模型将其排除在外),我们保守假设,上述贡献者(具体为 1、 3、 4 和 5)的 TAM 在未来六年内将以 3% 的复合年增长率(CAGR)增长。对于第六个贡献者——比特币的链上金融服务,我们假设其 6 年的复合年增长率在 20% 至 60% 之间,以截至 2024 年底的累计价值为基准,如下所示:
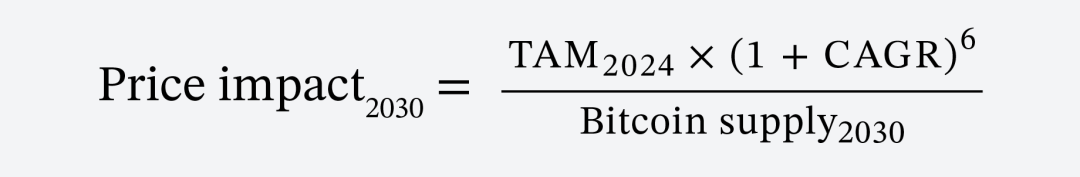
Odaily星球日报注:该公式通过 2024 年比特币总价值与每年的复合增长率来计算 6 年后的比特币 TAM,并除以比特币 2030 年流通供应量来计算其价格。
最后,我们分别描述 TAM 和渗透率对熊市、基准市场和牛市价格目标的贡献度,如下所示:
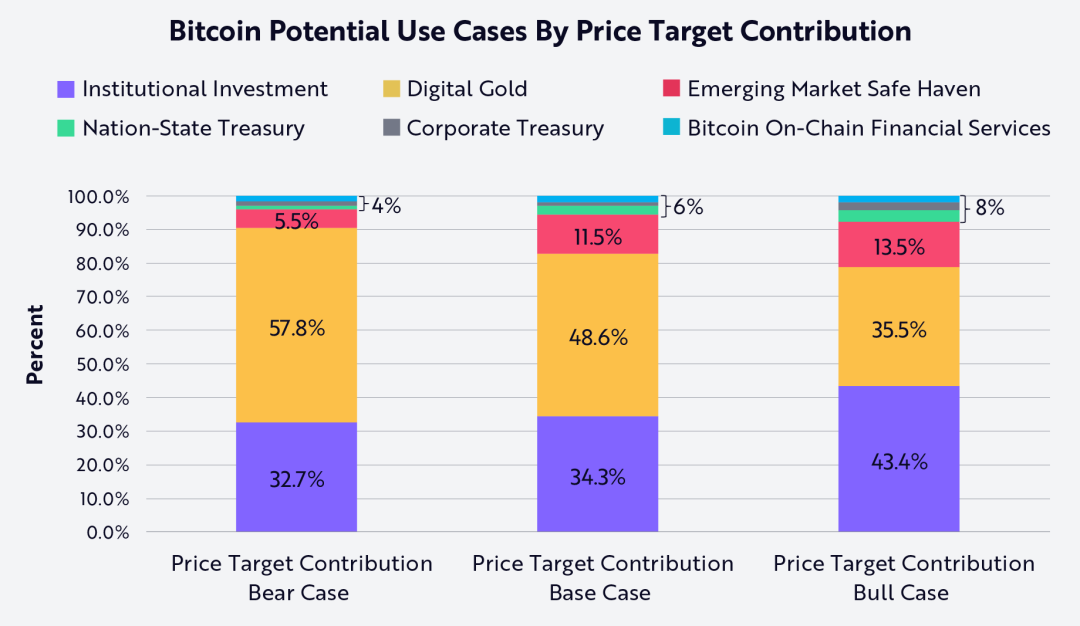
如上图所示,“数字黄金”对我们的熊市情景和基准情景贡献最大,而机构投资对我们的牛市情景贡献最大。有趣的是,国家国库、企业财库以及比特币链上金融服务在每种情景中的贡献都相对较小。在下表中,我们详细列出了我们预测的六种资本累积来源分别对熊市、基准市场和牛市情况的相对贡献:
Odaily星球日报注:以下图表分别是细分市场 2030 年预计 TAM、三种市场行情下的比特币渗透率和上图中的贡献度比例。
1、资本累积的潜在贡献者:机构投资
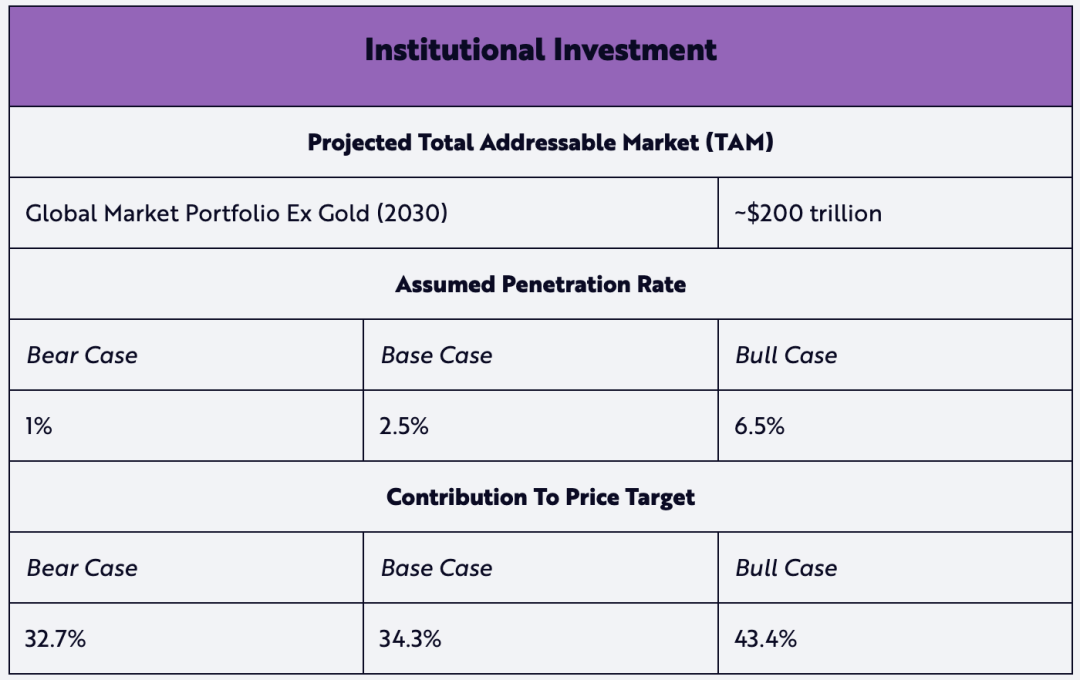
根据道富银行的说法,全球市场投资组合的定义如下:
所有可投资资本资产的市值除以所有资产市值之和。作为投资者和发行人以及资本供应方和需求方集体决策所产生的所有持仓的总和,全球市场投资组合可以被视为全球所有投资者可投资机会集的实际代表。
截至 2024 年,全球投资组合的 TAM 约为 169 万亿美元(不包括黄金 3.6% 的份额)。假设其年复合增长率为 3% ,则到 2030 年其价值将达到约 200 万亿美元。
我们假设熊市和基准市场的渗透率分别为 1% 和 2.5% ,均低于黄金目前 3.6% 的份额。因此,熊市和基准市场代表了对比特币采用的保守看法。在更激进的牛市下,我们假设比特币渗透率达到 6.5% ,几乎是黄金当前份额的两倍。
2、资本累积的潜在贡献者:数字黄金
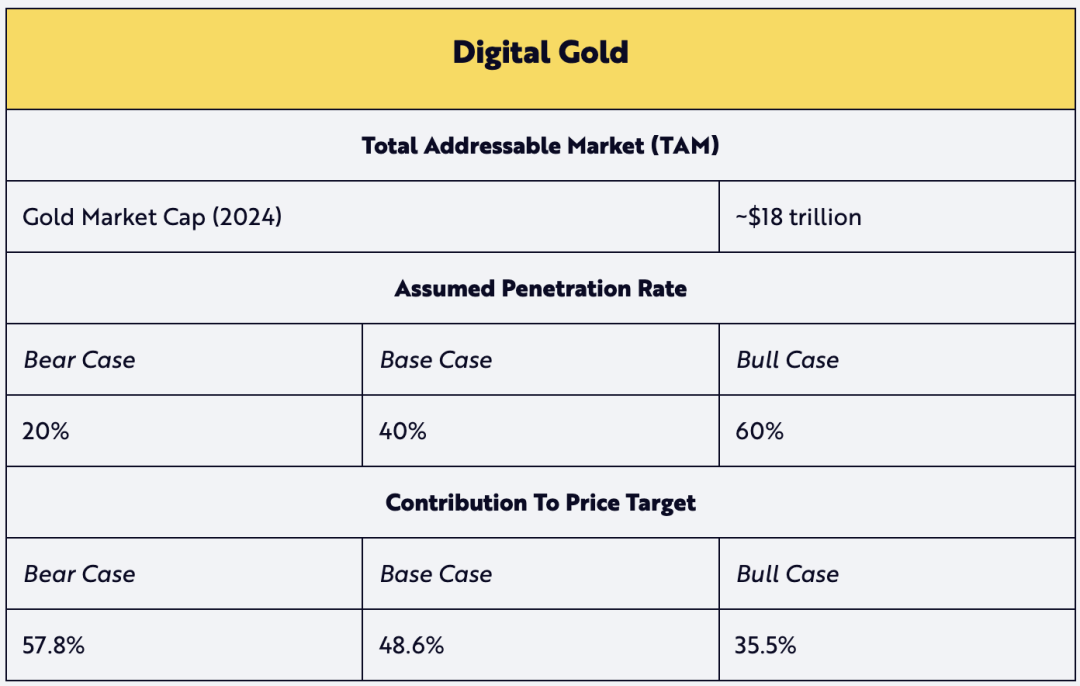
数字黄金的贡献假设了 TAM 相对于黄金当前市值的比率。鉴于给出的积极的渗透率,我们假设黄金在 2030 年的预期 TAM 不会增长,从而降低其预期值。我们认为,比特币作为数字黄金是一个有吸引力的叙事,这将推动其渗透率。
3、资本累积的潜在贡献者:新兴市场避风港
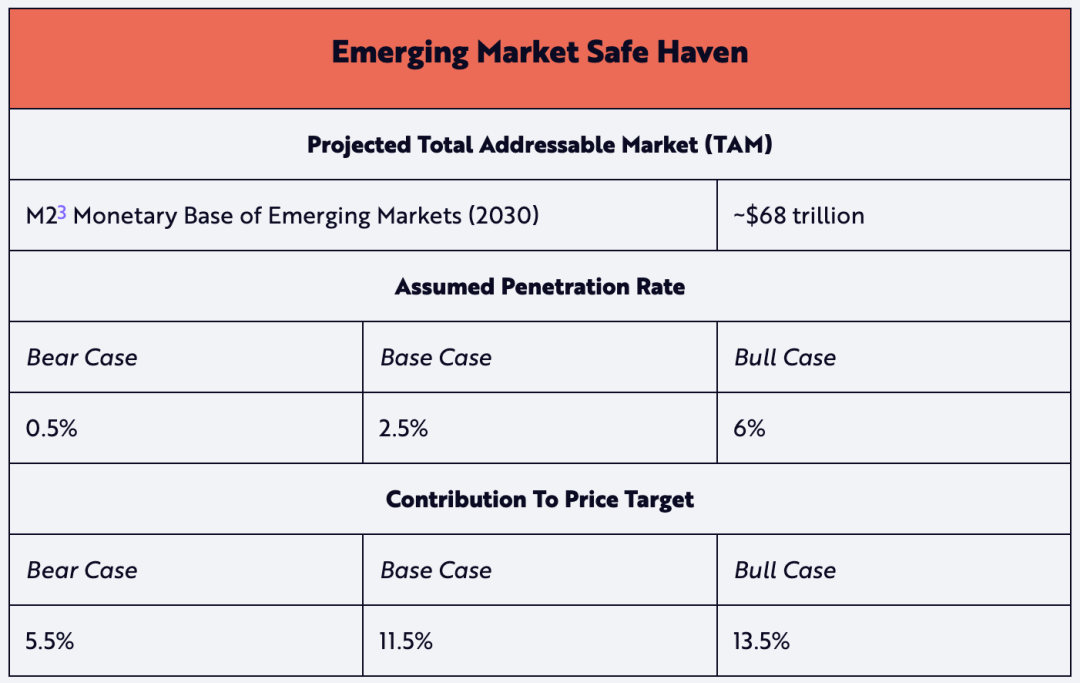
新兴市场避风港 TAM 基于所有发展中国家(根据 IMF/CIA 的定义,也称为“非发达”经济体)的货币基础。我们认为,比特币的这一用例具有最大的资本增值潜力。除了其价值存储特性外,比特币的低门槛还为拥有互联网的个人提供了一种投资选择,这种投资选择可能会随着时间的推移带来资本增值,与美元等防御性配置不同——从而保持购买力并避免本国货币贬值。
Odaily星球日报注:“M2” 是衡量美国货币存量的指标,包括M1(非银行公众持有的货币和存款、可支票存款和旅行支票)加上储蓄存款(包括货币市场存款账户)、 10 万美元以下的小额定期存款以及零售货币市场共同基金份额。
4、资本累积的潜在贡献者:国家国库
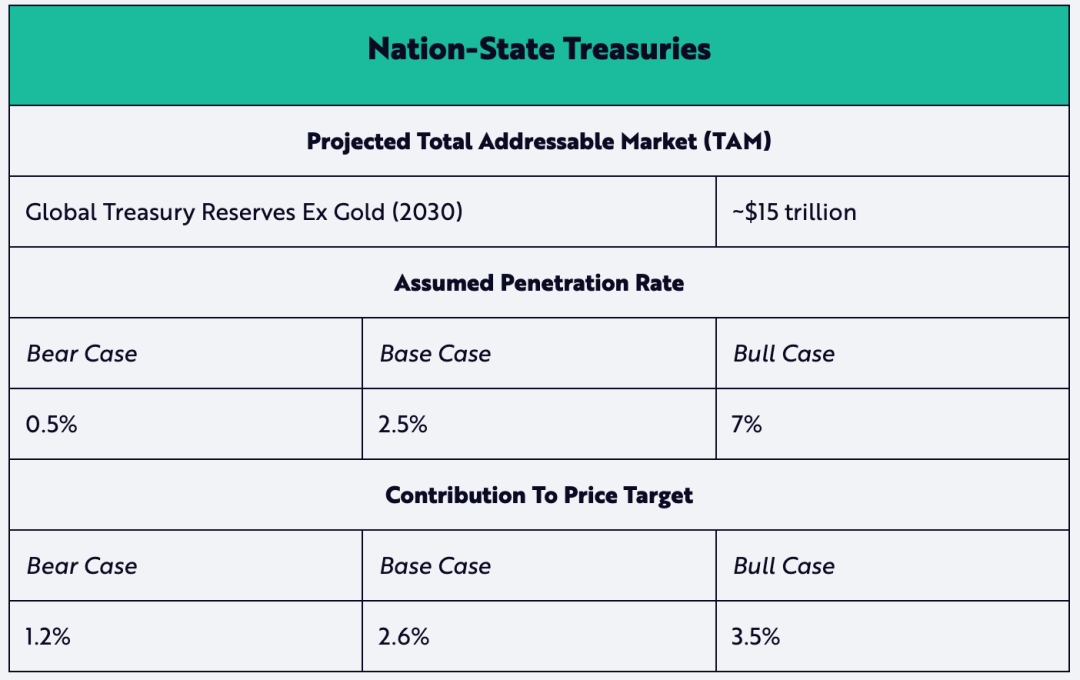
虽然萨尔瓦多和不丹目前在国家层面比特币采用率方面领先全球,但比特币战略储备的倡导者正在日益增多——尤其是特朗普上任后,他于 3 月 6 日发布了一行政命令,要求在美国建立 BTC 储备。尽管我们的熊市假设和基准假设较为保守,但我们相信,美国的情况或许能够进一步验证我们牛市假设中 7% 的渗透率。
5、资本累积的潜在贡献者:企业国债
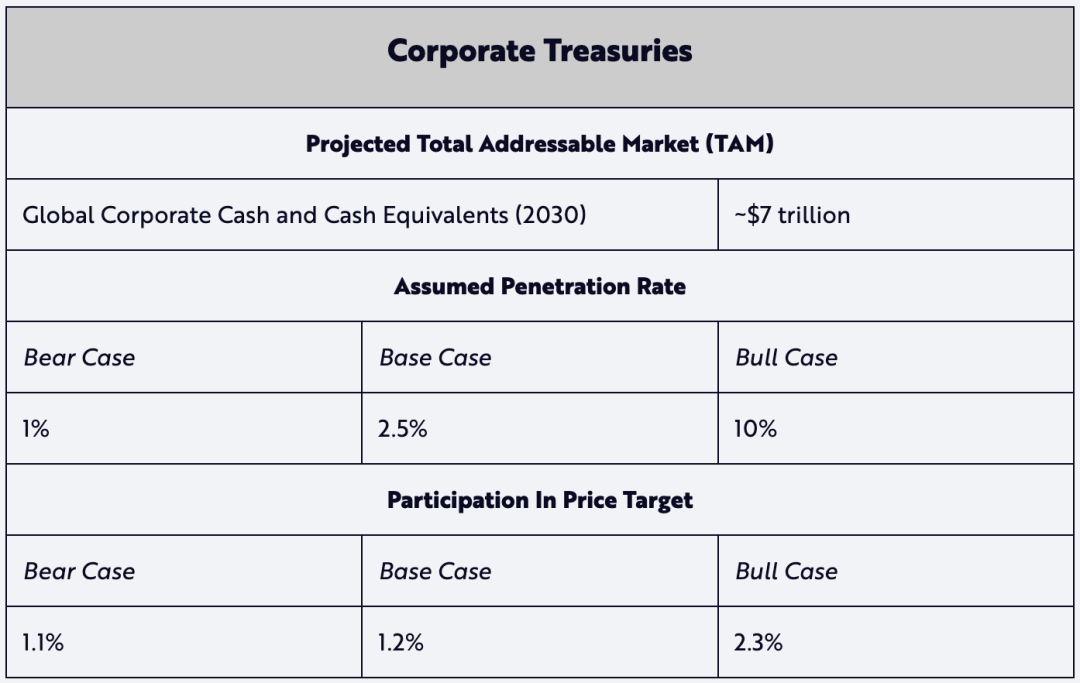
受 Strategy(微策略)公司自 2020 年以来成功购入比特币的启发,其他公司也纷纷将比特币纳入其企业财库储备。截至 2024 年底, 74 家上市公司的资产负债表上持有约 550 亿美元的比特币。如果这些企业 BTC 战略在未来六年内被证成功,那么我们在熊市和基准情景下的保守渗透率假设(分别为 1% 和 2.5% )最终可能会接近于牛市假设下的 10% 。
6、资本累积的潜在贡献者:比特币链上金融服务
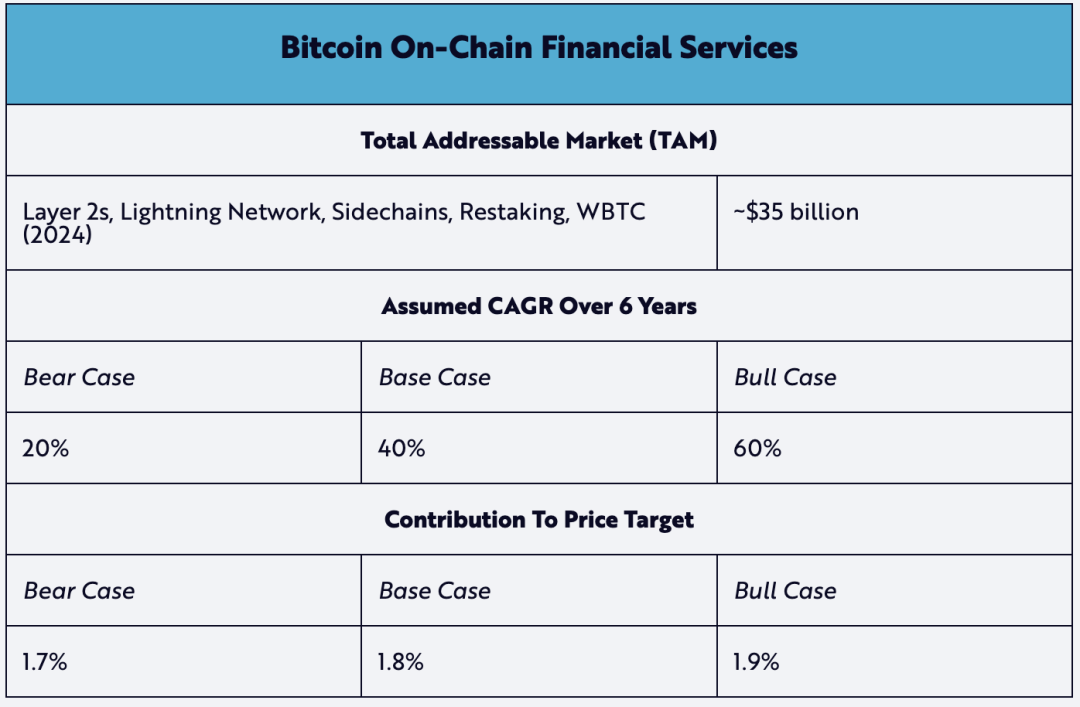
比特币的原生金融服务正在成为资本积累的新兴贡献者。其中突出的例子包括:像闪电网络这样的 Layer 2 服务致力于扩展比特币的交易容量,而以太坊网络上的 Wrapped BTC(WBTC)则使比特币能够参与去中心化金融。此类链上金融服务正成为比特币生态系统中日益重要的特征。因此,我们认为,从现在到 2030 年,基准市场 40% 复合年增长率是基于现实情况下的预期。
ARK 的假设适用于活跃比特币供应
虽然没有包含在 ARK 的 Big Ideas 2025 报告中,但其他实验建模方法估算了 2030 年比特币的价格。其中一种是通过计算丢失或长期持有的比特币,利用比特币的链上透明度来估算比特币的流动性供应——我们称之为“活跃”供应。
根据这种方法,可以通过将比特币在 2030 年的预期供应量乘以“活跃度”指标来计算活跃供应量,该指标衡量比特币随时间从 0% 到 100% 的移动量——换句话说,即资产的真实“浮动”,如下所示。
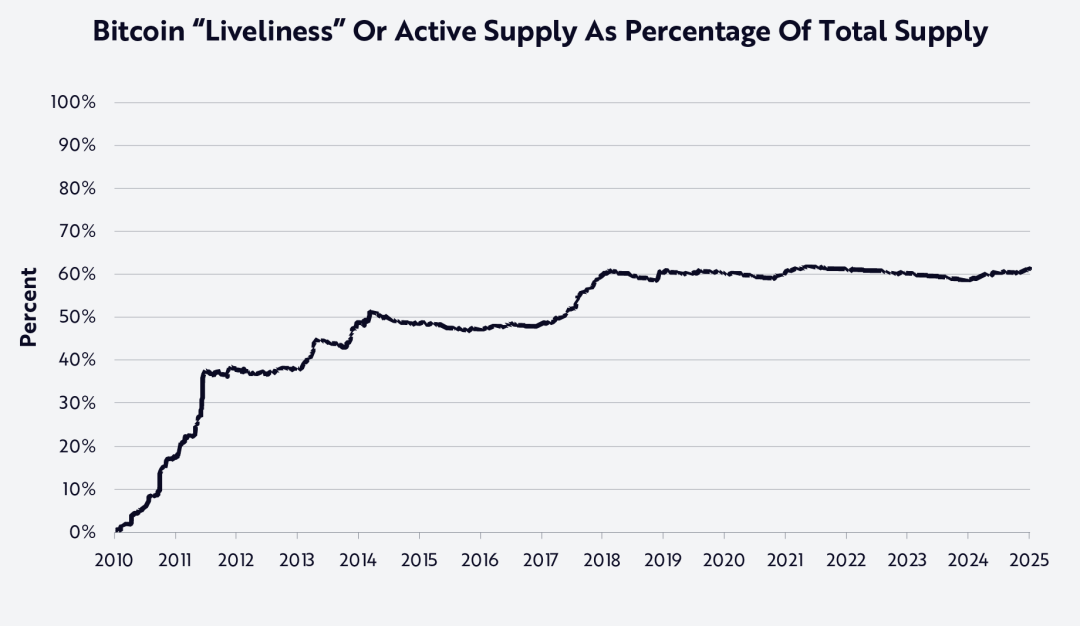
如图所示,自 2018 年初以来,比特币的网络活跃度一直保持在 60% 左右。我们认为,这种程度的活跃度表明约 40% 的供应量是“vaulted”(即存储不进入市场的比特币,比如中本聪的比特币地址)——我们在ARK 白皮书《Cointime Economics:比特币链上分析的新框架》(https://www.ark-invest.com/white-papers/cointime-economics)中深入探讨了这一概念。
然后,我们将相同的熊市和基准市场下的 TAM 和渗透率应用于预计到 2030 年活跃供应量达到 60% (假设随着时间的推移,活跃度保持稳定)的情况,如下所示:
在此基础上,我们得出以下价格目标,比我们的基础模型高出约 40% ,该模型不考虑比特币活跃供应和网络活跃度:
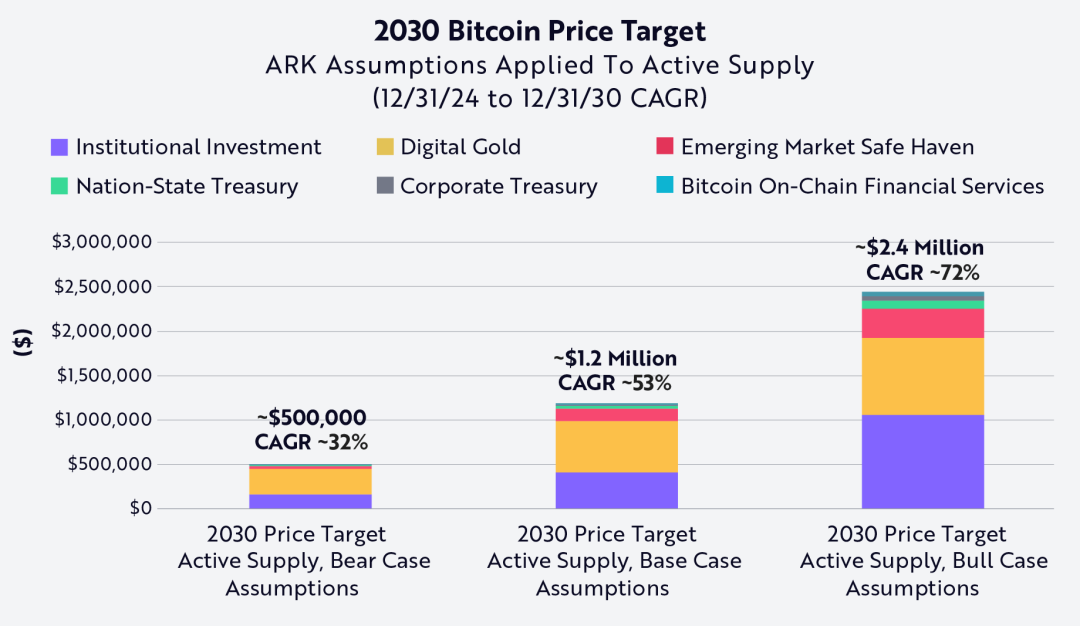
该模型显示, 2030 年基于新的加入比热币活越指标后的 BTC 估算价格为: 50 万美元(熊市)、 120 万美元(基准市场)和240 万美元(牛市)。
重要的是,采用这种更具实验性的方法构建的估值比我们在熊市、基准和牛市情景下的估值更为激进。由于我们的官方价格目标更偏向保守,因此仅关注比特币的总供应量。即便如此,我们也认为,这种更具实验性的方法凸显了比特币的稀缺性和供应量损失并未在当今大多数估值模型中得到体现。
番外
我粗略看了一下 Cointime Economics 框架,该框架提出了一套新的分析比特币估值和通胀率的体系,通过比特币的活跃度(Liveliness)和存储度(Vaultedness)来计算比特币经济状态和供应活动,可以衡量比特币网络中的交易活跃程度和未动用的币量比例。利用这两个指标可以对比特币的供应进行分类,分为活跃供应和未动用供应。
该框架还提出了一种度量单位——“币块”(Coinblock),币块概念提供了一套新的链上分析指标来衡量比特币的活动,通过计算持币时间与比特币数量的乘积来得到币块的数量,还引入了“币块创建”、“币块销毁”和“币块存储”三个概念,并基于此构建了一系列新的经济指标,例如比特币的活跃度和被锁定程度等,用以衡量比特币市场的动态变化和经济状态。此外,该内容还通过案例研究展示了 Cointime Economics 在改进市场估值模型、测量供应活动以及创建新的模型方面的潜力。币块概念和 Cointime 经济框架未来或许会成为比特币估值的主要参考。有兴趣的小伙伴可以去看看原PDF(https://assets.arkinvest.com/media-8e522a83-1b23-4d58-a202-792712f8d2d3/c919760f-ddc5-4c7c-a653-7904c0f78ddf/ARK%20Invest%20x%20Glassnode_White%20Paper_Cointime%20Economics_Final.pdf)。
免责声明:本文章仅代表作者个人观点,不代表本平台的立场和观点。本文章仅供信息分享,不构成对任何人的任何投资建议。用户与作者之间的任何争议,与本平台无关。如网页中刊载的文章或图片涉及侵权,请提供相关的权利证明和身份证明发送邮件到support@aicoin.com,本平台相关工作人员将会进行核查。


