Bitcoin Price Watch: Key Resistance at $84.5K Holds the Line in Tight Trading Range

CN
2 days ago

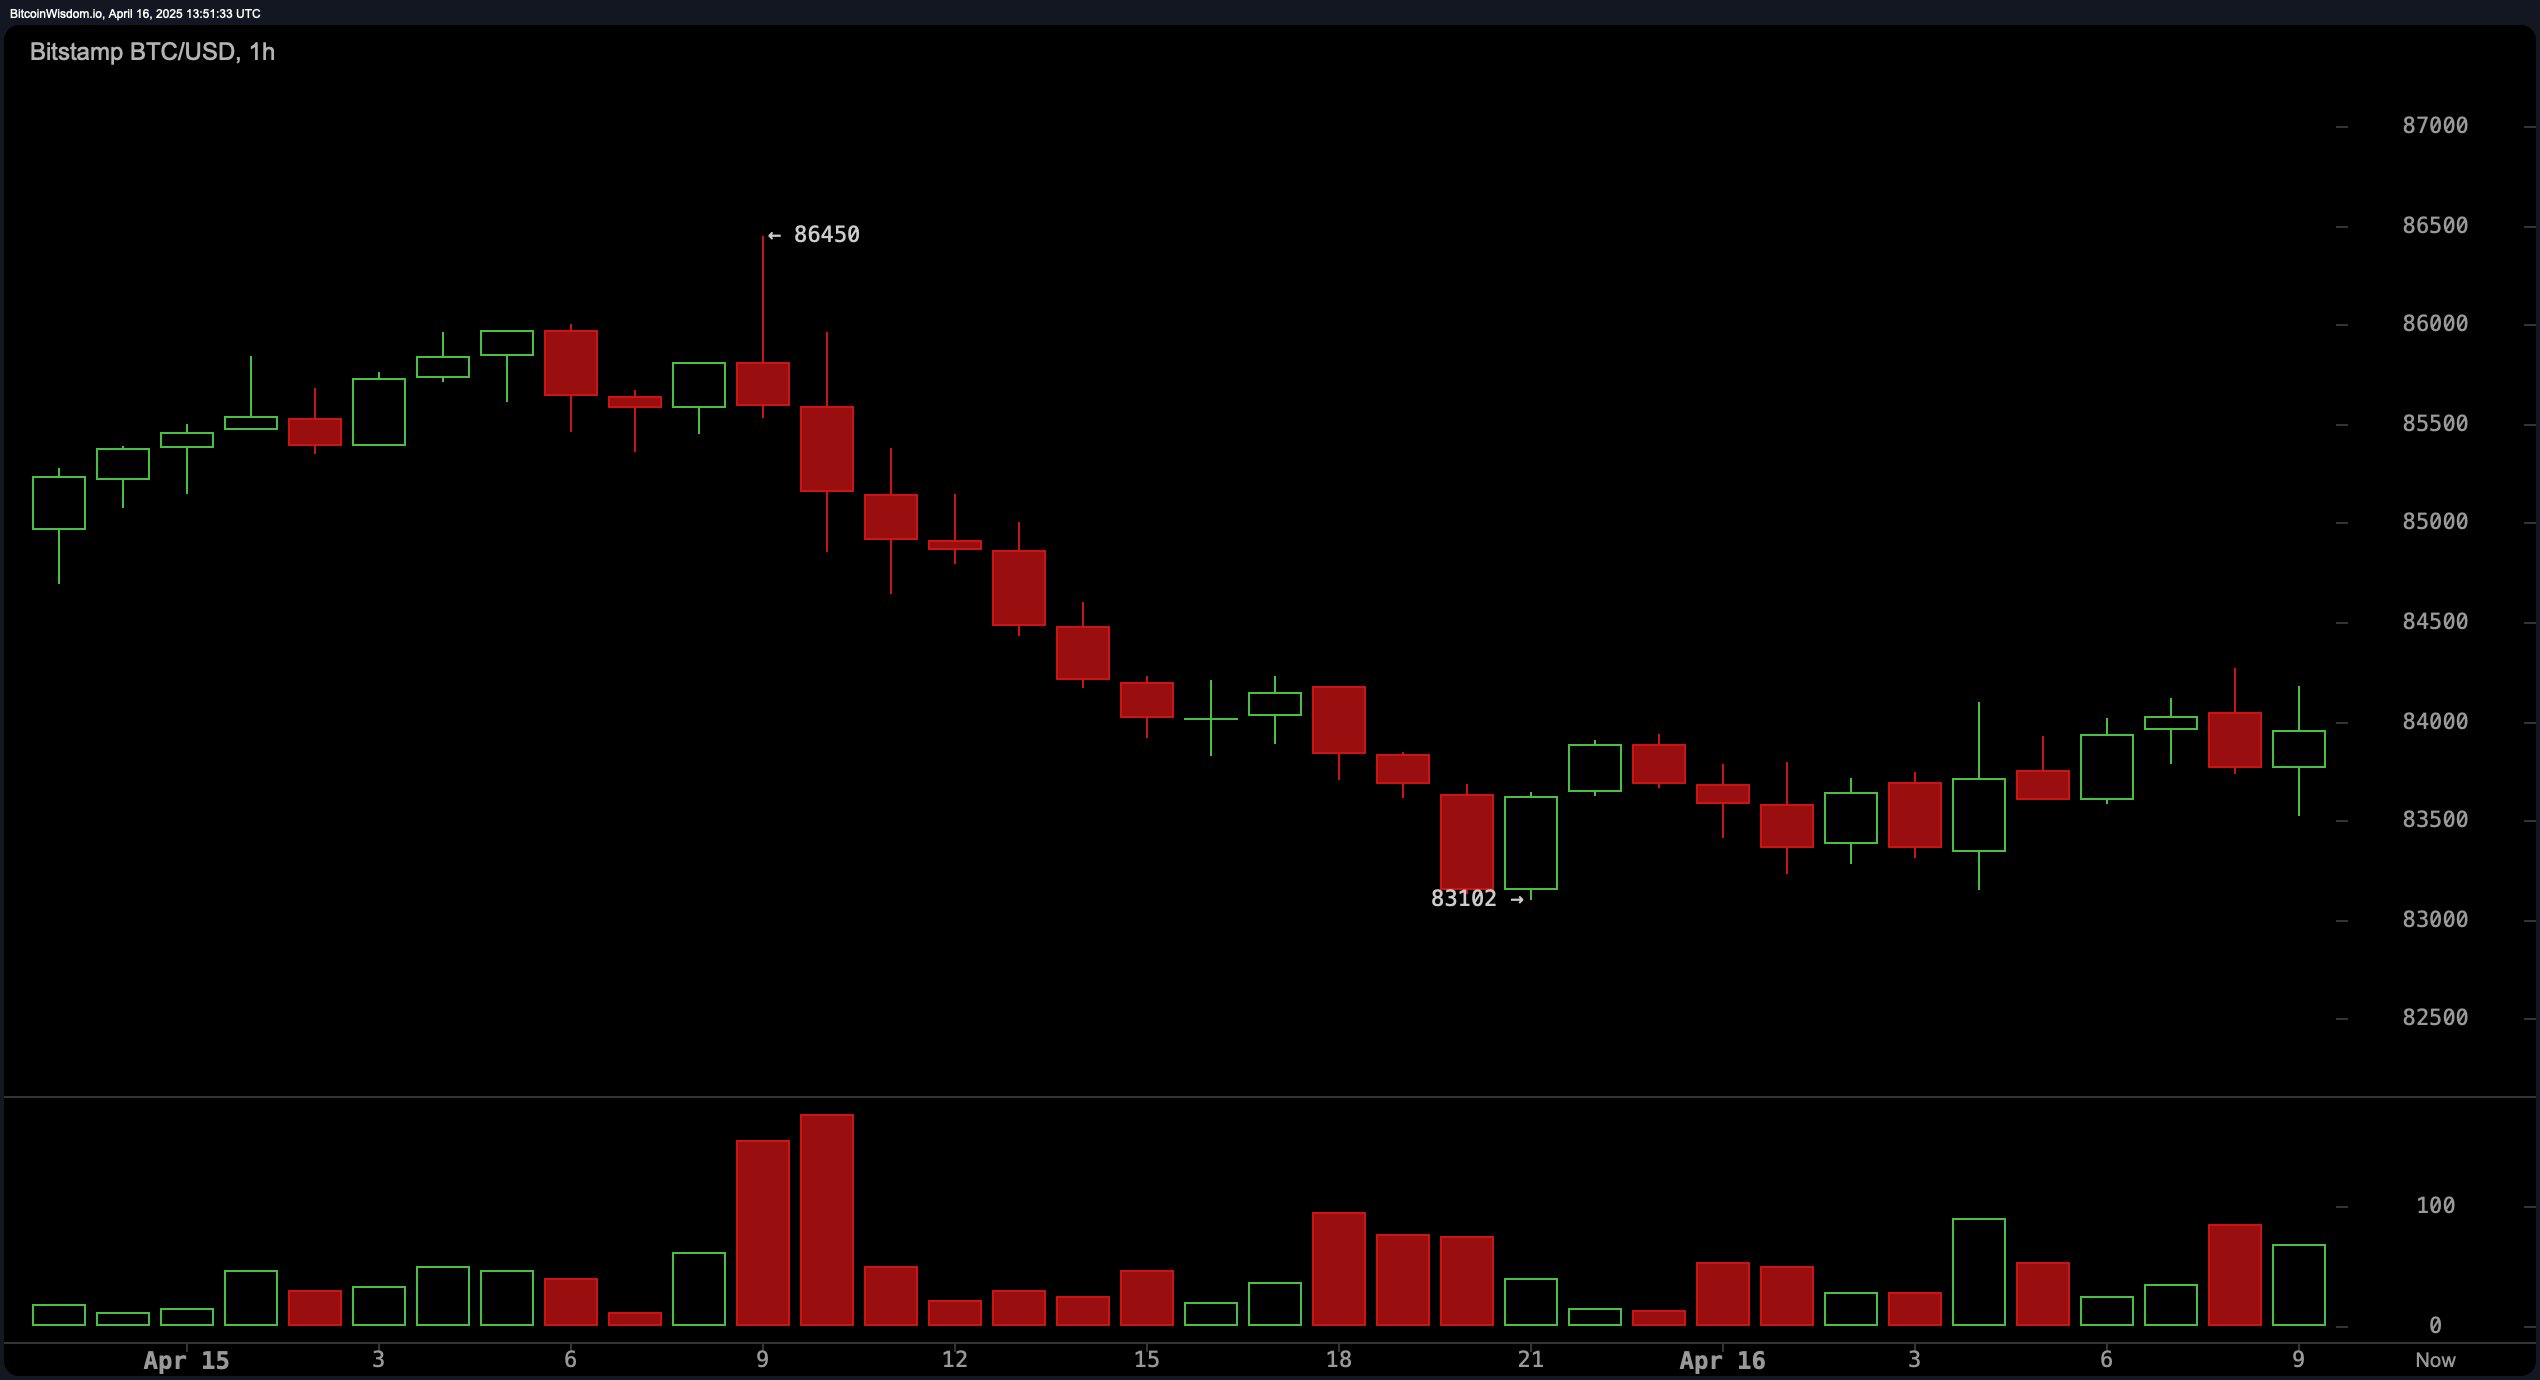
The one-hour chart reveals a market caught in short-term indecision. bitcoin has been range-bound between $83,000 and $84,000, showing a minor recovery attempt after dropping to a local bottom of $83,102. Although this double bottom pattern suggests potential bullish momentum, the current structure still reflects a series of lower lows — indicative of a short-term downtrend. For intraday traders, a breakout above $84,000 on strong volume would confirm a bullish reversal, with upside targets around $85,500. A downside break below $83,000 could lead to a further pullback toward $81,500, signaling renewed bearish strength.

Bitcoin Price Watch: Key Resistance at $84.5K Holds the Line in Tight Trading Range

BTC/USD via Bitstamp 1H chart on April 16, 2025.

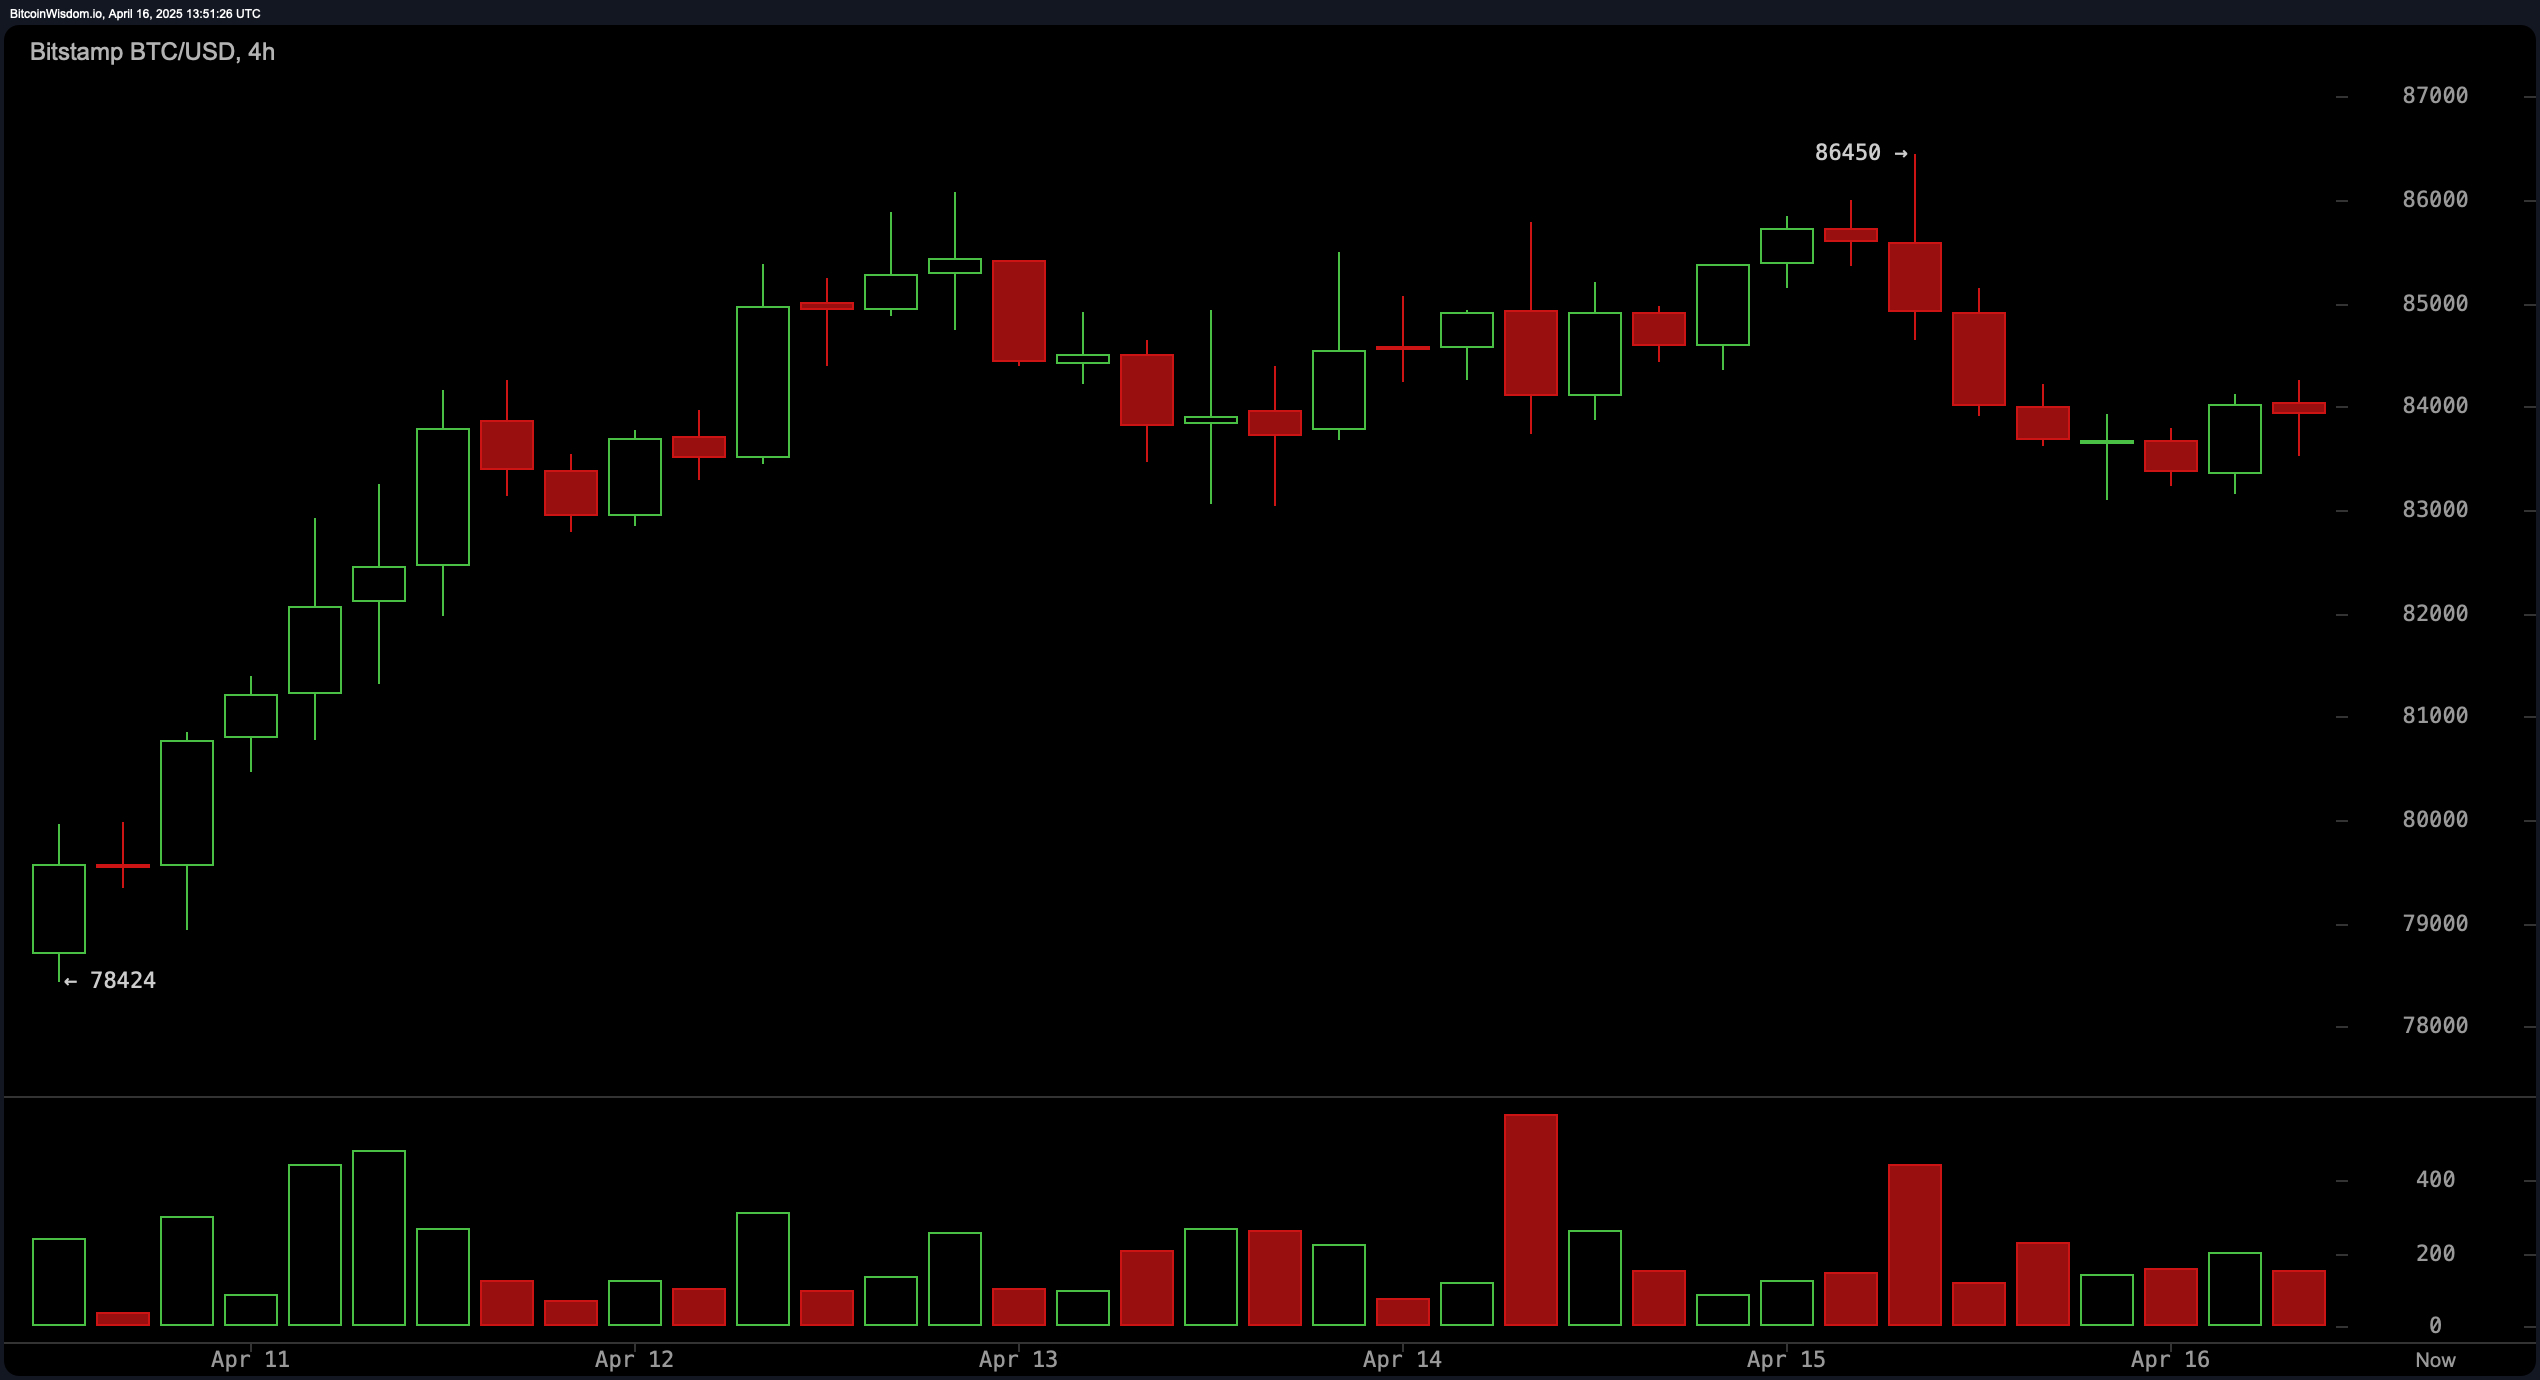
In the medium term, the four-hour chart points to a bearish structure characterized by a sequence of lower highs, following a rejection at $86,450. Volume spiked at this rejection level but subsequently diminished, showing waning momentum. However, bitcoin is finding short-term support between $83,000 and $83,500, with price action tightening into a consolidation zone. This setup often precedes an expansion in volatility. A clean break above $84,500, with confirmation through trading volume, could initiate a retest of resistance around $86,500. Traders should be cautious of potential fakeouts in this narrowing range.

Bitcoin Price Watch: Key Resistance at $84.5K Holds the Line in Tight Trading Range

BTC/USD via Bitstamp 4H chart on April 16, 2025.

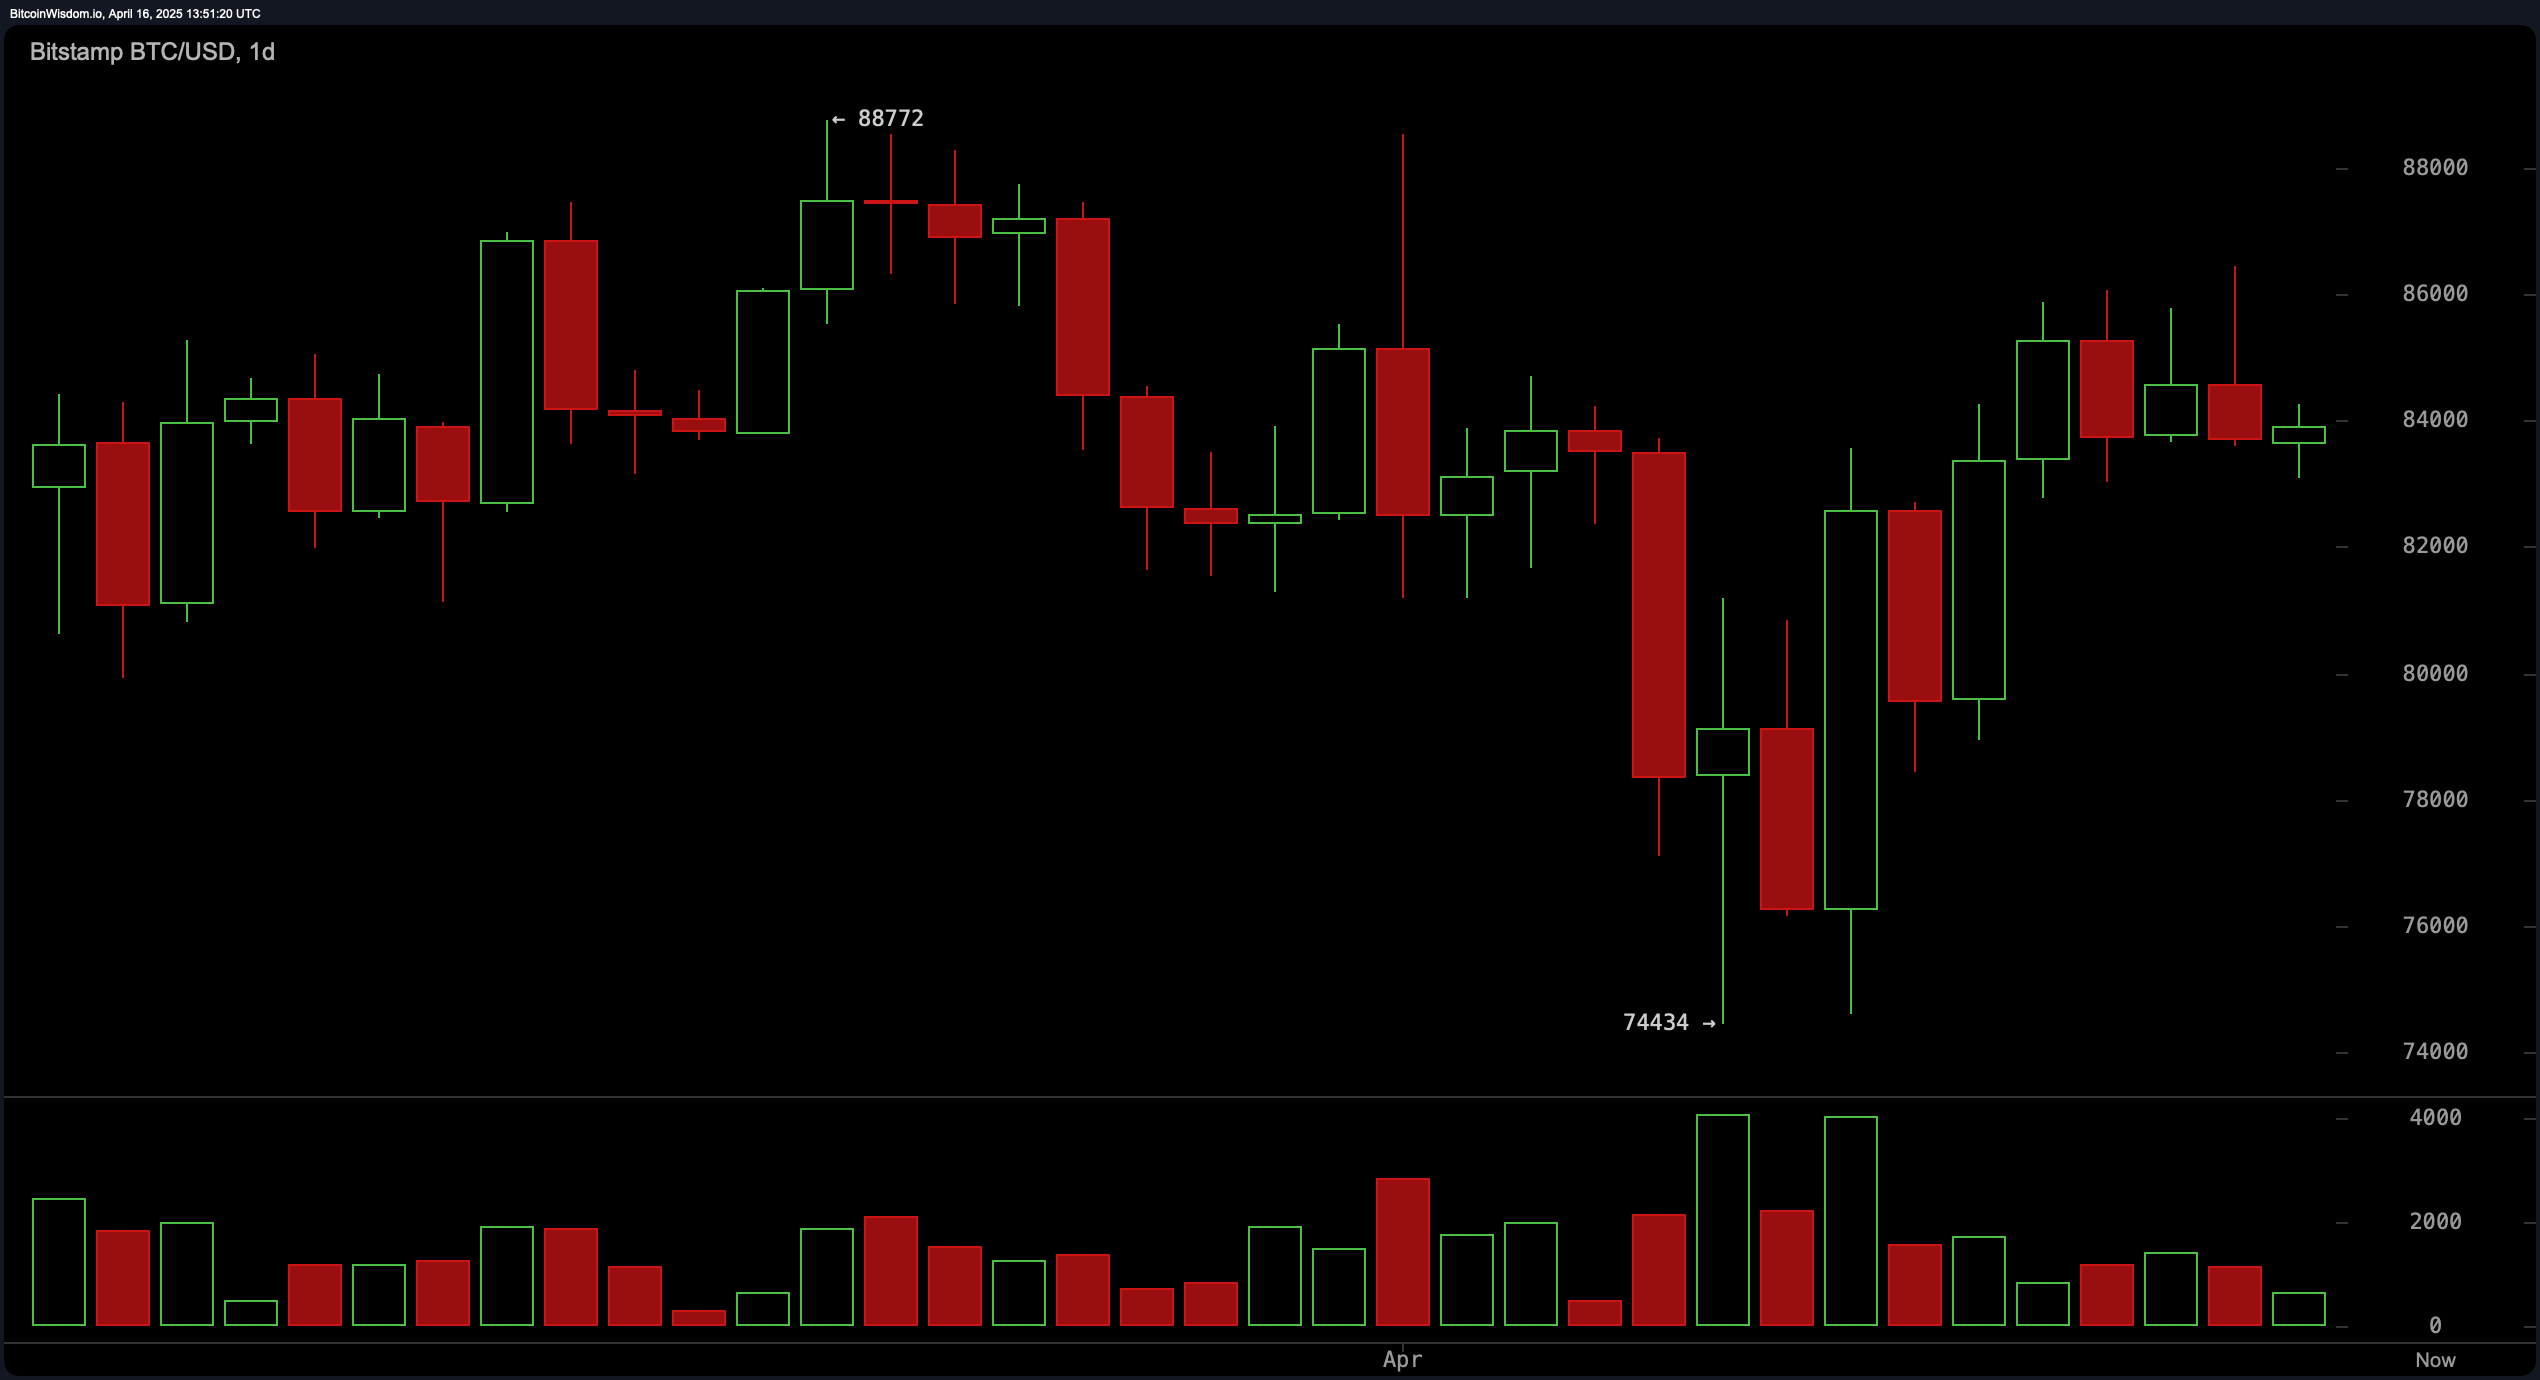
The daily chart presents a broader perspective, highlighting bitcoin’s medium-term recovery attempt from a swing low at $74,434. This was marked by capitulation volume, suggesting a strong support base. Prices have since rebounded, challenging the resistance band between $83,000 and $85,000. The current consolidation near $84,000 suggests the market is deciding its next move — whether to test the $87,000 zone or pull back to retest $78,000 support. A higher low appears to be forming, potentially marking the early stages of a longer-term bullish reversal if the resistance band is overcome with volume support.

Bitcoin Price Watch: Key Resistance at $84.5K Holds the Line in Tight Trading Range

BTC/USD via Bitstamp daily chart on April 16, 2025.

Momentum indicators and oscillators from the daily chart highlight the neutral stance of the market. The relative strength index (RSI), Stochastic oscillator, commodity channel index (CCI), average directional index (ADX), and awesome oscillator all signal neutrality. Meanwhile, momentum and the moving average convergence divergence (MACD) both suggest a buy, hinting at a slight bullish undertone. This mixed picture implies the market is coiled, with momentum building beneath the surface but yet to resolve decisively in either direction.

Moving averages (MAs) show a nuanced view across different timeframes. Short-term signals from the 10-day and 20-day exponential moving averages (EMA) and simple moving averages (SMA) point to a bullish bias, all indicating positive signals. However, longer-term indicators, including the 50-day, 100-day, and 200-day EMA and SMA, all signal bearishness, reflecting overhead resistance and possible downward pressure from earlier trends. The divergence between short-term bullishness and long-term caution frames a classic battleground scenario — reinforcing the importance of volume-confirmed breakouts for directional bias.

Bull Verdict:

If bitcoin successfully breaks above the $84,500 level with rising volume and maintains price action above $85,000, bullish momentum is likely to accelerate. The confluence of short-term buy signals from key exponential and simple moving averages supports a potential move toward $87,000 and beyond, especially if a higher low confirms on the daily chart.

Bear Verdict:

If bitcoin fails to reclaim $84,500 and instead breaks below the $83,000 support zone, selling pressure could intensify. With medium- and long-term moving averages still favoring downside and the four-hour structure displaying consistent lower highs, a return to the $81,500 or even $78,000 levels remains a realistic bearish scenario.

免责声明:本文章仅代表作者个人观点,不代表本平台的立场和观点。本文章仅供信息分享,不构成对任何人的任何投资建议。用户与作者之间的任何争议,与本平台无关。如网页中刊载的文章或图片涉及侵权,请提供相关的权利证明和身份证明发送邮件到support@aicoin.com,本平台相关工作人员将会进行核查。

Gate:注册解锁$6666
Ad
Share To
APP

X

Telegram

Facebook

Reddit

CopyLink