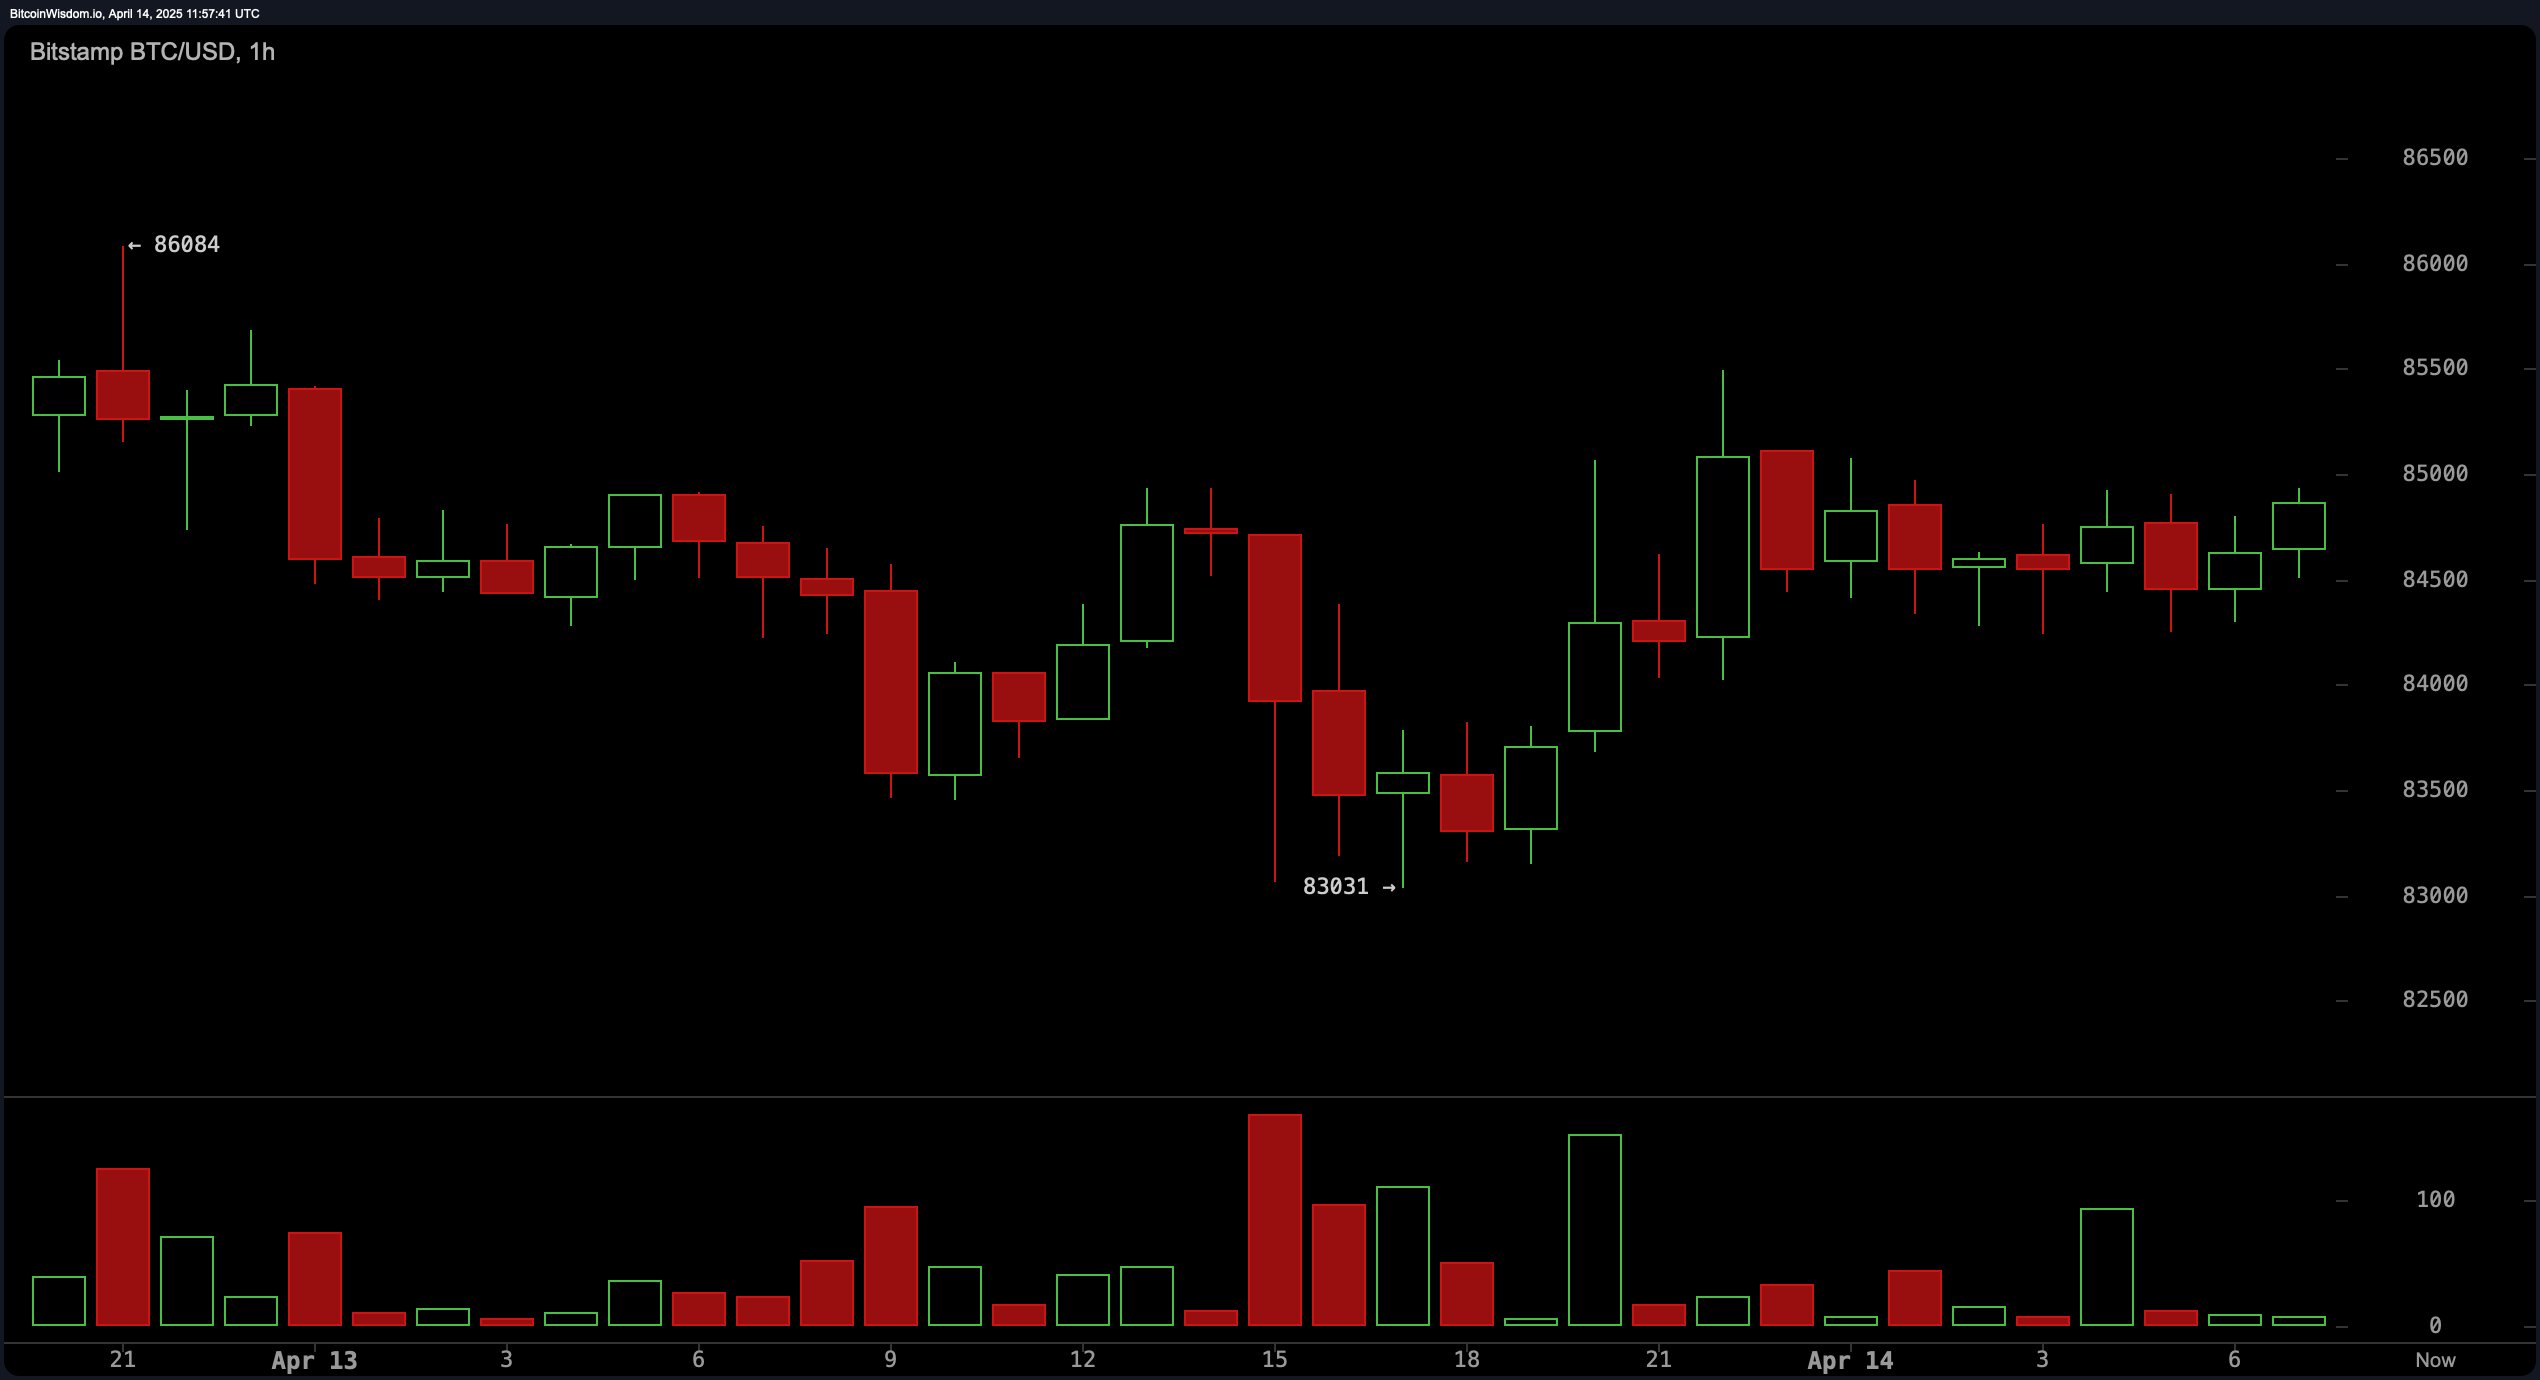
The market structure for bitcoin on April 14, 2025, reveals a cautious yet optimistic tone driven by mixed technical signals across multiple timeframes. The 1-hour chart displays consolidation between $83,000 and $85,000, with bitcoin recently rebounding from a brief dip to $83,031, affirming short-term support. However, the presence of red volume spikes suggests the possibility of transient pullbacks, highlighting market indecision in the immediate term. A bounce supported by volume in the $83,500 to $84,000 range could provide a viable entry, while a drop below $83,000 may trigger downside risk.
BTC/USD 1H chart via Bitstamp on April 14, 2025.
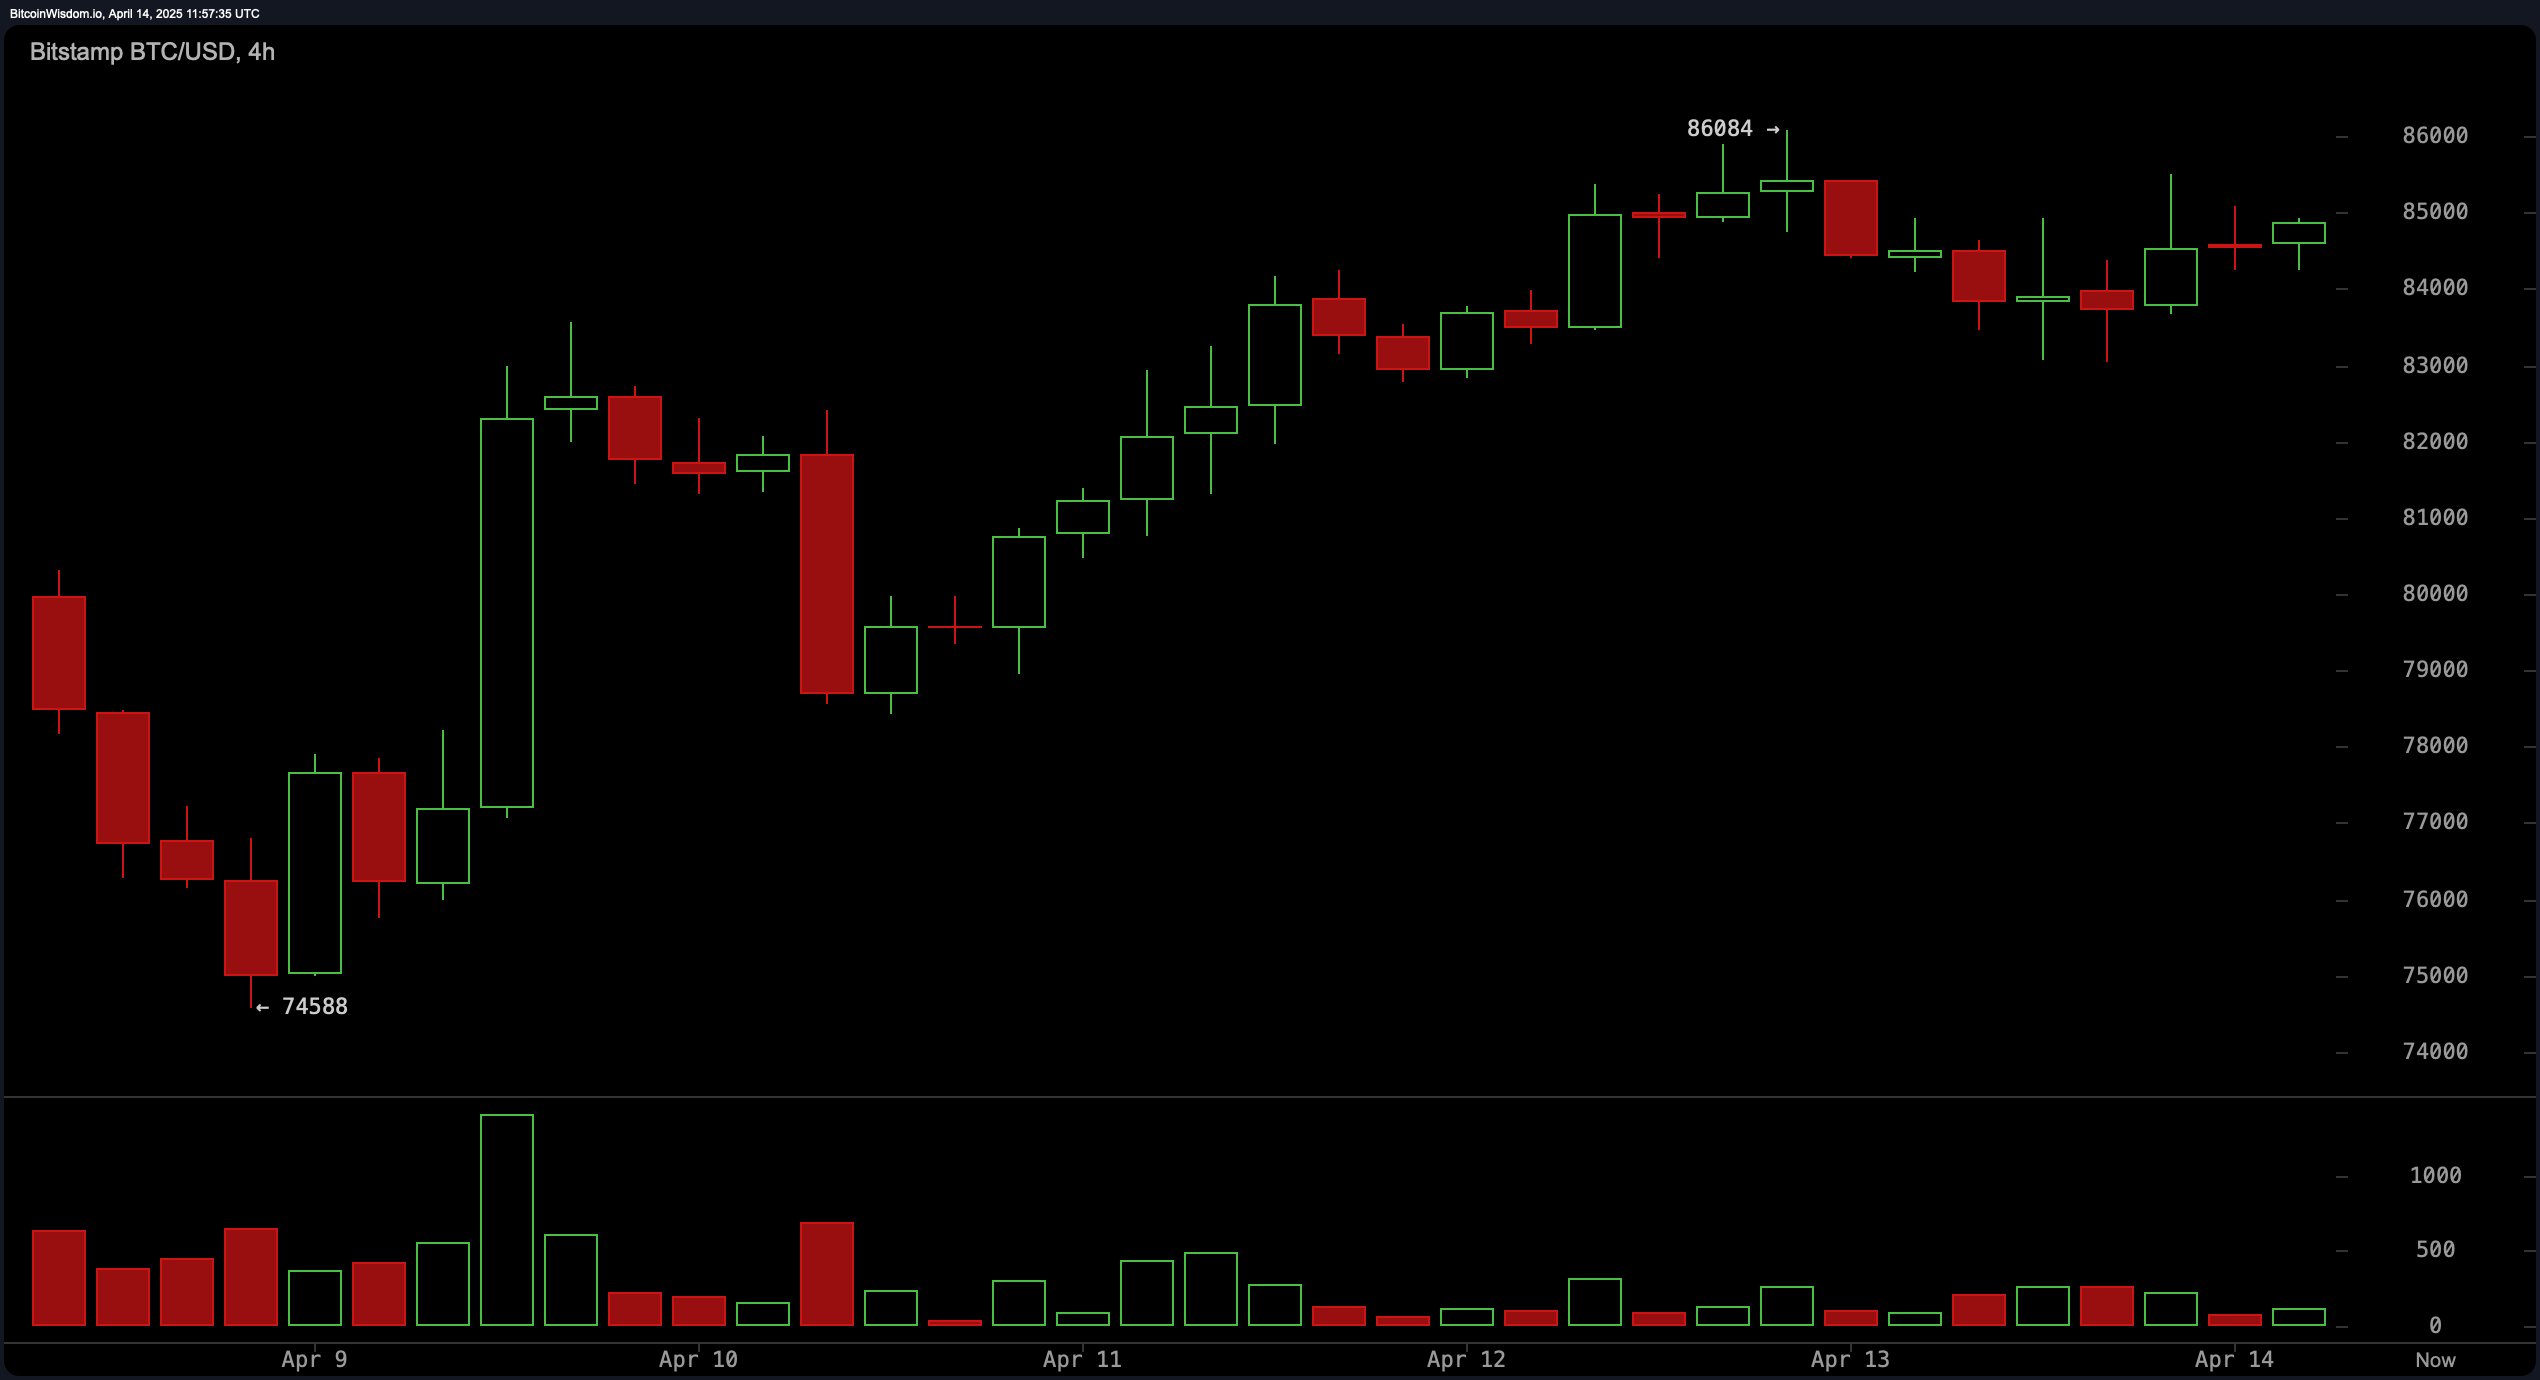
The 4-hour chart paints a more bullish narrative, reflecting a sustained uptrend since April 8, when bitcoin rebounded from approximately $74,588 to a recent peak of $86,084. The structure features orderly pullbacks, followed by upward continuation, though recent candles are forming on lighter volume—indicative of either consolidation or potential buyer fatigue. Should bitcoin reclaim and hold above $85,500 on strong volume, it could open a path to retest $86,000 or higher. Conversely, a failure to maintain support at $83,000 may initiate a broader retracement to $80,000.
BTC/USD 4H chart via Bitstamp on April 14, 2025.
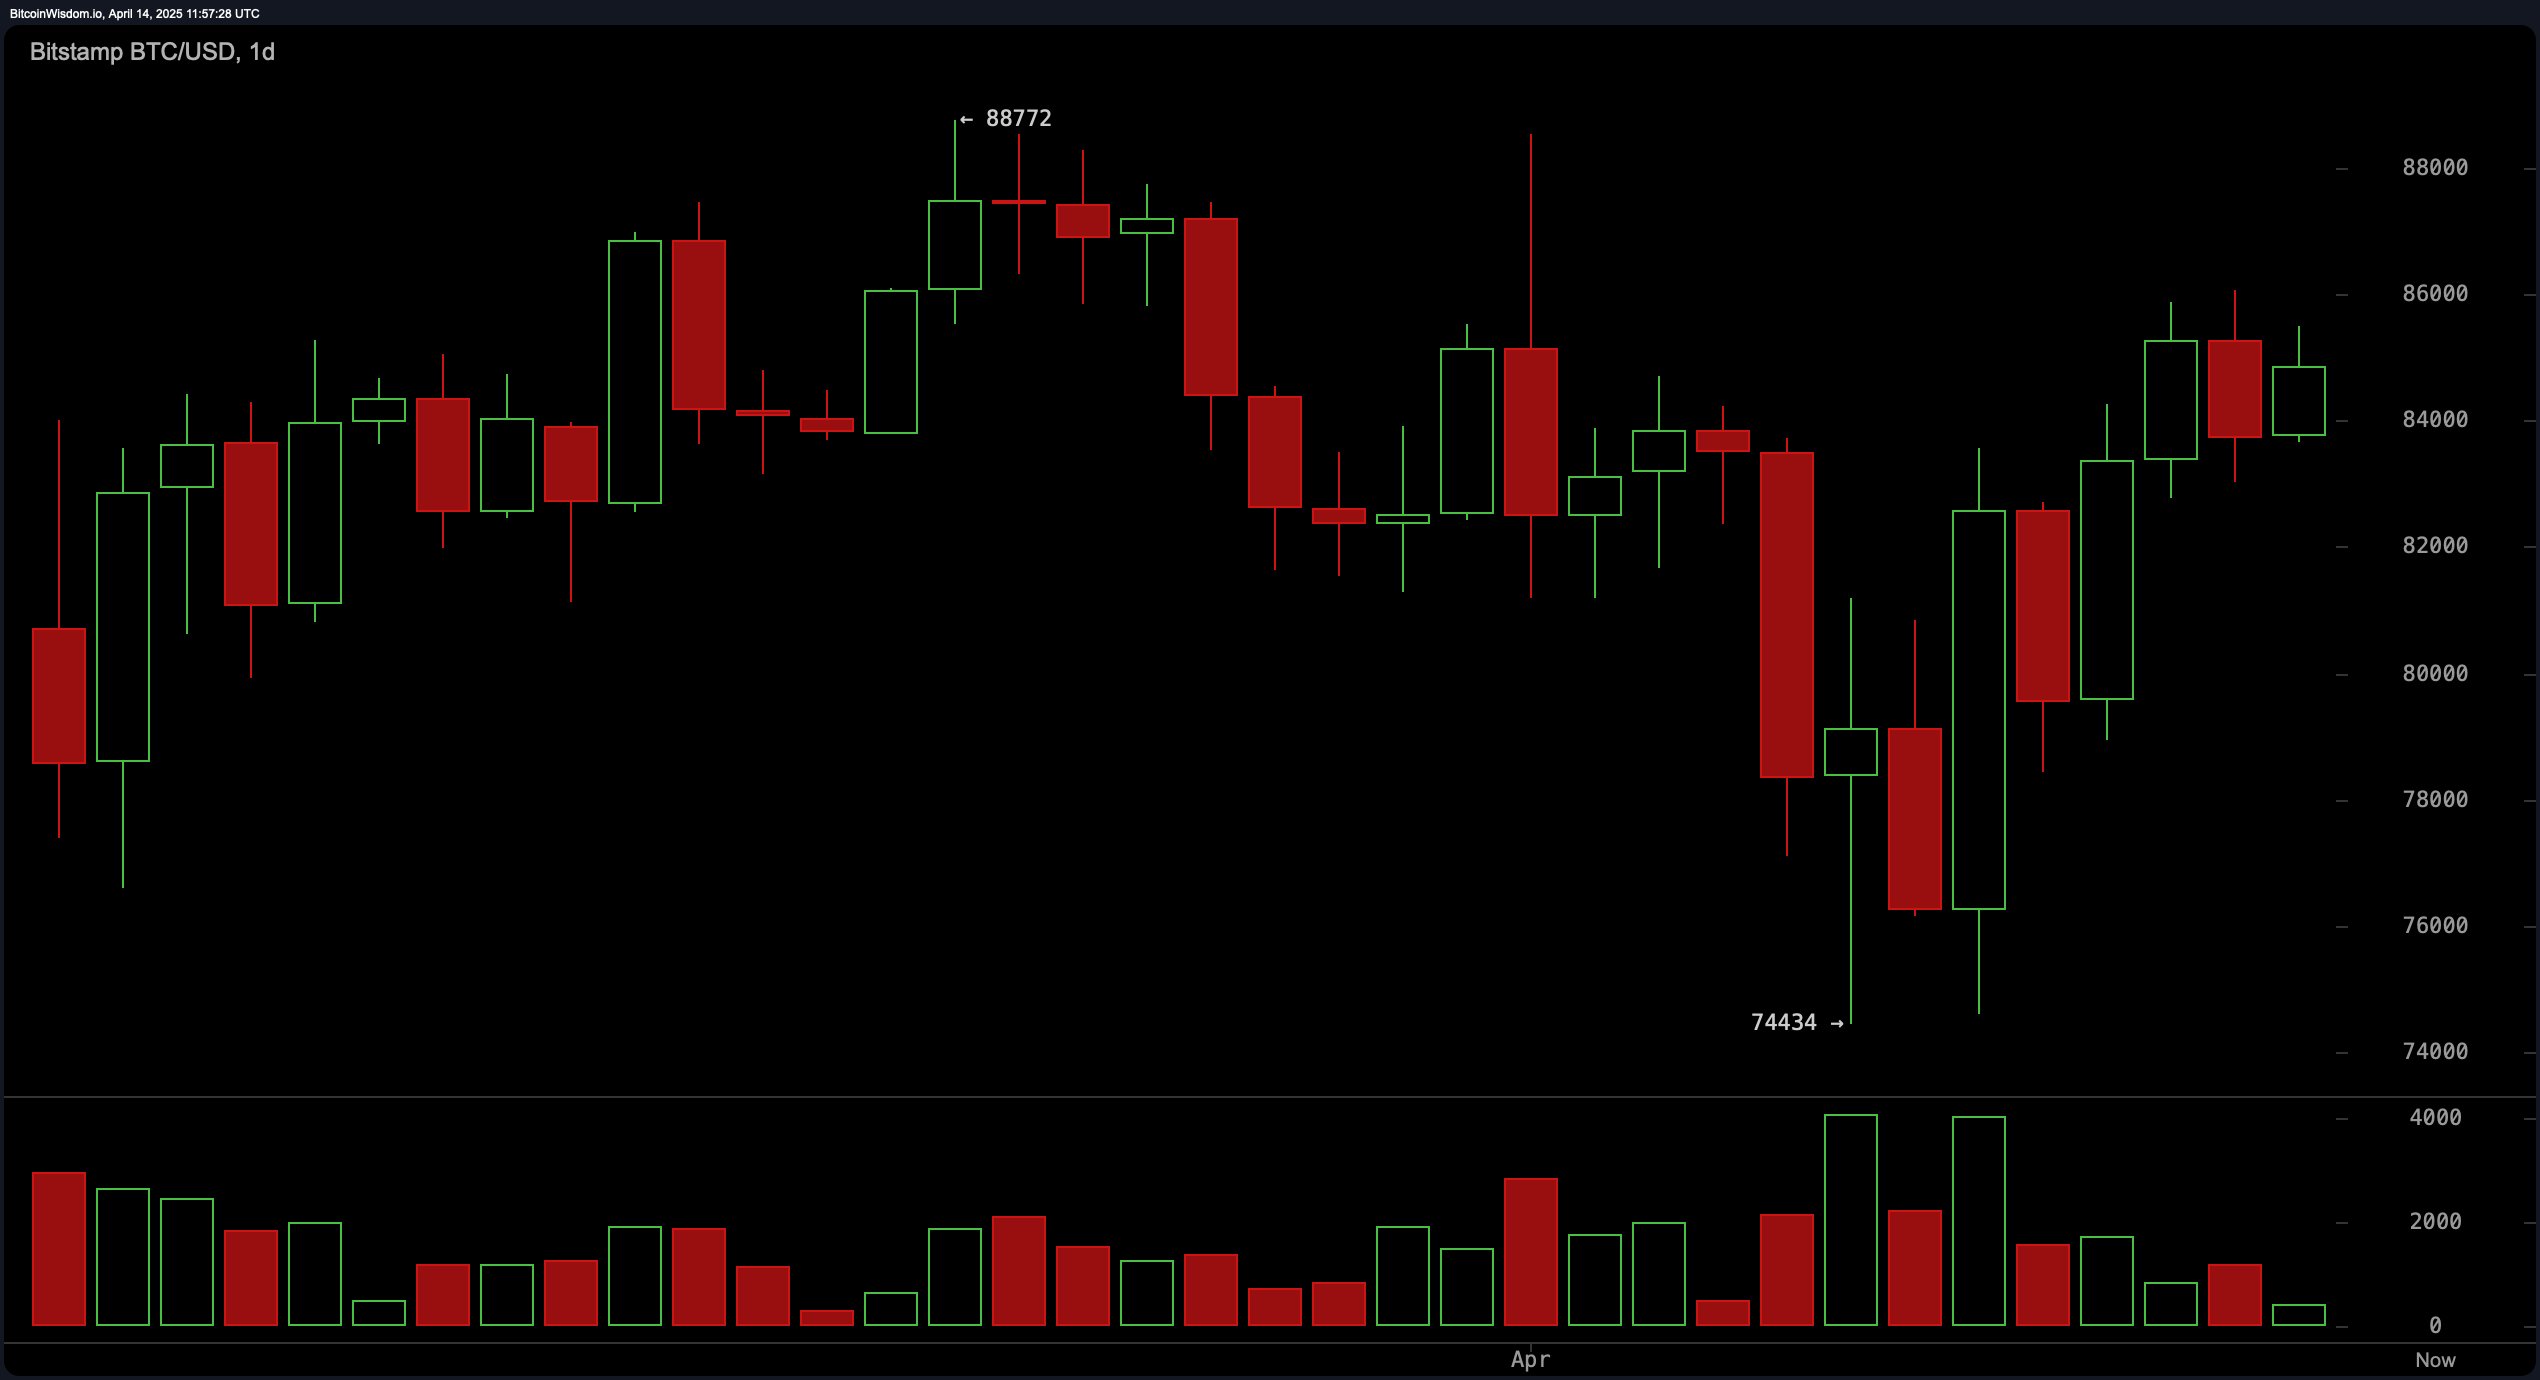
From a daily chart perspective, bitcoin appears to be staging a recovery from its $74,434 support zone. Long bullish candlesticks with increasing volume suggest accumulating interest, yet the broader trend still fits within a lower-high formation—reflecting lingering macro uncertainty. A daily close above $85,000, backed by significant volume, would offer technical validation for a breakout from its recent consolidation range, potentially targeting resistance near $88,000. Until then, the current setup favors selective entries near key support levels.
BTC/USD 1D chart via Bitstamp on April 14, 2025.
Technical indicators across oscillators and moving averages present a mostly neutral to cautiously bullish picture. Oscillators such as the relative strength index (RSI), Stochastic, commodity channel index (CCI), average directional index (ADX), and awesome oscillator all indicate neutral signals. However, the momentum indicator suggests a buy, and the moving average convergence divergence (MACD) also aligns with a buy stance, despite its negative level of −606. These mixed signals reinforce the narrative of a market in transition rather than one firmly trending.
The moving averages add further nuance. Short-term trends remain positive, with both exponential moving averages (EMA) and simple moving averages (SMA) for 10, 20, and 30 periods all flashing buy signals. Yet, a divergence arises in the longer-term outlook. The 50-period EMA gives a sell signal, even as the 50-period SMA suggests a buy. More definitively bearish signals emerge from the 100- and 200-period EMAs and SMAs, which uniformly recommend selling. This divergence between short- and long-term signals underscores the importance of breakout validation through volume, especially if bitcoin is to sustain a rally toward or beyond the $88,000 level.
Bull Verdict:
If bitcoin sustains support above $83,000 and breaks decisively above $85,500 on rising volume, bullish momentum could carry the price toward $88,000 and beyond. The positive signals from short-term moving averages and buy indicators from the momentum and moving average convergence divergence (MACD) lend weight to the potential for a continued upward breakout.
Bear Verdict:
Should bitcoin fail to hold the $83,000 level, particularly under increasing sell volume, the current consolidation may turn into a deeper retracement toward $80,000 or lower. The bearish signals from the longer-term exponential moving averages (EMA) and simple moving averages (SMA), combined with neutral oscillators, indicate that upward traction remains fragile and vulnerable to reversal.
免责声明:本文章仅代表作者个人观点,不代表本平台的立场和观点。本文章仅供信息分享,不构成对任何人的任何投资建议。用户与作者之间的任何争议,与本平台无关。如网页中刊载的文章或图片涉及侵权,请提供相关的权利证明和身份证明发送邮件到support@aicoin.com,本平台相关工作人员将会进行核查。