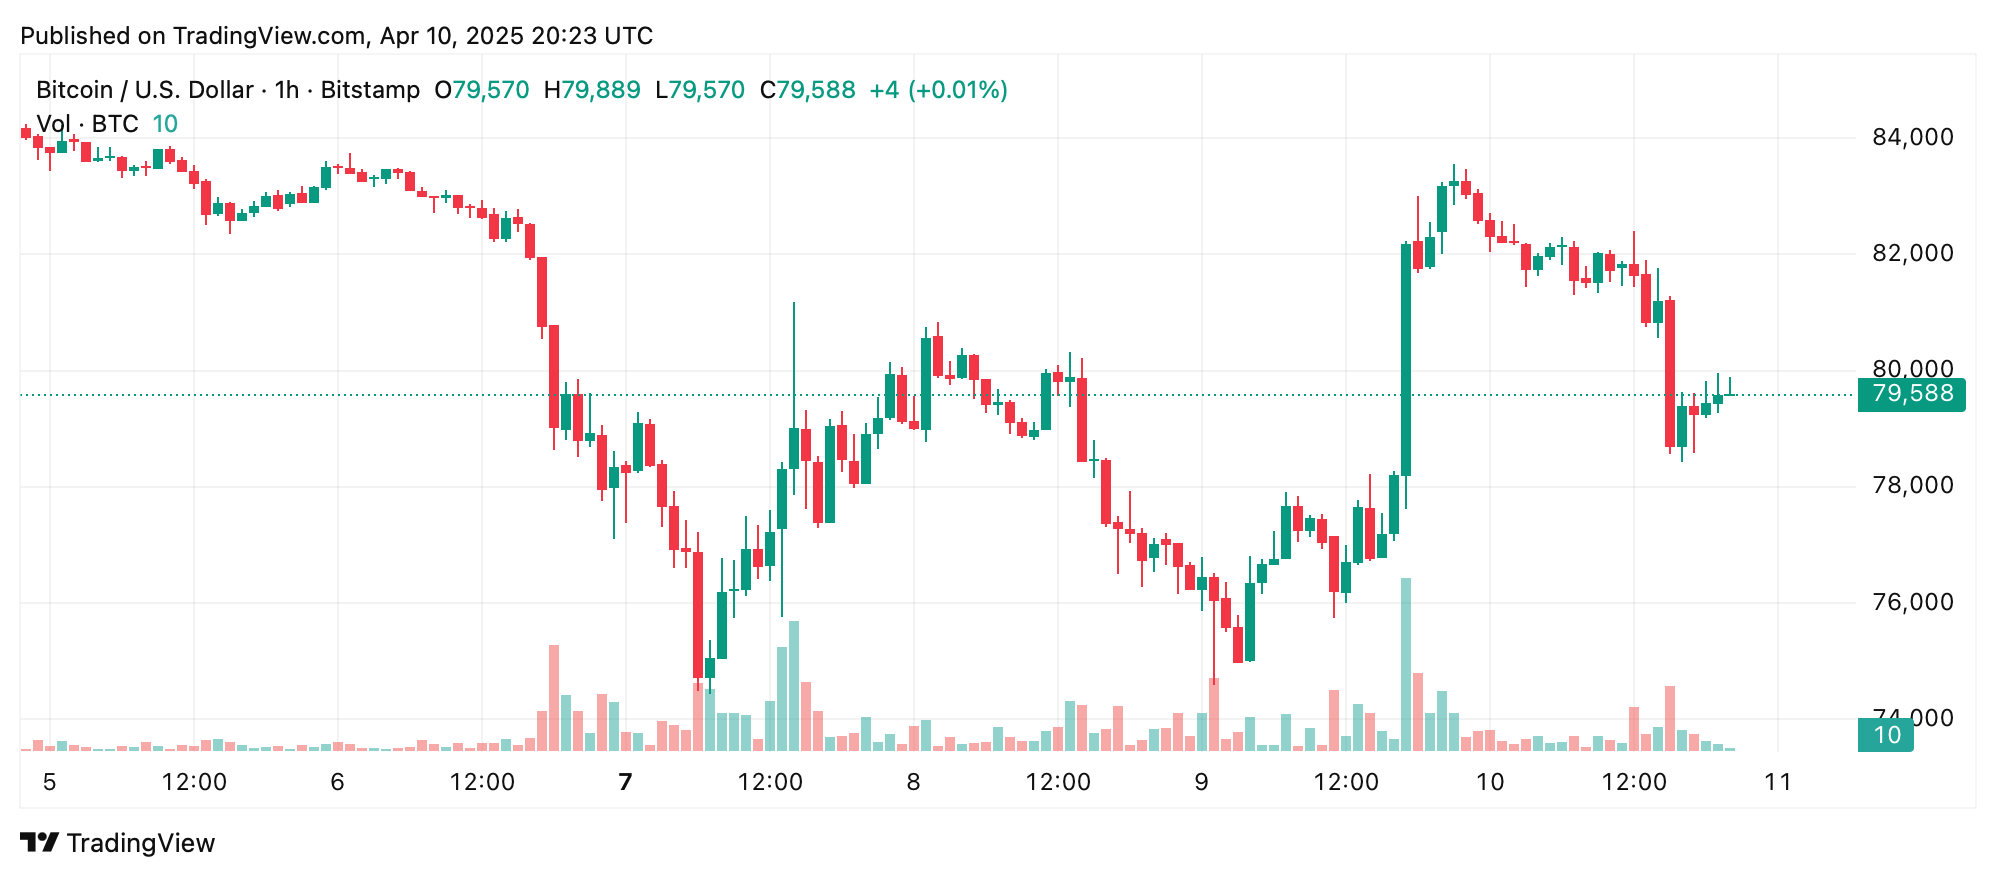
On the 1-hour chart, bitcoin has exhibited a short-term bullish bias following a recovery from a recent low of $74,434. This micro-trend has developed through a series of higher highs and lows, with the price now consolidating around the $79,000 zone. Bullish momentum appears to be building, with high-volume green candles suggesting aggressive buyer activity. The structure hints at a potential flag or pennant pattern, often preceding continuation rallies. A breakout above $80,200 on volume would likely confirm bullish strength, with a projected exit target around $82,000. Conversely, a failure to hold above $78,000 could invite short-term bearish pressure.

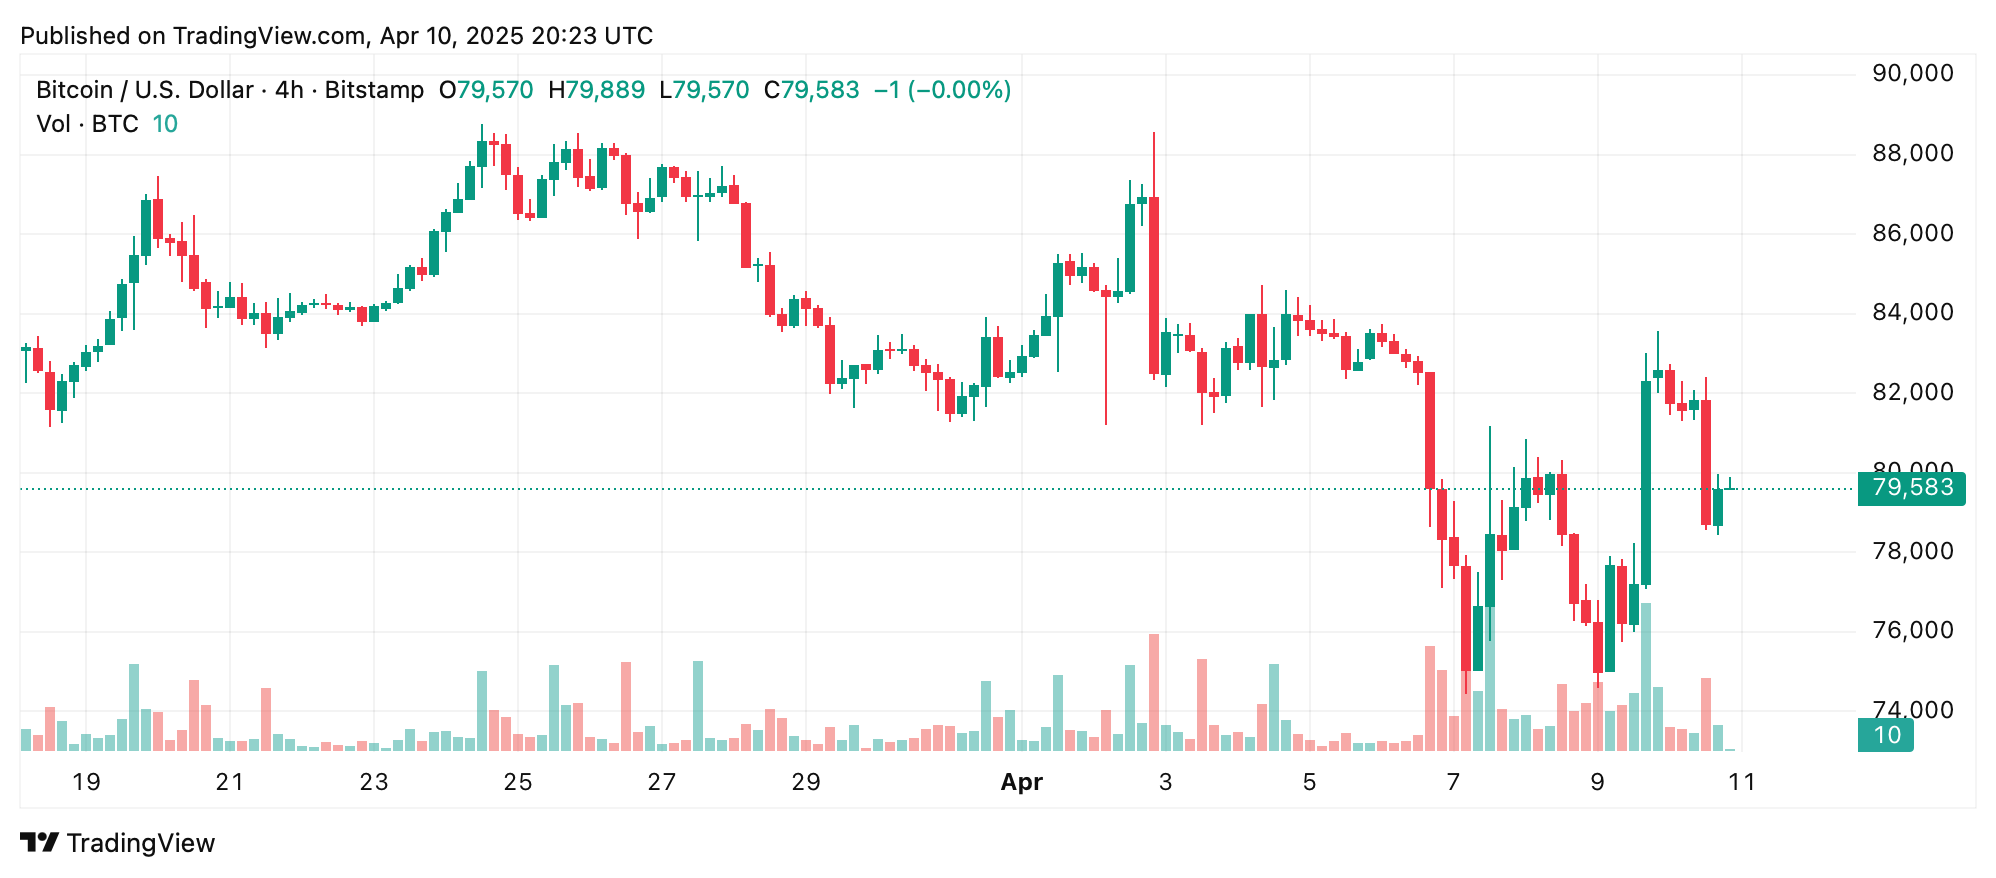
The 4-hour chart reveals a classic V-shaped recovery pattern from the same low of $74,434 to a recent high near $88,772. This sharp rebound followed a pronounced sell-off and indicates a potential short squeeze or return of institutional demand. The price has since found footing between $77,000 and $78,000, with multiple successful tests of support around $75,000. Short-term traders may find buying opportunities on pullbacks within this support zone, aiming for exits near the $82,000 to $83,000 resistance range. The surge in volume during the bounce reinforces the notion of renewed interest, though caution remains warranted until a decisive break above the $83,000 mark.

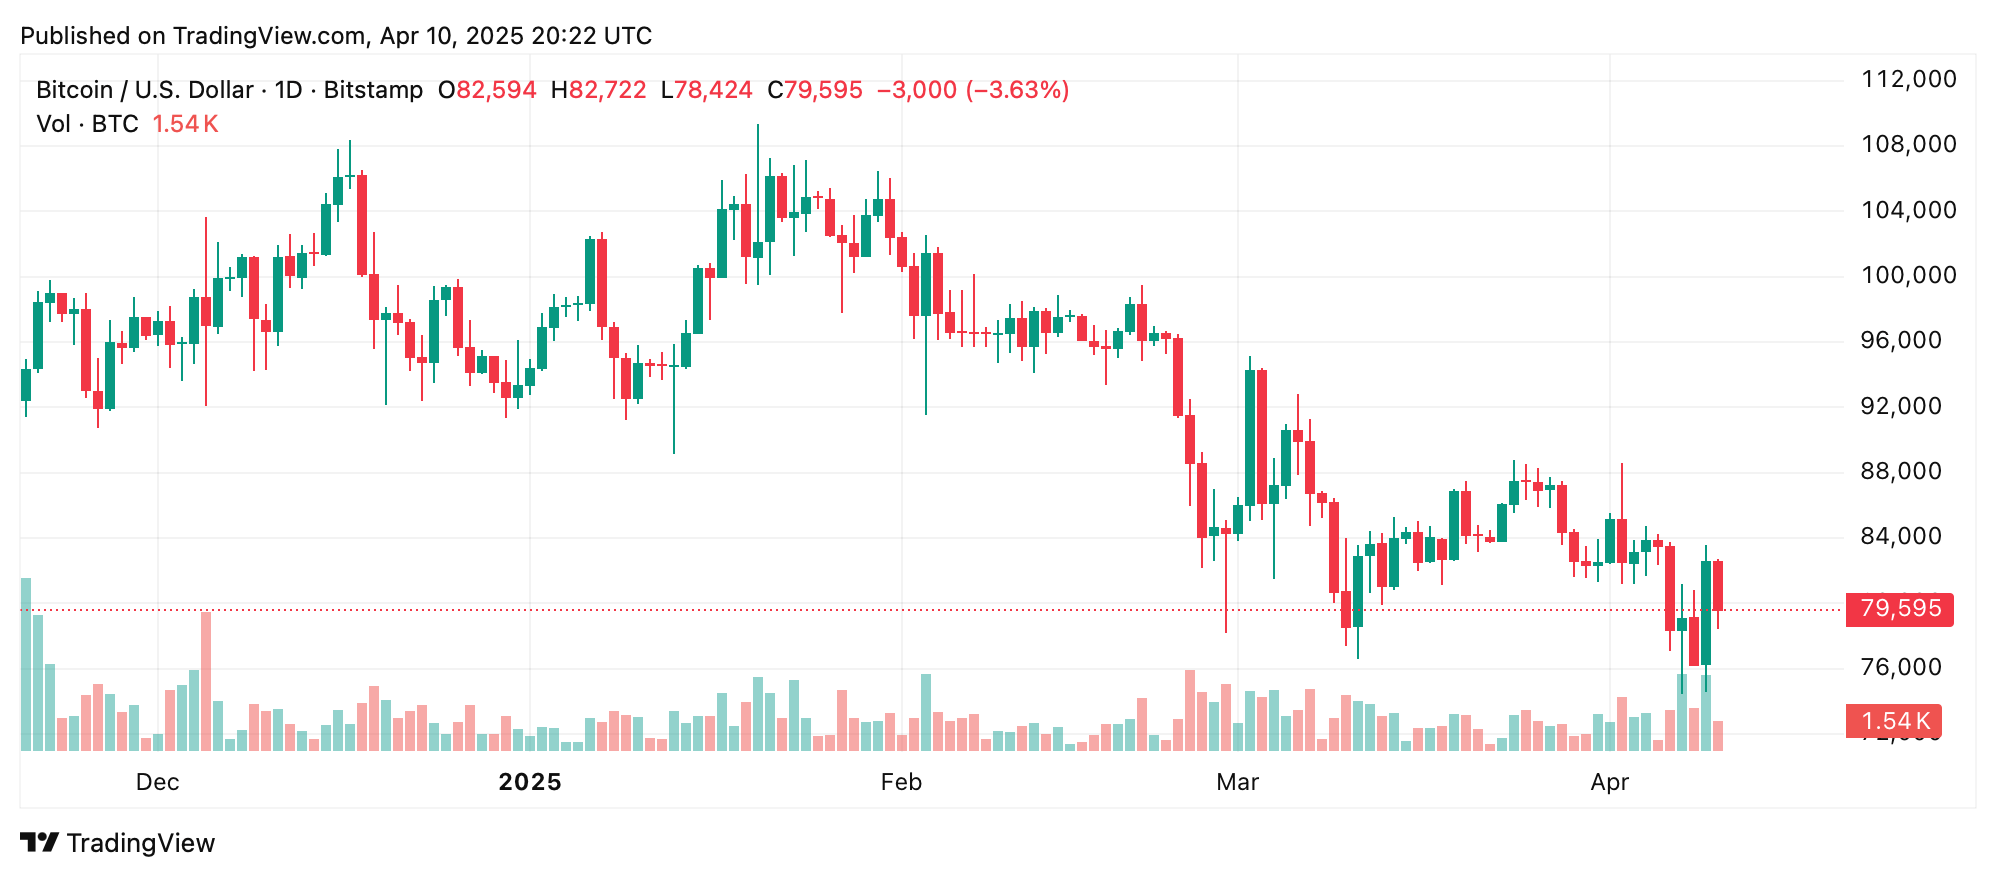
In the daily chart analysis, bitcoin’s broader trend remains bearish following a peak at $109,356 and a persistent downtrend since February. A recent low at $74,434 suggests that bitcoin may be testing a critical support level. Though the structure is still bearish, the recent bounce may represent the early stages of a potential reversal. Should bitcoin maintain levels above $75,000 and form higher low candles, bullish sentiment could gain traction. Swing traders are advised to monitor for a breakout above $82,000 with volume to initiate long positions, with exit targets set in the $88,000 to $90,000 zone. Any drop below $74,000, however, would invalidate the reversal thesis.

Among the daily chart’s oscillators, most indicators reflect a neutral stance, signaling a lack of clear momentum. The relative strength index (RSI) at 43, stochastic %K at 36, commodity channel index (CCI) at -90, average directional index (ADX) at 19, and awesome oscillator at -4,000 all suggest consolidation. However, the momentum indicator at -2,968 and the moving average convergence divergence (MACD) level at -1,749 both flash sell signals, highlighting underlying weakness in price momentum. This divergence between volume-led price action and oscillator behavior suggests that the market is at a technical inflection point.

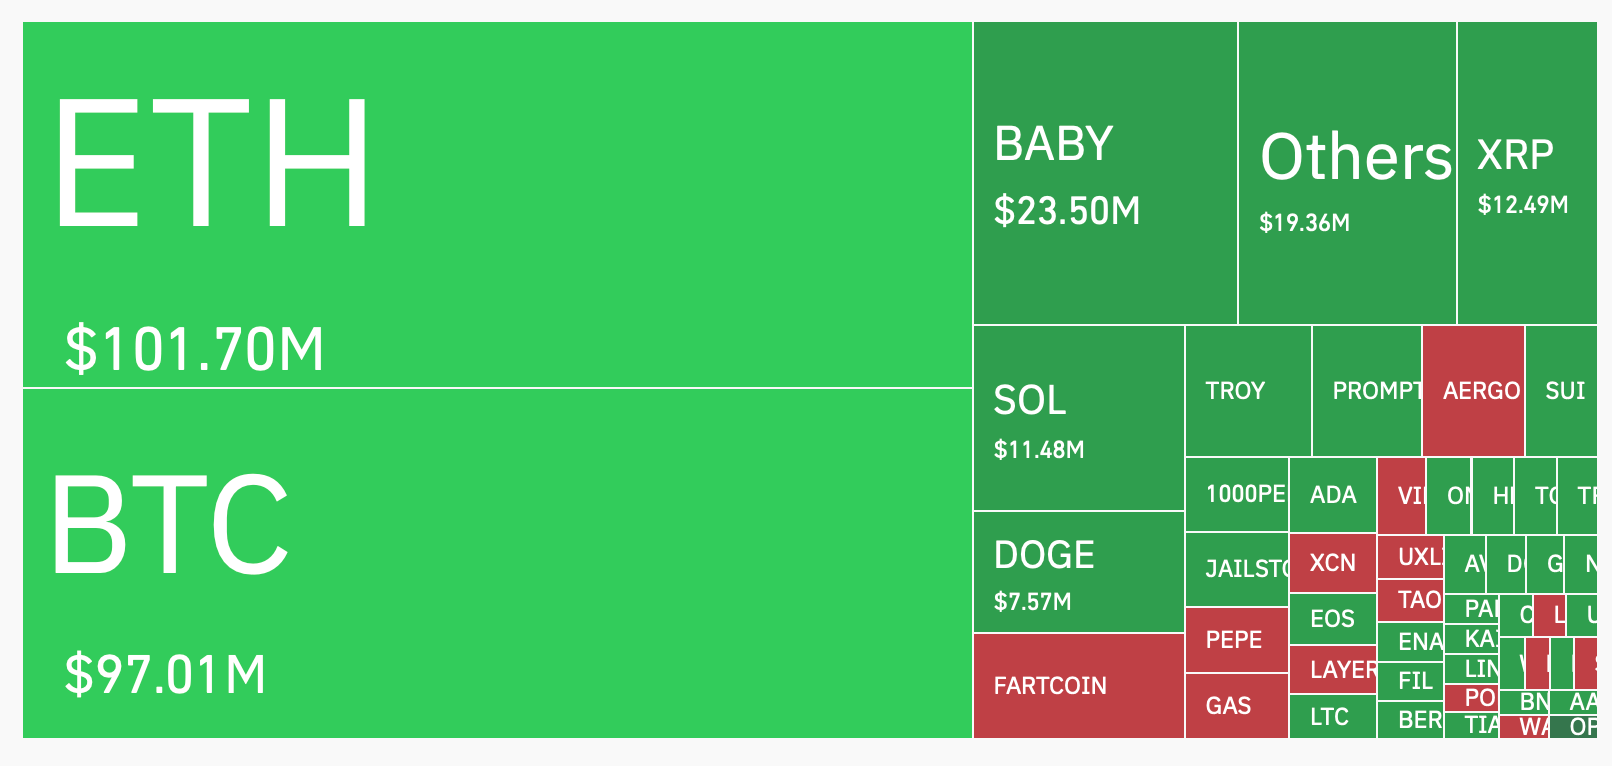
Crypto liquidations swept through derivatives markets on Apr. 10, 2025, as reflected in data from coinglass.com. An estimated $328.66 million in positions were liquidated, including $65.05 million in bitcoin longs that were wiped from the board, along with nearly $32 million in bitcoin shorts that met a similar fate.
Moving averages (MAs) remain broadly bearish across all timeframes. The 10-period exponential moving average (EMA) and simple moving average (SMA) are both above the current price at $81,032 and $81,406, respectively. The 20-period EMA at $82,400 and SMA at $83,246 further emphasize the downward pressure. Longer-term averages, including the 30-period EMA at $83,567 and SMA at $83,412, as well as the 50-period EMA at $85,725 and SMA at $85,443, continue to act as resistance. The 100-period and 200-period EMAs and SMAs—ranging from $85,067 to $92,195—suggest that bitcoin remains below significant trend thresholds, indicating that any bullish moves must overcome multiple resistance layers.
Fibonacci retracement levels across all timeframes provide additional insights into key technical levels. On the daily chart, retracement from the $109,356 high to the $74,434 low places the 61.8% golden ratio at $87,774 and the 50% midpoint at $91,895, forming strong resistance zones. On the 4-hour chart, the 61.8% retracement at $79,911 aligns closely with current price action, signaling a critical decision point for traders. The 1-hour chart reinforces this, with the 50% level at $79,431 and the 61.8% at $78,251 marking key battlegrounds. If bitcoin holds above these thresholds, a rally toward $82,000 to $85,000 remains plausible. A break below, however, risks re-testing support near $74,500.
Bull Verdict:
If bitcoin sustains momentum above the $78,250 to $79,900 Fibonacci support cluster and breaks decisively above $80,200 with volume, it could signal a short-term bullish reversal. A clean move past $82,000 would open the path toward the $85,000 to $88,000 resistance zone, validating bullish setups across intraday and swing timeframes. This scenario would suggest that recent buyer interest is strong enough to challenge broader downtrend dynamics.
Bear Verdict:
Should bitcoin fail to hold above $78,000 and breach the $74,434 support floor, it would confirm a continuation of the prevailing bearish structure. The lack of bullish confirmation from key oscillators and the persistent rejection from all major moving averages would then suggest further downside toward prior lows. In this scenario, short-term bounces may be sold into, and a retest of deeper support zones below $74,000 could follow.
免责声明:本文章仅代表作者个人观点,不代表本平台的立场和观点。本文章仅供信息分享,不构成对任何人的任何投资建议。用户与作者之间的任何争议,与本平台无关。如网页中刊载的文章或图片涉及侵权,请提供相关的权利证明和身份证明发送邮件到support@aicoin.com,本平台相关工作人员将会进行核查。


