Bitcoin Price Watch: $83K in Play as Market Stalls Below Resistance

CN
1 day ago

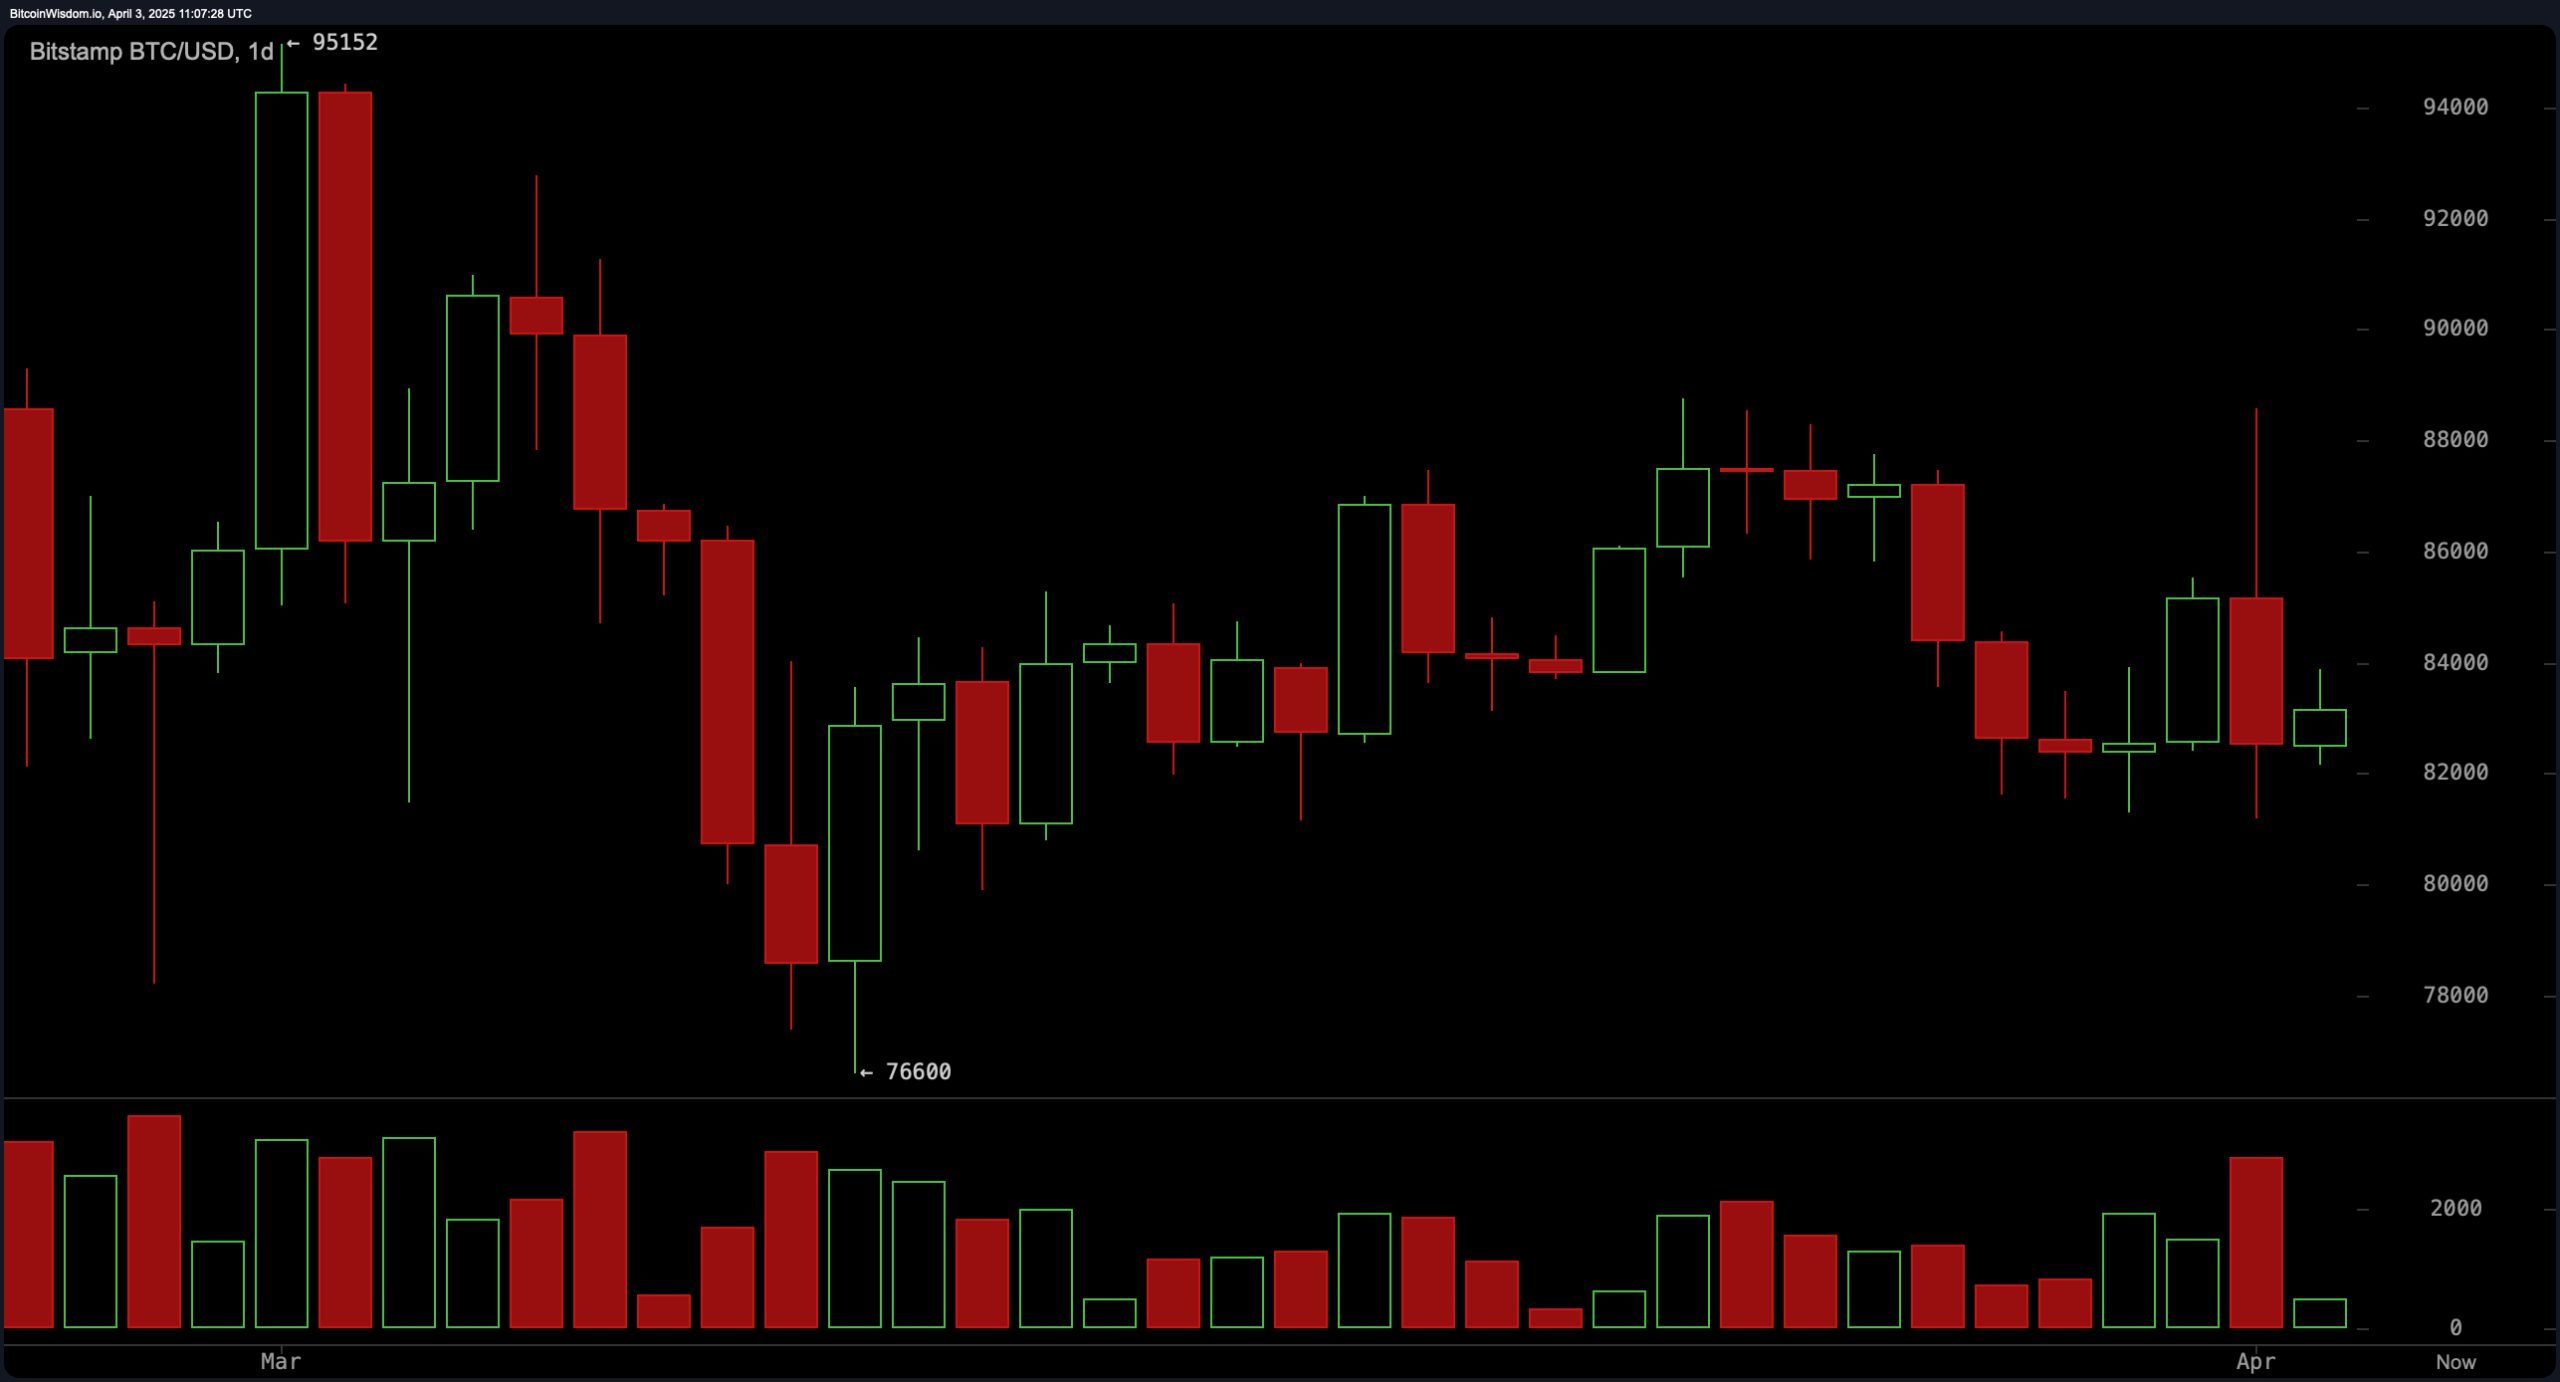
Across the daily chart, bitcoin’s trajectory reflected a recent peak near $94,000 followed by a notable retracement to approximately $81,000, suggesting a corrective phase in play. The subsequent recovery toward $84,000 indicated that buyers were still active near the lower boundary, particularly within the $81,000 to $82,000 support zone. However, the volume spike on the red candle underscored aggressive selling pressure, warning that a failure to maintain current levels could invite a deeper pullback. Resistance remains firm between $88,000 and $90,000, and traders should be vigilant if price action stalls or reverses near these levels.

Bitcoin Price Watch: $83K in Play as Market Stalls Below Resistance

BTC/USD 1D chart on April 3, 2025.

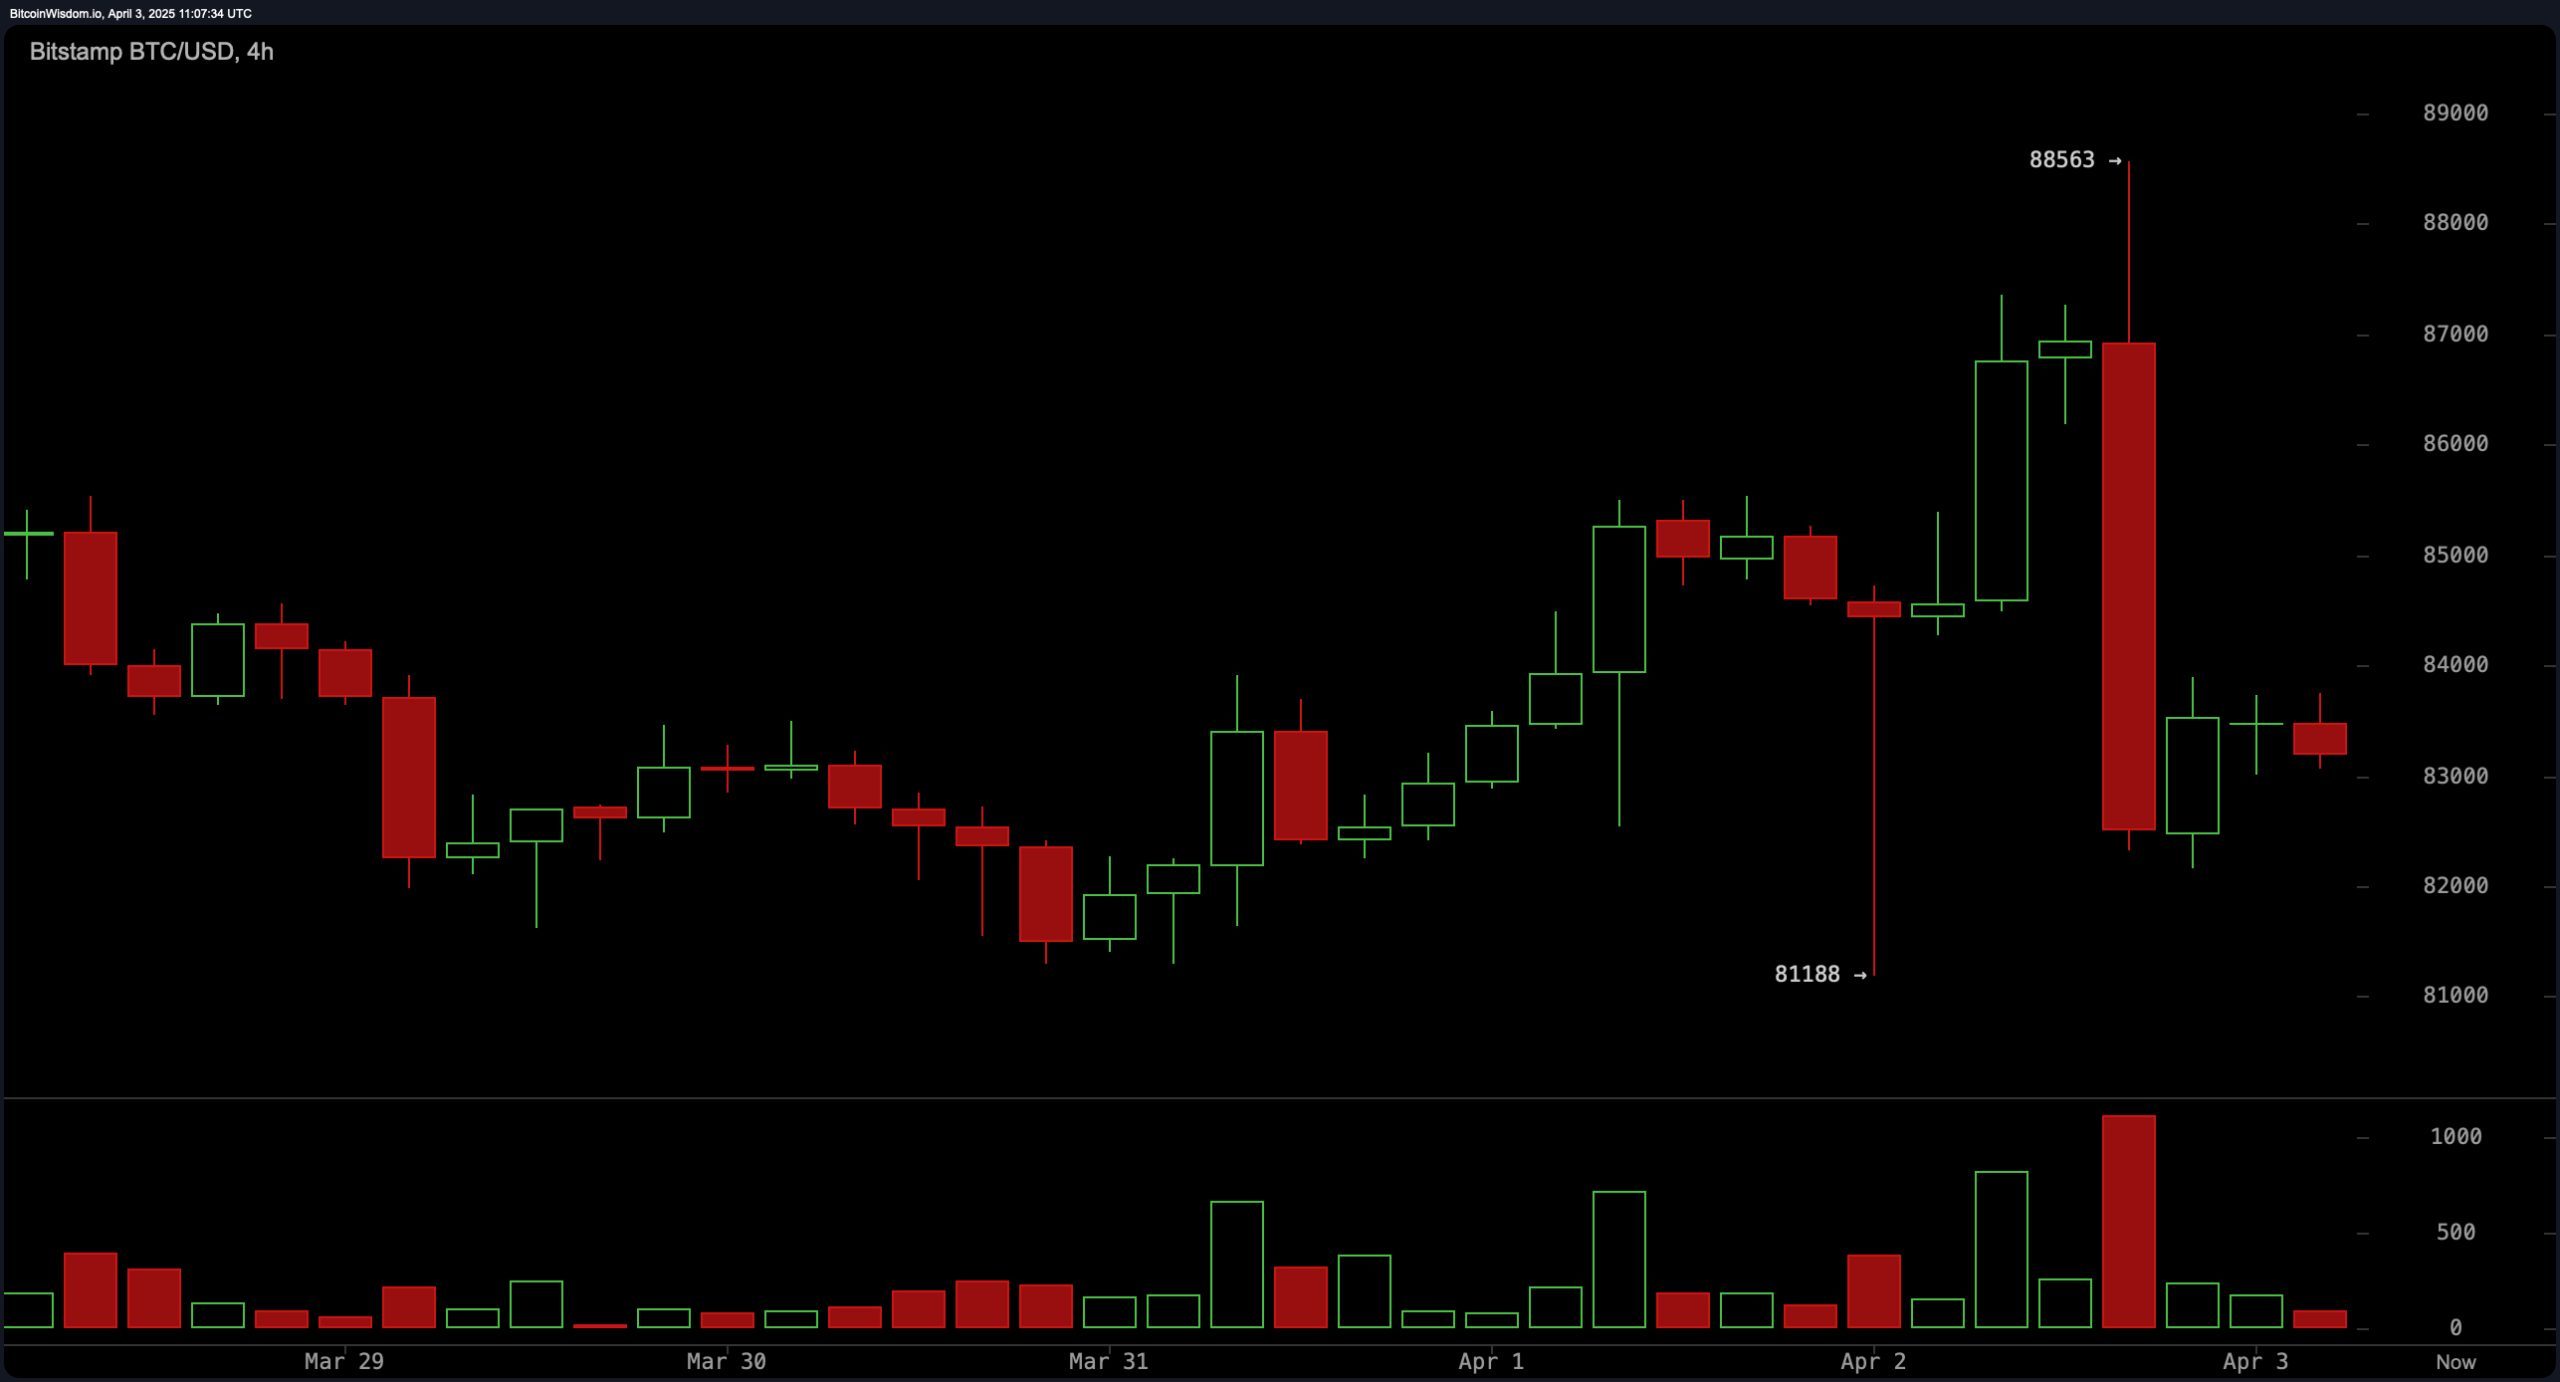
From the 4-hour chart perspective, bitcoin showed a clear rejection at $88,500 marked by a sharp wick and subsequent sell-off. The current price structure resides between $83,000 and $85,000, forming a tight consolidation band. Of note, a flash crash to $81,100 revealed strong buying interest, possibly tied to liquidity grabs or stop-hunting behavior by larger entities. Scalping opportunities exist, particularly on long setups near $82,000 to $83,000, provided confirmation from volume metrics, while resistance near $85,000 to $86,000 presents a potential short entry zone if upward momentum fails to sustain.

Bitcoin Price Watch: $83K in Play as Market Stalls Below Resistance

BTC/USD 4H chart on April 3, 2025.

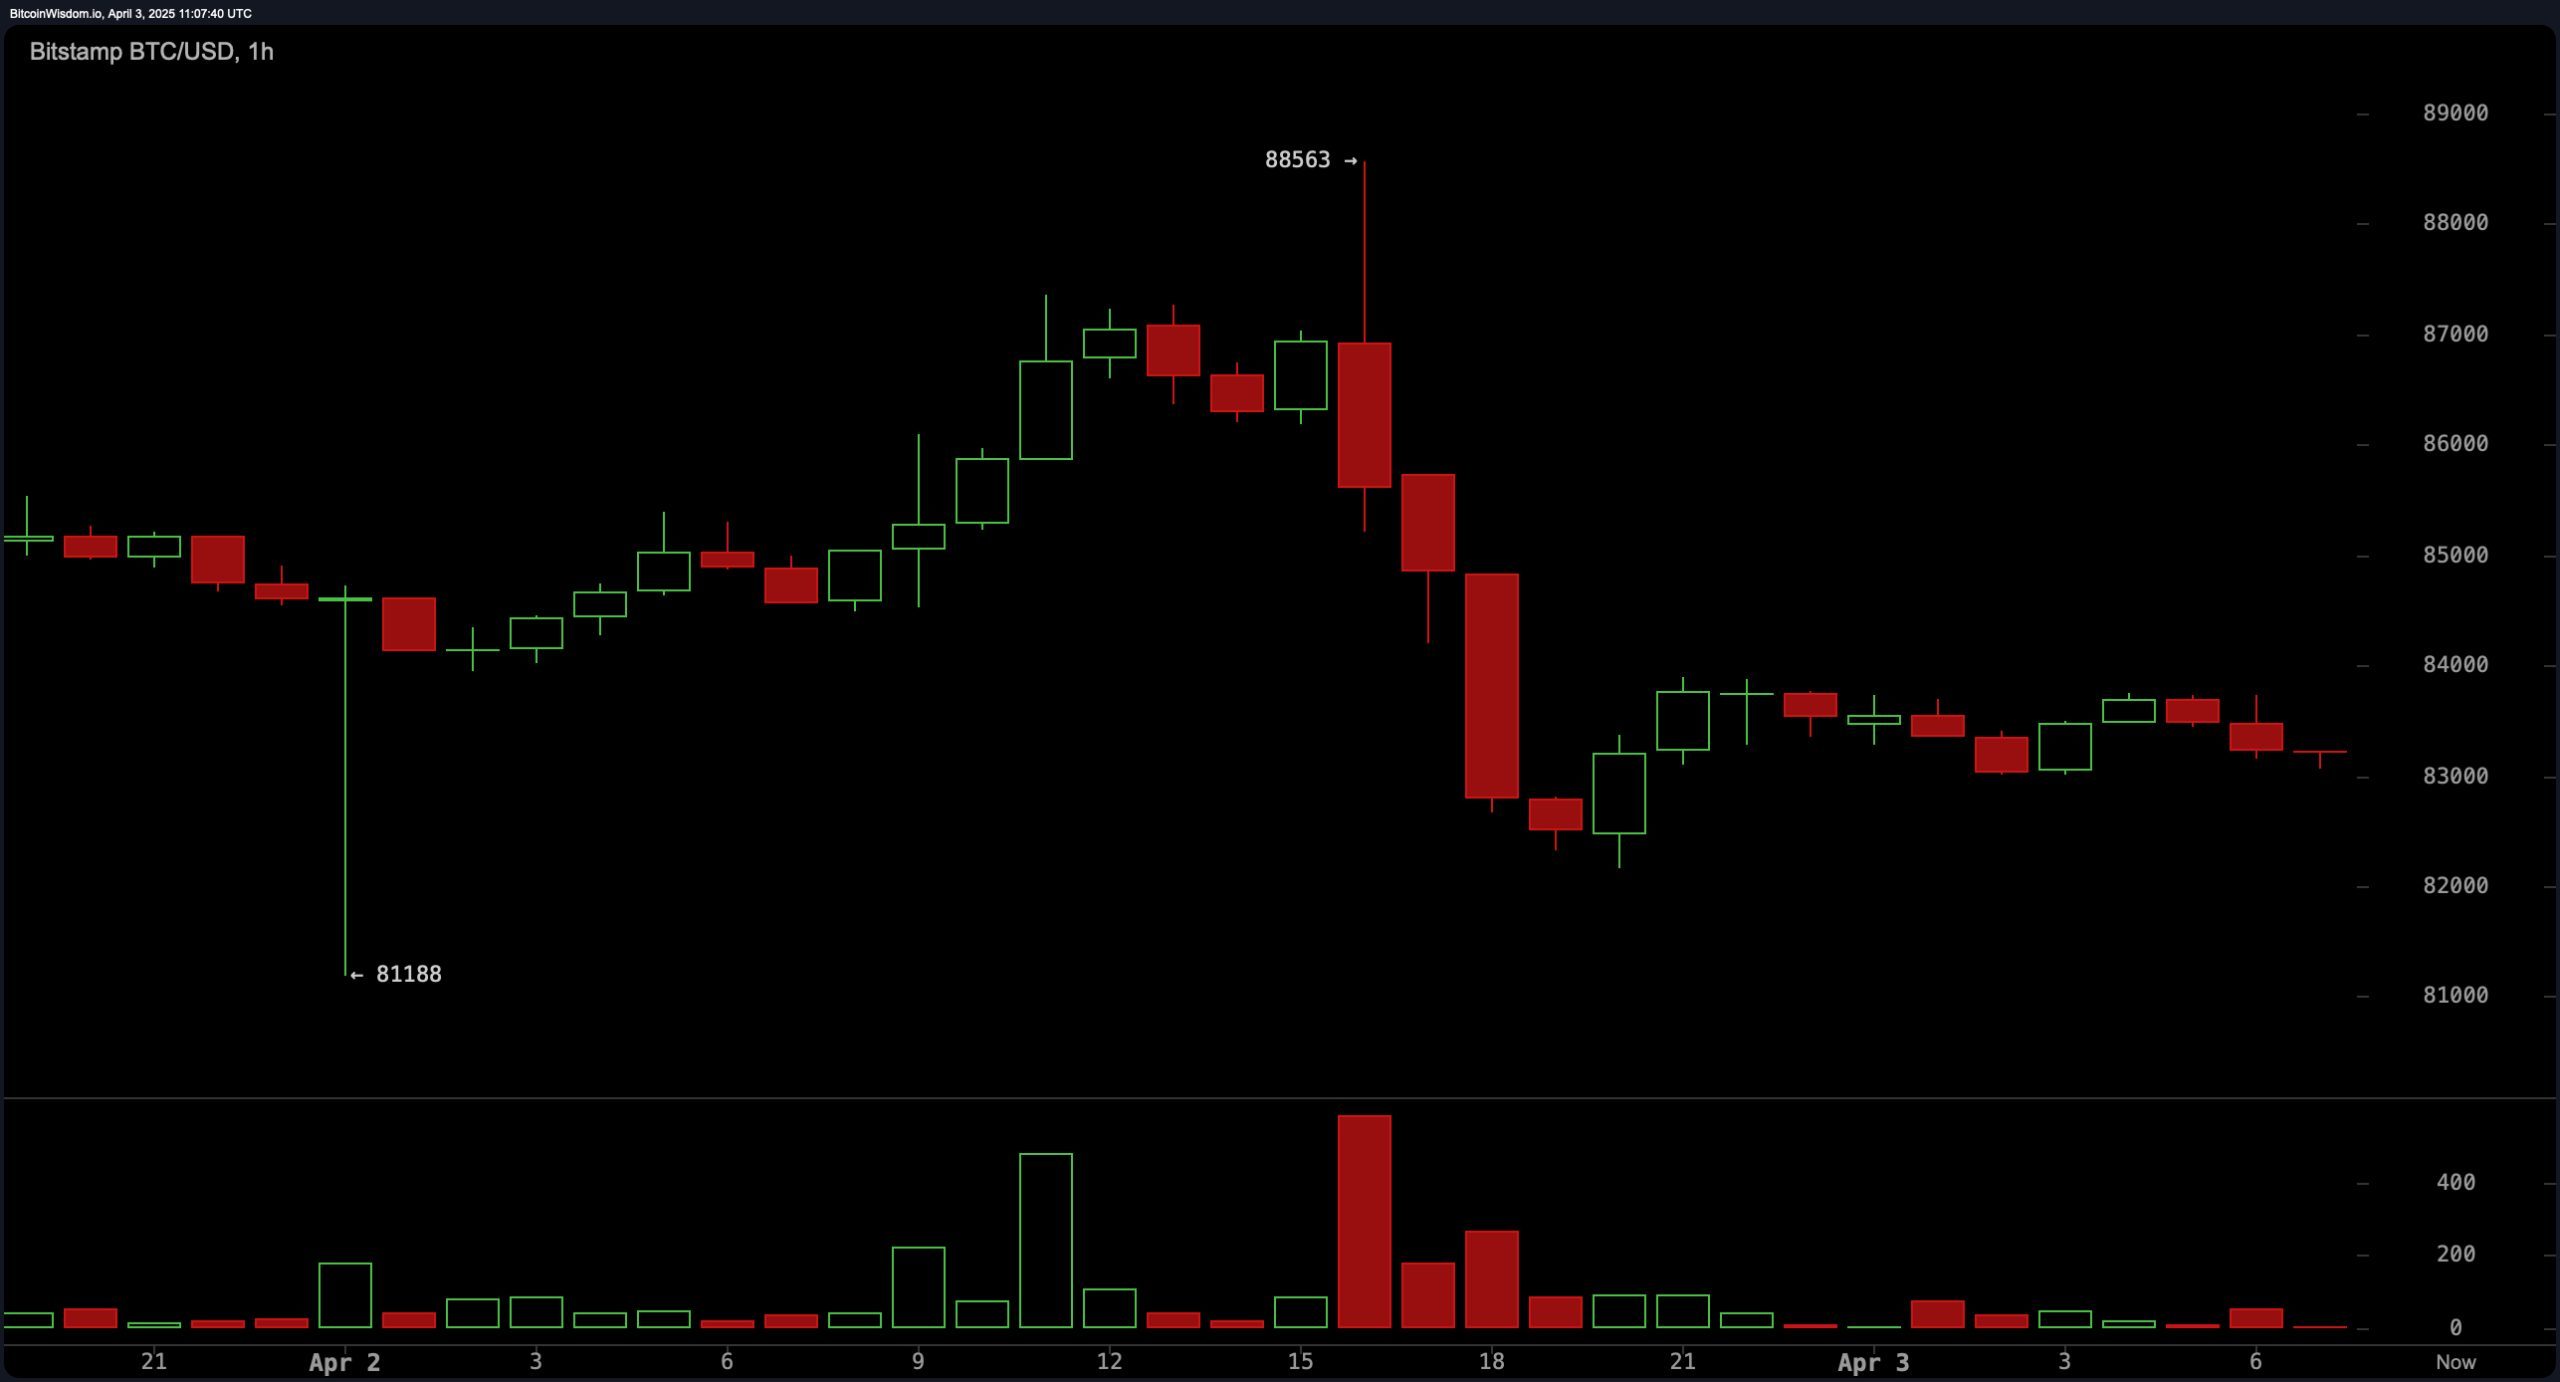
The 1-hour chart illustrates a pronounced stair-step decline following rejection at $88,500, with notable institutional-sized red volume confirming bearish sentiment. The price has attempted minor recoveries but continues to struggle around the $84,000 level, now forming a horizontal consolidation around $83,000. Short-term traders could look for a bullish signal—such as a double bottom or bullish engulfing candle—within the $82,500 to $83,000 zone. Any recovery would likely encounter overhead pressure near $84,500 to $85,000, aligning with short-term resistance and previous breakdown zones.

Bitcoin Price Watch: $83K in Play as Market Stalls Below Resistance

BTC/USD 1H chart on April 3, 2025.

In terms of technical indicators, oscillators presented a mixed-to-neutral sentiment. The relative strength index (RSI) at 45, Stochastic at 31, commodity channel index (CCI) at −75, average directional index (ADX) at 20, and awesome oscillator all read as neutral. The momentum oscillator registered a negative −4,420, reflecting a sell bias. Interestingly, the moving average convergence divergence (MACD) level was the lone buy indicator, printing −1,071, suggesting some underlying divergence or a pending reversal in momentum.

Moving averages, however, were universally bearish across all major timeframes. Both the exponential moving averages (EMA) and simple moving averages (SMA) for 10, 20, 30, 50, 100, and 200 periods all signaled a sell. With the 10-period EMA at $83,889 and SMA at $84,417—each above the current price—the trend remains under pressure. The long-term averages, such as the 200-period EMA at $85,402 and SMA at $86,410, further reinforce the prevailing downtrend, indicating sustained selling pressure and making any bullish breakout attempts difficult without a shift in volume and structure.

Bull Verdict:

For bulls, the key lies in defending the $81,000 to $83,000 support zone, which has historically attracted buyers across multiple timeframes. A confirmed reversal pattern such as a double bottom or bullish engulfing candle—paired with a bullish crossover in the moving average convergence divergence (MACD)—could trigger a short-term rally toward $85,000 and potentially retest the $88,000 to $90,000 resistance range. A breakout above that would signal renewed upside momentum.

Bear Verdict:

Bears retain control as long as bitcoin remains below the cluster of moving averages, all signaling a sell bias from short- to long-term trends. A decisive breakdown below the $81,000 support could invalidate bullish setups and open the path toward lower liquidity zones in the $78,000 to $76,000 range. Heavy red volume and repeated rejections near $84,000 to $85,000 suggest that sellers are still dominating short-term momentum.

免责声明:本文章仅代表作者个人观点,不代表本平台的立场和观点。本文章仅供信息分享,不构成对任何人的任何投资建议。用户与作者之间的任何争议,与本平台无关。如网页中刊载的文章或图片涉及侵权,请提供相关的权利证明和身份证明发送邮件到support@aicoin.com,本平台相关工作人员将会进行核查。

ad
派网:注册并领取高达10000 USDT
Ad
Share To
APP

X

Telegram

Facebook

Reddit

CopyLink