Do not worry about the road ahead without friends; on the investment path, there are like-minded individuals. Good afternoon, everyone! I am the King of Coins from the Coin Victory Group. Thank you all for coming here to watch the articles and videos from the King. Every day, I bring you different news from the crypto world and precise market analysis.
April 3 BTC/ETH Market Strategy Interpretation
I. Market Review and Technical Analysis
- Bitcoin (BTC) Technical Characteristics
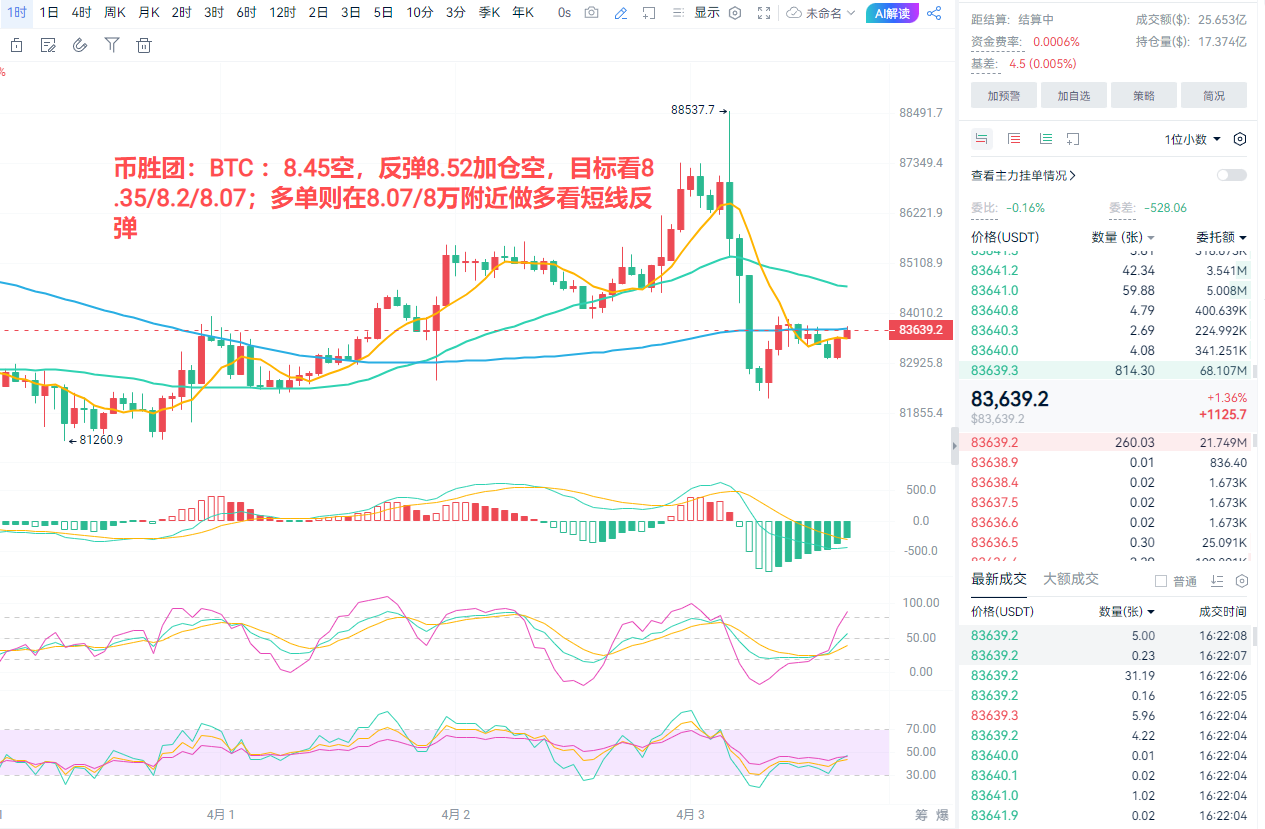
Daily Chart: Yesterday, a long upper shadow green candlestick was formed, with the price rising to the MA60 moving average (approximately $88,000) resistance level before retreating, closing below the MA30 moving average ($84,500), indicating intensified bullish and bearish competition.
Hourly Chart: The price broke below the MA256 moving average (approximately $84,000), with short-term support at $80,700 and resistance at $84,500/$85,000.
Operational Logic: The Coin Victory Group suggested shorting at $88,000 yesterday, currently profiting 5,000 points, indicating a continuation of the bearish trend.
- Ethereum (ETH) Technical Characteristics
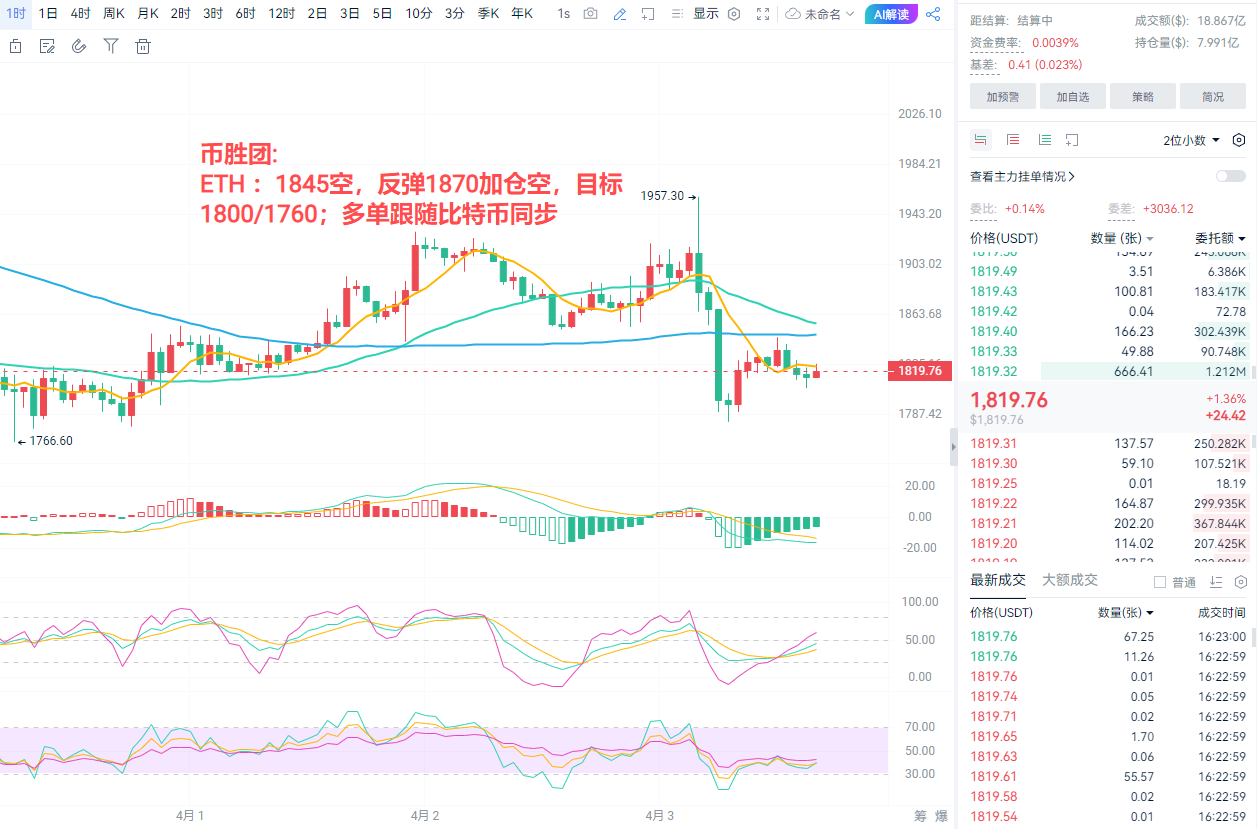
Daily Chart: The price touched the MA30 moving average ($1,960) before retreating to a low of $1,800, with a narrowing short-term fluctuation range.
4-Hour Chart: Failed to break through the $1,950 resistance level, with support at $1,780 and resistance at $1,845/$1,865.
Operational Logic: The correlation between ETH and BTC has strengthened, requiring attention to the impact of Bitcoin's movements on Ethereum.
II. The Impact Path of Trump's Tariff Policy on the Cryptocurrency Market
- Policy Background and Market Sentiment Transmission
Core of the Policy: If the Trump administration announces tariffs on imported goods (such as semiconductors, new energy, etc.), it may trigger global supply chain disruptions and rising inflation expectations.
Safe-Haven Demand Drive: Historical data shows that Bitcoin is often used as a hedging tool during periods of geopolitical risk (such as trade wars). For example, during the China-U.S. trade friction in 2018, BTC price soared from $6,000 to $13,000.
Risk Asset Correlation: If tariff policies trigger a stock market sell-off (such as a decline in tech stocks), cryptocurrencies may also come under pressure, as both belong to high-risk asset categories.
- Capital Flow and Market Structure Changes
Institutional Capital Safe-Haven Allocation: Hedge funds may increase their BTC holdings to diversify geopolitical risk exposure, pushing prices to break through technical resistance levels.
Leverage Trading Risks: Policy uncertainty may increase volatility, potentially triggering long position liquidations (e.g., if BTC falls below the $80,700 support level), creating a "cascade effect."
III. Operational Strategy Combined with Policy Adjustments
- Bitcoin (BTC) Strategy Optimization
Continuation of Short Positions: Maintain the short recommendation at $84,500, adding to positions if it rebounds to $85,200, targeting lower at $83,500/$82,000/$80,700.
Long Position Speculation: If tariff policies trigger panic selling, light long positions can be taken near $80,700/$80,000, but liquidity risks must be monitored.
Policy Sensitivity Points: Pay attention to the timing of statements from the U.S. Trade Representative's Office (USTR). If the policy is more hawkish than expected, it may accelerate declines.
- Ethereum (ETH) Strategy Correlation
Synchronized Short Positions: Short at $1,845, adding to positions if it rebounds to $1,870, targeting $1,800/$1,760.
Cautious Long Positions: With ETH and BTC correlation at 0.85, wait for Bitcoin to stabilize before considering long entries.
Technical Divergence Warning: The RSI indicator on the ETH 4-hour chart is oversold (below 30), necessitating caution against short-term rebound risks.
IV. Risk Warnings and Comprehensive Suggestions
Policy Uncertainty: Details of tariff policies (such as tax rates and implementation timelines) may cause market fluctuations. It is advisable to set stop-loss orders (e.g., BTC short stop-loss at $85,500).
Liquidity Risks: Market trading is thin before the weekend, and large orders may exacerbate price volatility. Prioritize intraday short-term operations.
Cross-Asset Hedging: If holding BTC/ETH long positions, consider allocating to gold (ETFs like GLD) or the U.S. dollar index (DXY) to hedge against policy risks.
Technical and Fundamental Resonance: If Bitcoin effectively breaks through the MA60 moving average ($88,000), be cautious of rapid rebounds triggered by short position liquidations.
V. Conclusion: Strategy Choices Under Policy and Technical Resonance
The current market is under dual pressure from "policy risk + technical pressure." It is recommended to prioritize the Coin Victory Group's short strategy while paying attention to the following signals:
Bullish Reversal Signals: BTC stabilizing above the MA30 moving average ($84,500) + ETH breaking through the $1,865 resistance level.
Bearish Strengthening Signals: U.S. non-farm payroll data exceeding expectations + market sentiment deteriorating after the implementation of tariff policies.
Final Recommendation: Focus on technical analysis as the core, with policy analysis as a supplement, strictly controlling positions (no more than 10% per trade) to avoid blindly chasing highs and lows.
This article is independently written by the Coin Victory Group. Friends in need of current price strategies and solutions can find the Coin Victory Group online. Recently, the market has been mainly characterized by fluctuations, accompanied by intermittent spikes. Therefore, when making trades, please remember to control your take-profit and stop-loss levels. In the future, when facing significant market data, the Coin Victory Group will also organize live broadcasts across the internet. Friends who wish to watch can find the Coin Victory Group online and contact me for the link. The focus is on spot, contracts, BTC/ETH/ETC/LTC/EOS/BSV/ATOM/XRP/BCH/LINK/TRX/DOT. Expertise includes: mobile locking strategy around high and low support and resistance for short-term fluctuations, medium to long-term trend positions, daily extreme pullbacks, weekly K-top predictions, and monthly head predictions.
免责声明:本文章仅代表作者个人观点,不代表本平台的立场和观点。本文章仅供信息分享,不构成对任何人的任何投资建议。用户与作者之间的任何争议,与本平台无关。如网页中刊载的文章或图片涉及侵权,请提供相关的权利证明和身份证明发送邮件到support@aicoin.com,本平台相关工作人员将会进行核查。