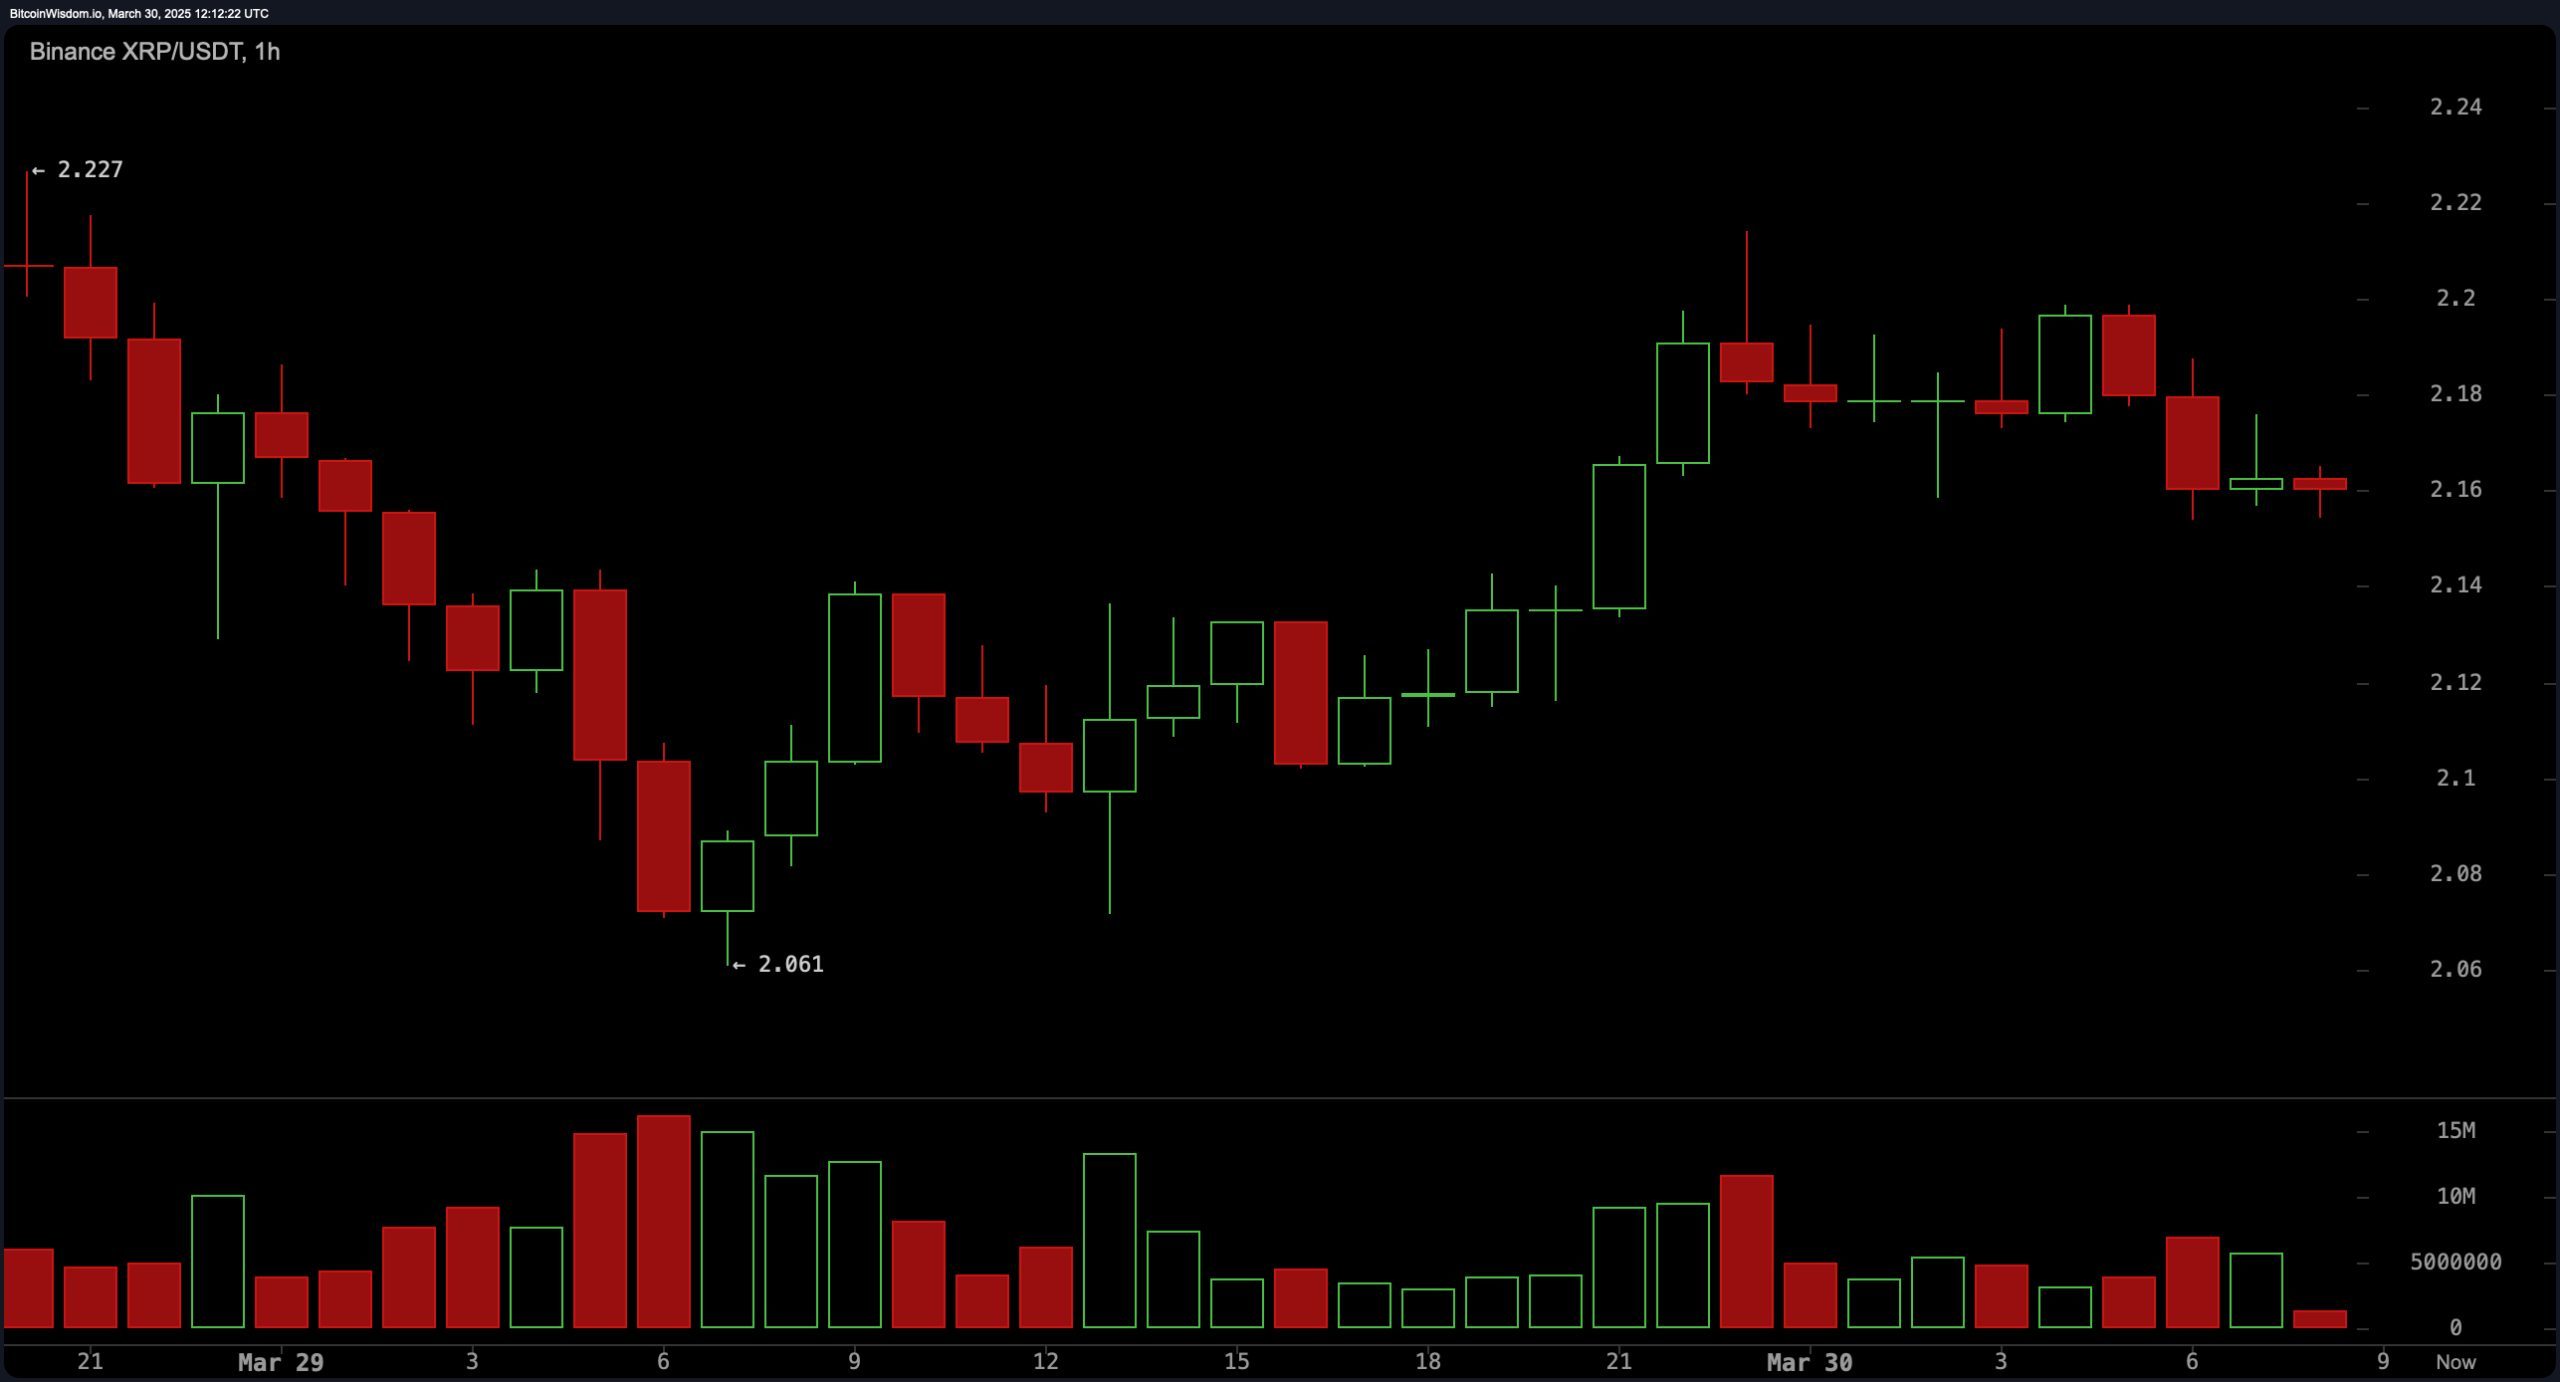
The 1-hour chart reflects a consolidation phase, with XRP stabilizing around the $2.16 mark. Minor green candlesticks suggest early buyer interest, though the absence of significant upward momentum implies market hesitation. Volume spikes during minor recoveries could indicate accumulation, but no substantial bullish confirmation has emerged. A breakout above $2.17 supported by volume may trigger a short-term move toward $2.22 to $2.25, while a failure to hold above $2.1 may lead to further downside. Stop-loss placements below $2.1 remain advisable for risk management.

XRP/ USDT via Binance 1H chart on March 30, 2025.
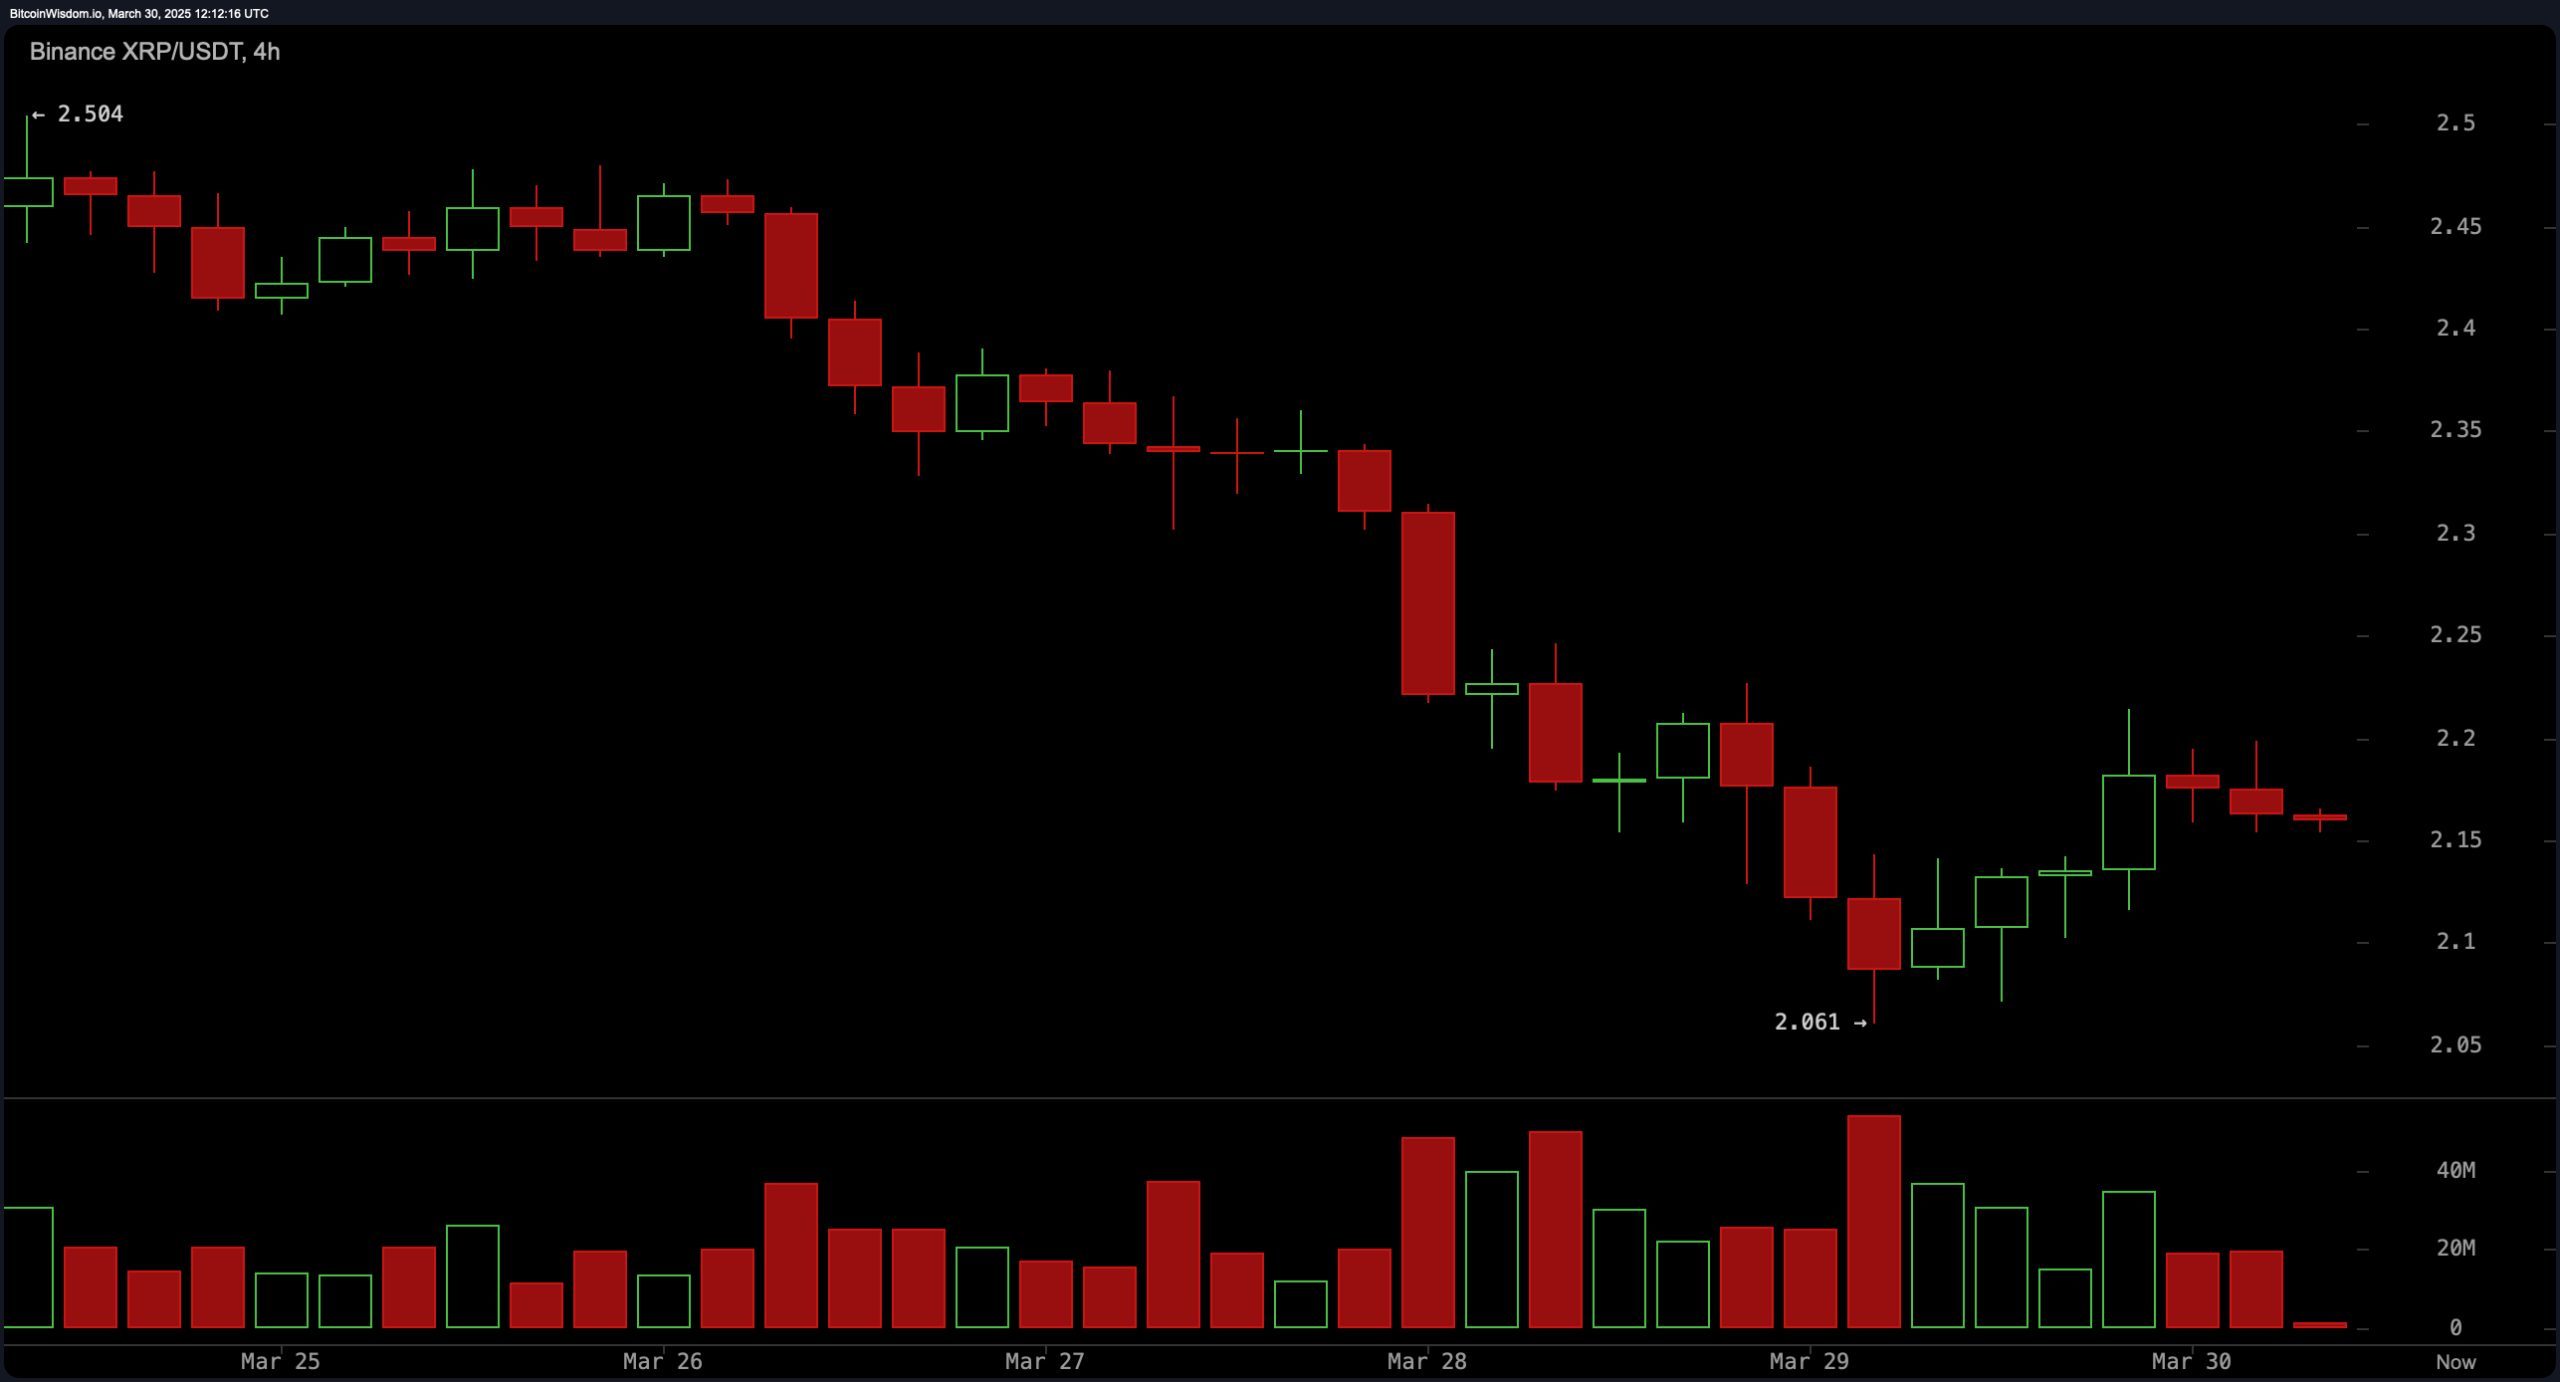
On the 4-hour chart, XRP continues its downward trajectory, despite a temporary recovery near $2.06. Resistance near $2.3 remains a formidable barrier, with price action displaying a lack of sustained upward momentum. A volume increase at the recent low hints at potential accumulation; however, follow-through buying is essential. Should XRP reclaim $2.2 with strong volume, a short-term buying opportunity could materialize, targeting $2.3 to $2.4. Risk-conscious traders might consider placing stop losses around $2.05 to limit exposure.

XRP/ USDT via Binance 4H chart on March 30, 2025.
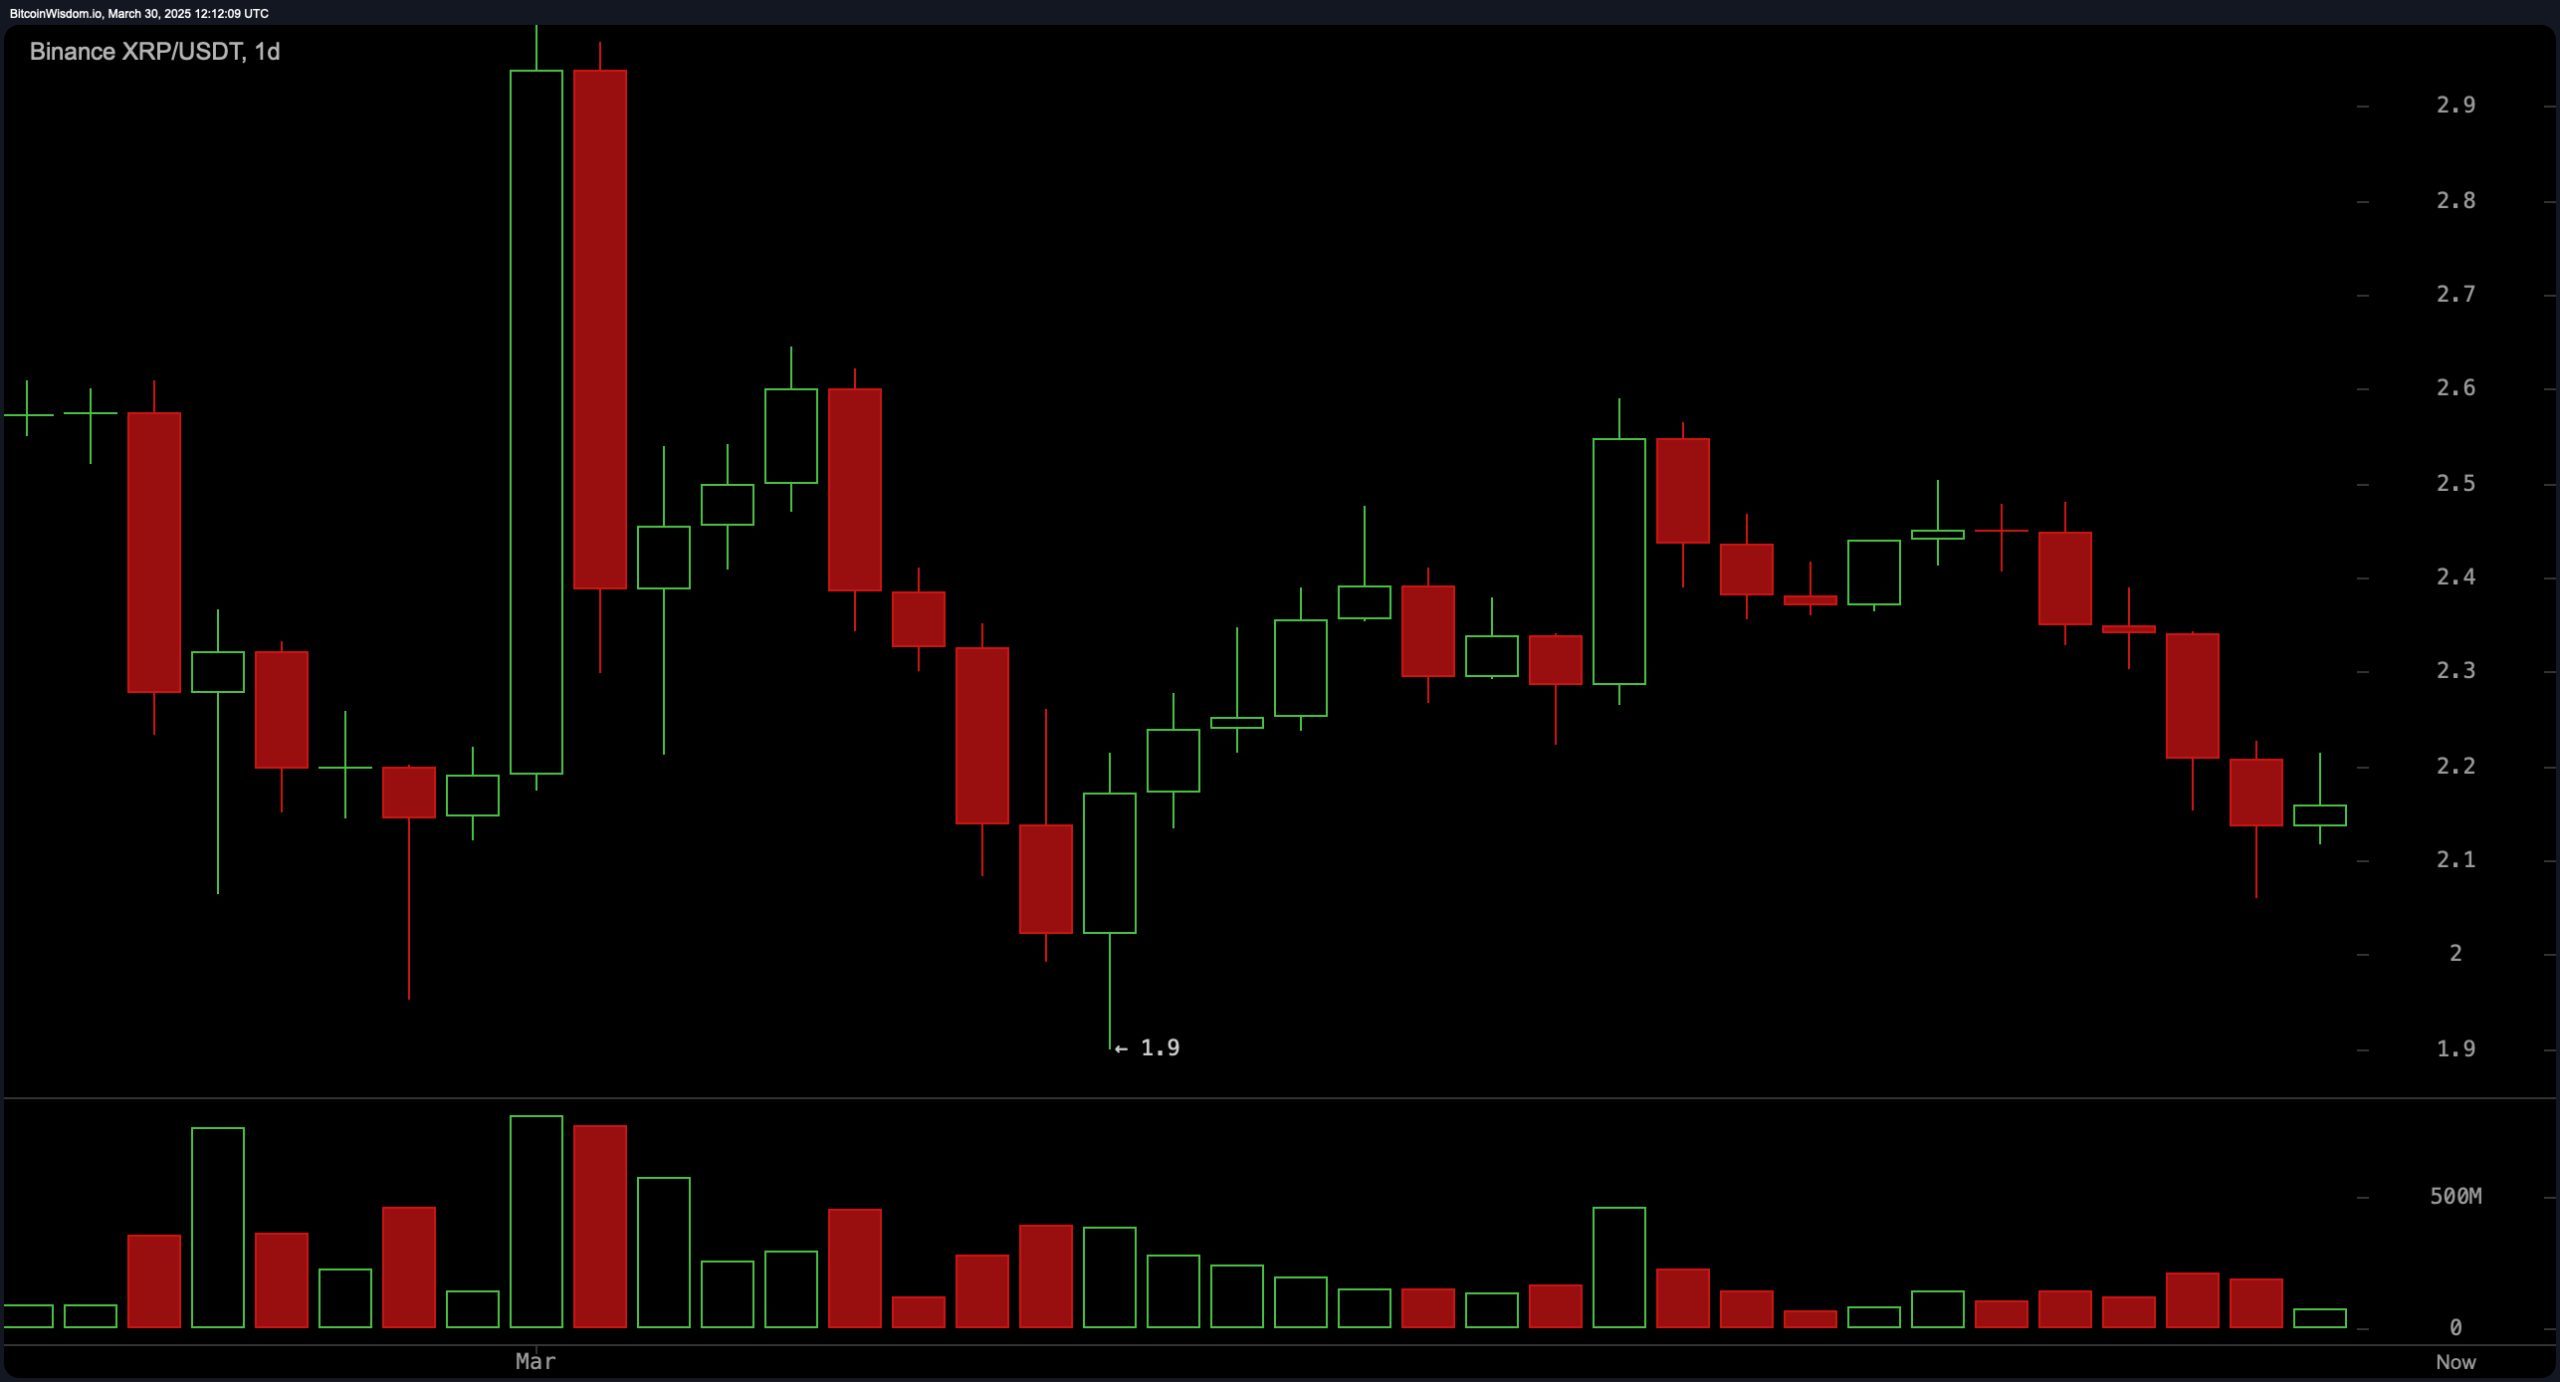
The daily chart underscores XRP’s broader downtrend. Previous attempts to sustain gains above $2.5 failed, reinforcing resistance within the $2.5 to $2.7 range. Support rests at $2.1, with a secondary psychological level near $1.9. A volume decline reflects reduced participation from both buyers and sellers, signaling a possible consolidation phase. Bullish traders may seek reversal patterns like double bottoms, while conservative exits at $2.4 to $2.5 are recommended. Maintaining a stop loss below $1.9 remains prudent.

XRP/ USDT via Binance 1D chart on March 30, 2025.
Oscillator readings present a mixed sentiment. The relative strength index (RSI) at 41.18 is neutral, reflecting balanced buying and selling pressure. The Stochastic oscillator at 14.46 also remains neutral, while the commodity channel index (CCI) at -122.86 signals a buy, suggesting oversold conditions. Conversely, the average directional index (ADX) at 13.40 indicates a weak trend. The awesome oscillator’s value of -0.06998 aligns with the neutral sentiment. Momentum at -0.27664 presents a buy signal, yet the moving average convergence divergence (MACD) at -0.04739 points to a sell, reflecting persistent bearish pressure.
Moving averages (MAs) reinforce the prevailing bearish sentiment. The exponential moving average (EMA) and simple moving average (SMA) across short to medium timeframes, including the 10, 20, 30, and 50-periods, all indicate sell signals. However, the 200-period EMA at 1.94 and SMA at 1.79 suggest a longer-term buying opportunity, as XRP remains above these critical support levels. Traders seeking confirmation of a trend reversal should monitor price movement relative to these moving averages.
Fibonacci retracement levels across timeframes provide further insight into potential price targets. On the daily chart, XRP hovers near the 0.786 retracement level at $2.11. A hold above this level could support a rebound toward $2.28 or $2.4. The 4-hour chart also shows price testing the 0.786 level at $2.15, with a potential upside to $2.23 if buying pressure strengthens. Meanwhile, the 1-hour chart positions XRP near its 0.5 retracement level at $2.16, with further resistance at $2.17 and $2.19. A break below could see support tested at $2.12.
Traders are advised to remain cautious, considering both technical indicators and market sentiment. Monitoring for increased volume, bullish candlestick patterns, and RSI divergences will be essential in identifying potential reversal points. Risk management remains crucial, with well-placed stop losses to mitigate further downside.
Bull Verdict:
If XRP maintains support near the $2.1 level and volume increases, a bullish reversal could materialize. Positive signals from the commodity channel index (CCI) and momentum indicators suggest a potential upside. A breakout above $2.22, supported by strong buying pressure, could propel XRP towards the $2.4 to $2.5 resistance zone. Traders seeking long positions should monitor for bullish candlestick patterns and increased market participation for confirmation.
Bear Verdict:
XRP’s sustained rejection from key resistance levels and bearish momentum from the moving average convergence divergence (MACD) and moving averages indicate further downside risks. Failure to hold support around $2.1 could trigger a retest of the psychological $1.9 level. With a weak trend strength signaled by the average directional index (ADX) and continued sell pressure, a cautious approach is advisable for traders anticipating further losses.
免责声明:本文章仅代表作者个人观点,不代表本平台的立场和观点。本文章仅供信息分享,不构成对任何人的任何投资建议。用户与作者之间的任何争议,与本平台无关。如网页中刊载的文章或图片涉及侵权,请提供相关的权利证明和身份证明发送邮件到support@aicoin.com,本平台相关工作人员将会进行核查。


