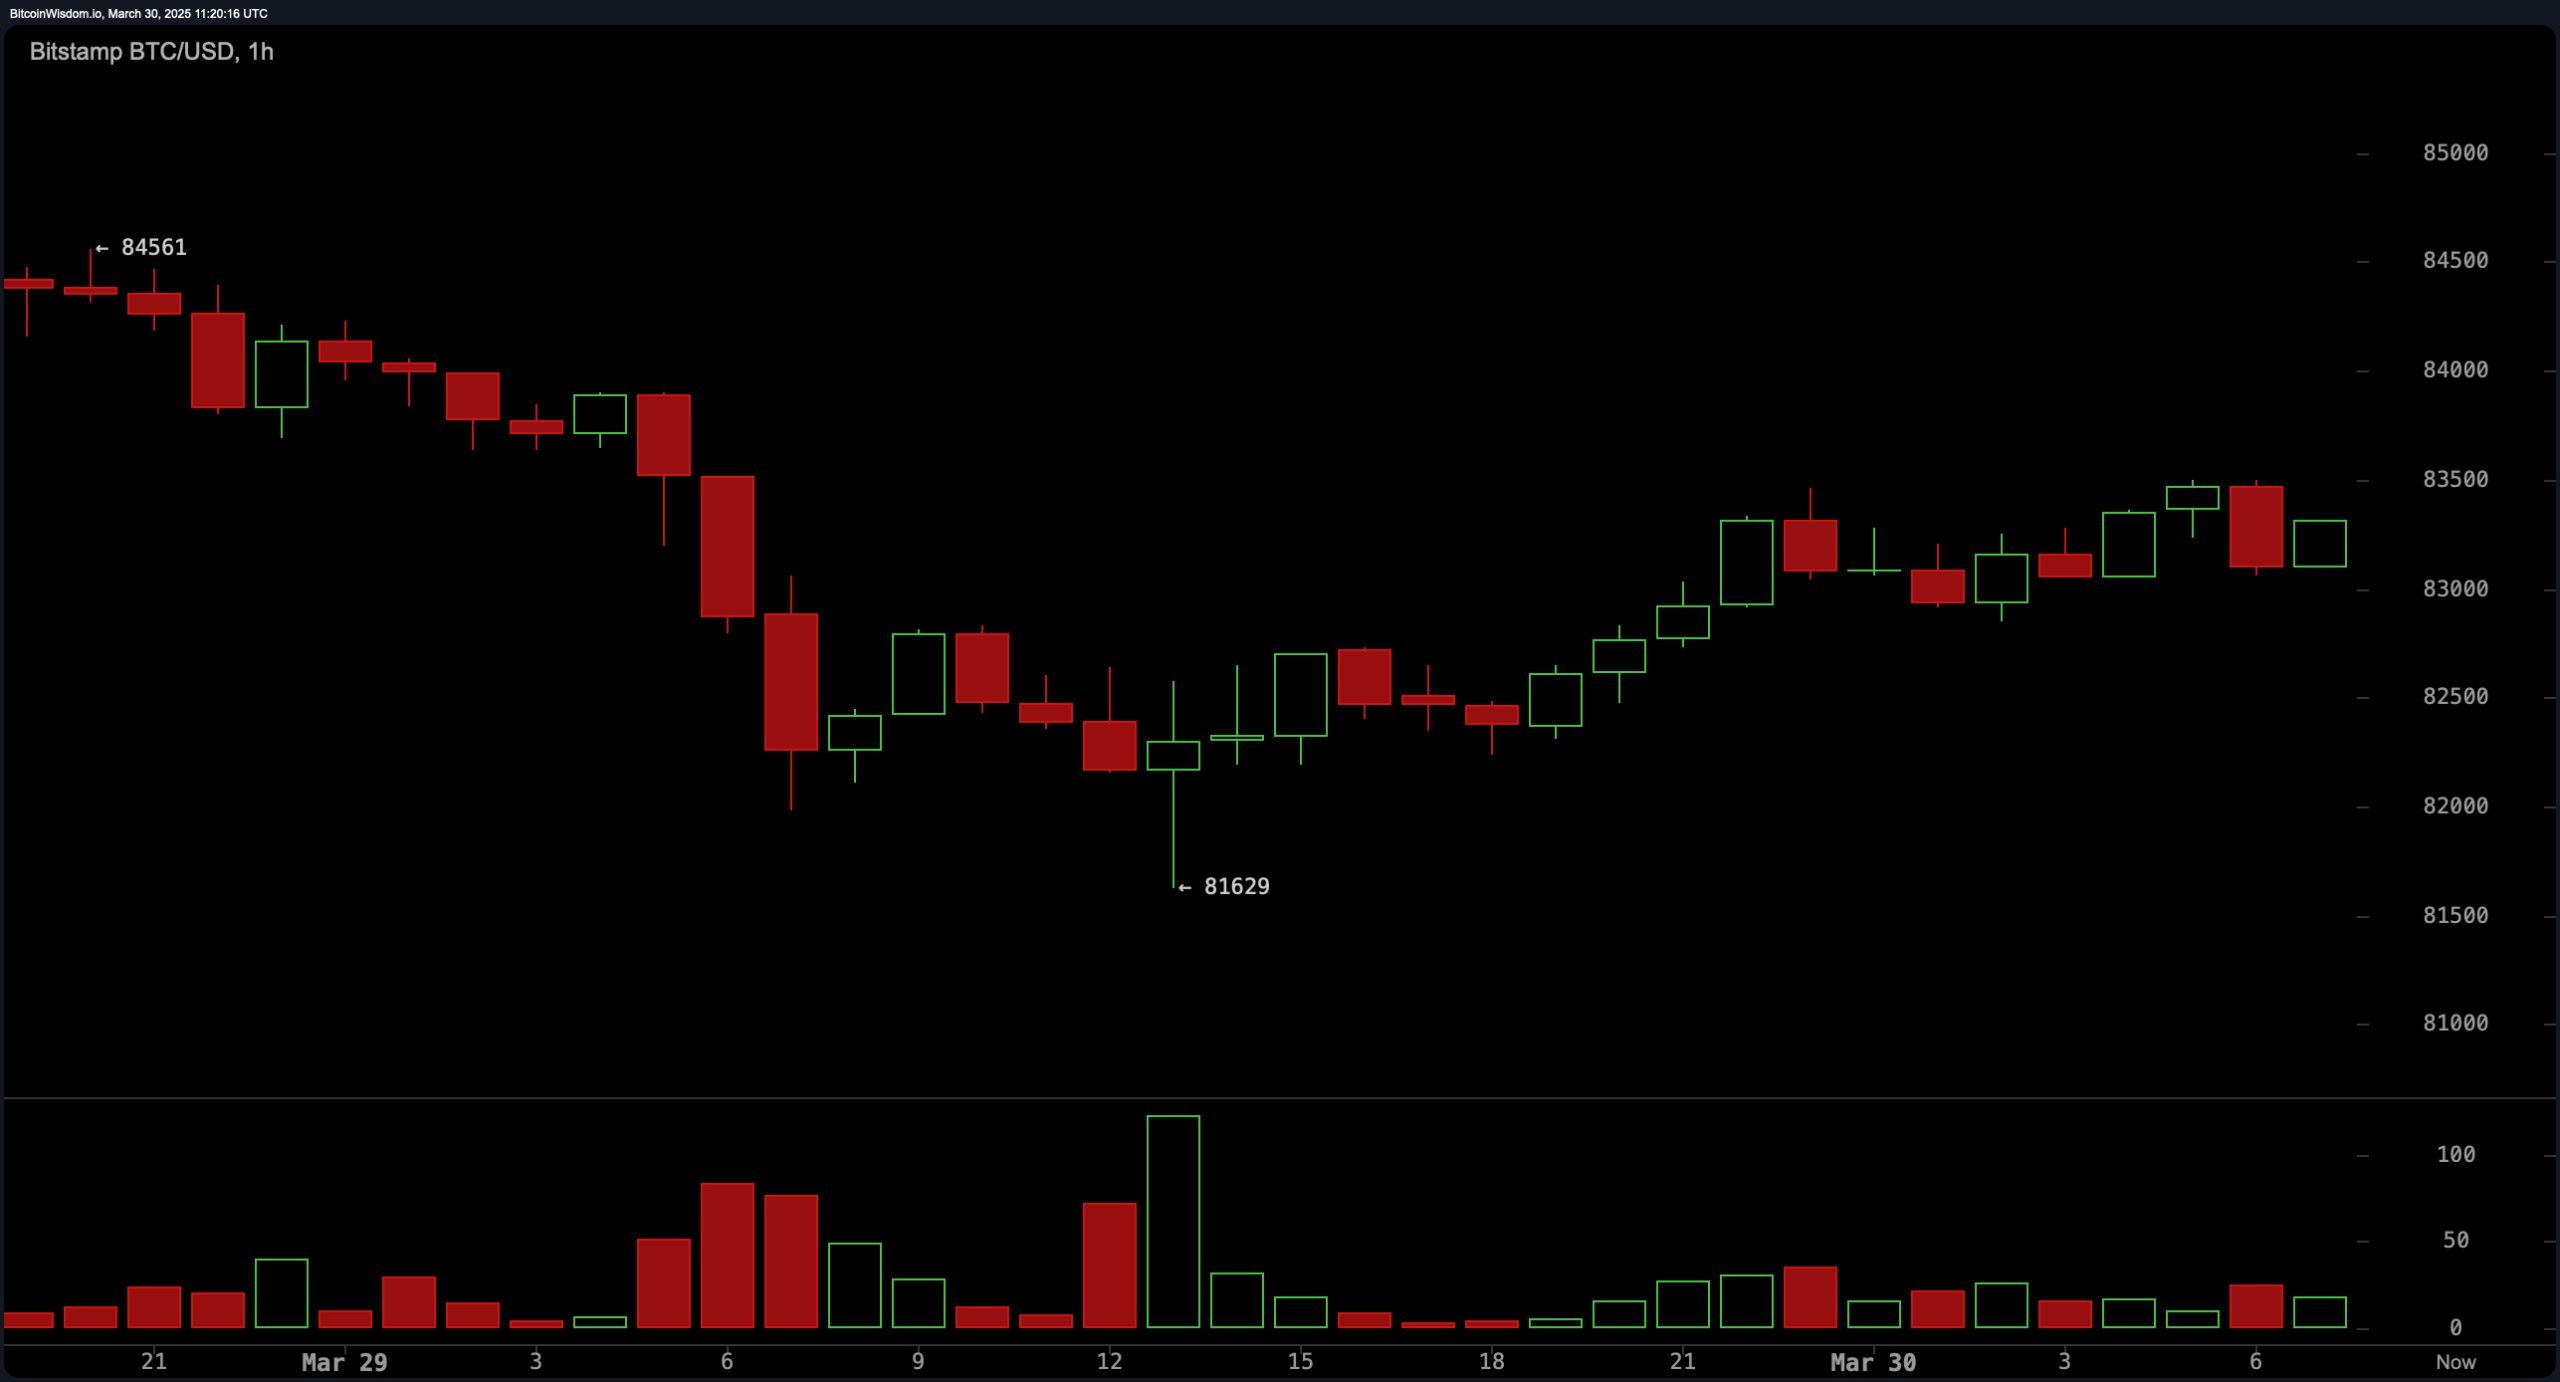
On the 1-hour chart, bitcoin has shown signs of short-term consolidation following a bounce from its recent low of $81,629. Despite temporary upward momentum, lower highs and lower lows signal the persistence of a broader downtrend. Resistance at $84,500 remains a key level, while support at $81,600 is crucial. Volume patterns suggest weak buyer participation, with green bars lacking conviction. A breakout above $83,500 on increased volume could indicate a short-term bullish move, whereas a rejection at this level would strengthen bearish sentiment.

BTC/USD 1H chart via Bitstamp on March 30, 2025.
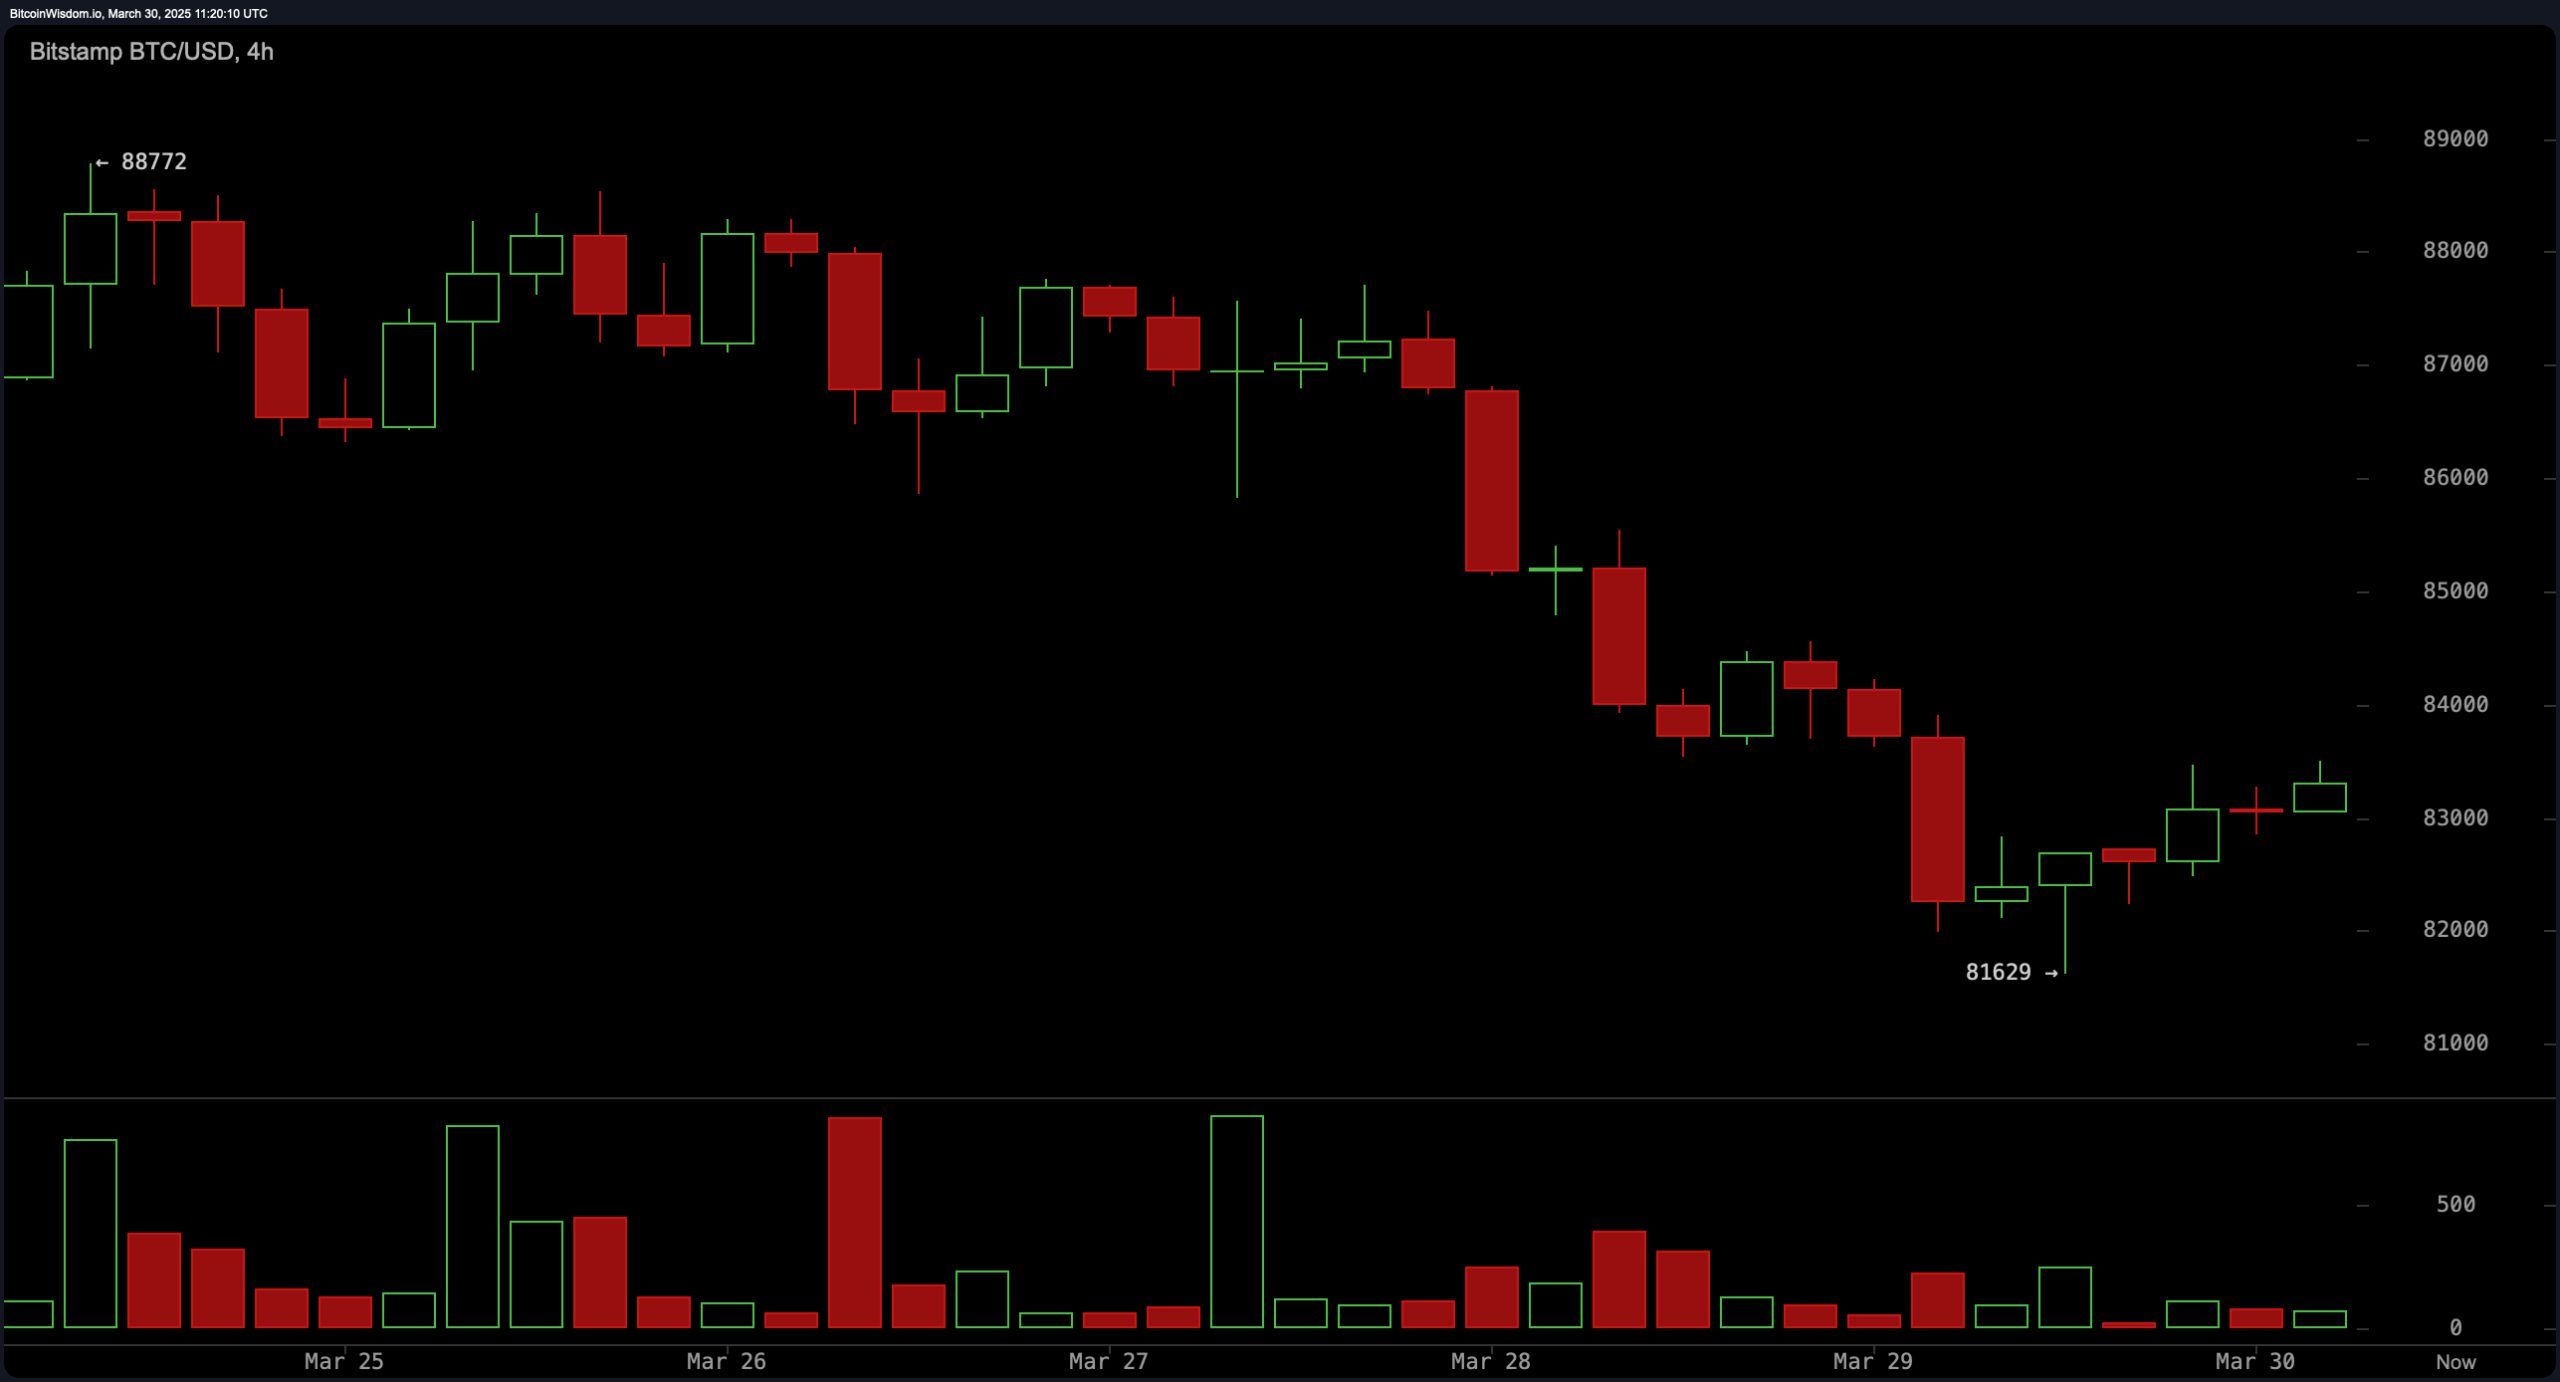
The 4-hour chart presents a clearer view of the recent relief rally from the $81,629 low. While minor volume spikes during sell-offs highlight market uncertainty, the absence of strong buying volume undermines the rebound’s credibility. A significant resistance range between $83,500 and $84,000 remains pivotal. A failure to breach this zone would suggest continued downside pressure, while a breakout, accompanied by a volume surge, could offer a buying opportunity. Traders should monitor for patterns of rejection or bullish confirmation at these levels.

BTC/USD 4H chart via Bitstamp on March 30, 2025.
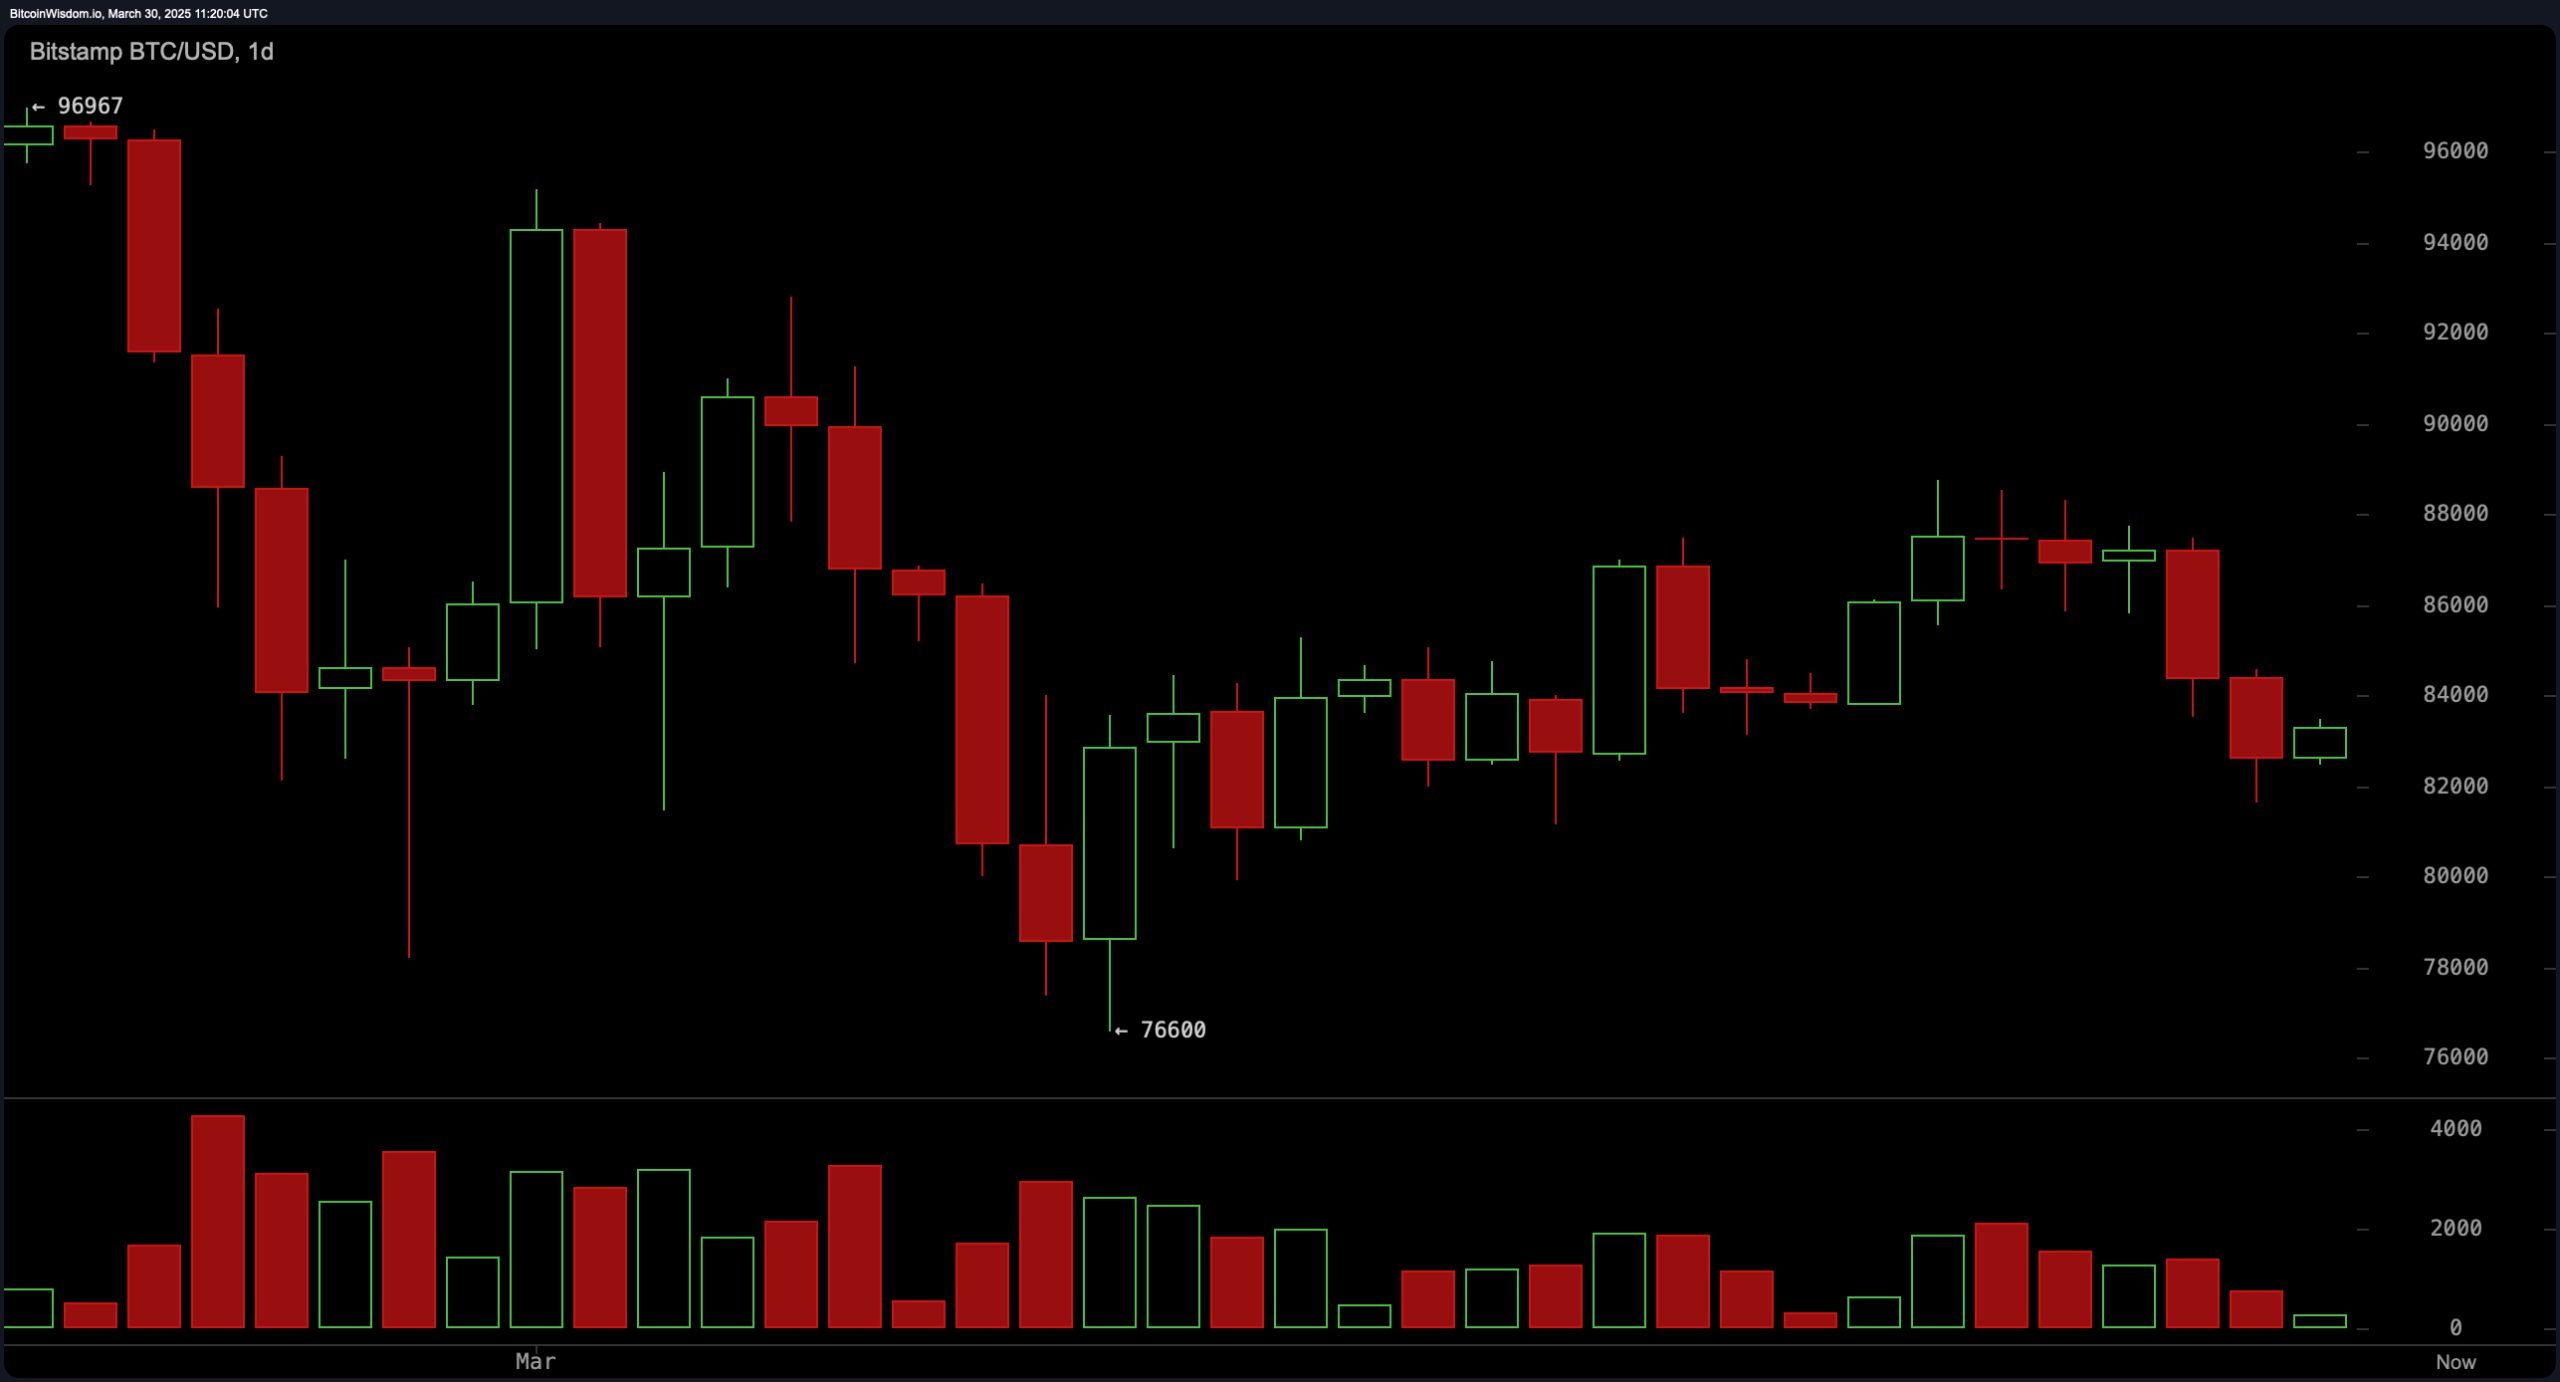
On the daily chart, bitcoin remains in a defined downtrend, having fallen from its recent high of $96,967. A cluster of red candles with extended wicks suggests persistent selling pressure, though intermittent green candles indicate occasional buying support. The nearest support at $82,000 is currently being tested, with further downside potential if this level fails. Resistance levels between $88,000 and $90,000 pose additional challenges for bullish momentum. A sustained move above these zones, supported by increased volume, could signal a trend reversal.

BTC/USD 1D chart via Bitstamp on March 30, 2025.
Oscillator analysis reflects market indecision. The relative strength index (RSI) at 44, Stochastic at 30, commodity channel index (CCI) at -54, and average directional index (ADX) at 23 all indicate neutral conditions. However, the awesome oscillator’s negative value of -10 suggests underlying bearish pressure. In contrast, the momentum indicator’s positive value of -843 and a bullish reading from the moving average convergence divergence (MACD) at -939 offer some encouragement for buyers. This divergence in signals highlights the need for further confirmation before establishing directional bias.
Fibonacci retracement levels provide valuable reference points across all timeframes. On the daily chart, key levels from the $96,967 high to the $76,600 low include $91,607 (23.6%), $88,758 (38.2%), $86,784 (50%), $84,811 (61.8%), and $82,022 (78.6%). On the 4-hour chart, the $88,772 high and $81,629 low result in retracement levels at $87,148 (23.6%), $85,999 (38.2%), $85,201 (50%), $84,404 (61.8%), and $83,069 (78.6%). Similarly, the 1-hour chart’s retracement levels, from a high of $84,561 to a low of $81,629, present resistance and support zones at $83,869 (23.6%), $83,440 (38.2%), $83,095 (50%), $82,749 (61.8%), and $82,263 (78.6%). These levels are key for identifying potential reversal or continuation points.
Moving averages (MAs) paint a predominantly bearish picture. All short and long-term exponential moving averages (EMA) and simple moving averages (SMA) are signaling negative sentiment. The EMA (10) at $84,808 and SMA (10) at $85,331 both reinforce near-term bearish sentiment. Longer-term averages, including the EMA (50) at $88,207 and SMA (50) at $88,799, further validate this view. Additionally, the EMA (200) at $85,496 and SMA (200) at $85,938 underscore the market’s lack of bullish conviction. Until bitcoin can reclaim these levels, downward pressure is likely to persist.
Bull Verdict:
A bullish scenario could unfold if bitcoin successfully breaks above the $84,000 resistance level with a surge in volume. Confirmation from oscillators, particularly momentum and MACD, may provide further validation for buyers. If the price sustains above key moving averages, a push toward the next resistance at $88,000 could be likely. However, bulls must remain cautious of any rejection at resistance, which could invalidate upward momentum.
Bear Verdict:
The bearish outlook remains dominant, with bitcoin struggling to reclaim critical resistance levels. Persistent rejection near $84,000, combined with the negative bias from most moving averages, suggests further downside risk. If support at $81,600 breaks, sellers could target lower levels, with $76,600 as the next major support. Until meaningful buying pressure emerges, the path of least resistance remains downward.
免责声明:本文章仅代表作者个人观点,不代表本平台的立场和观点。本文章仅供信息分享,不构成对任何人的任何投资建议。用户与作者之间的任何争议,与本平台无关。如网页中刊载的文章或图片涉及侵权,请提供相关的权利证明和身份证明发送邮件到support@aicoin.com,本平台相关工作人员将会进行核查。


