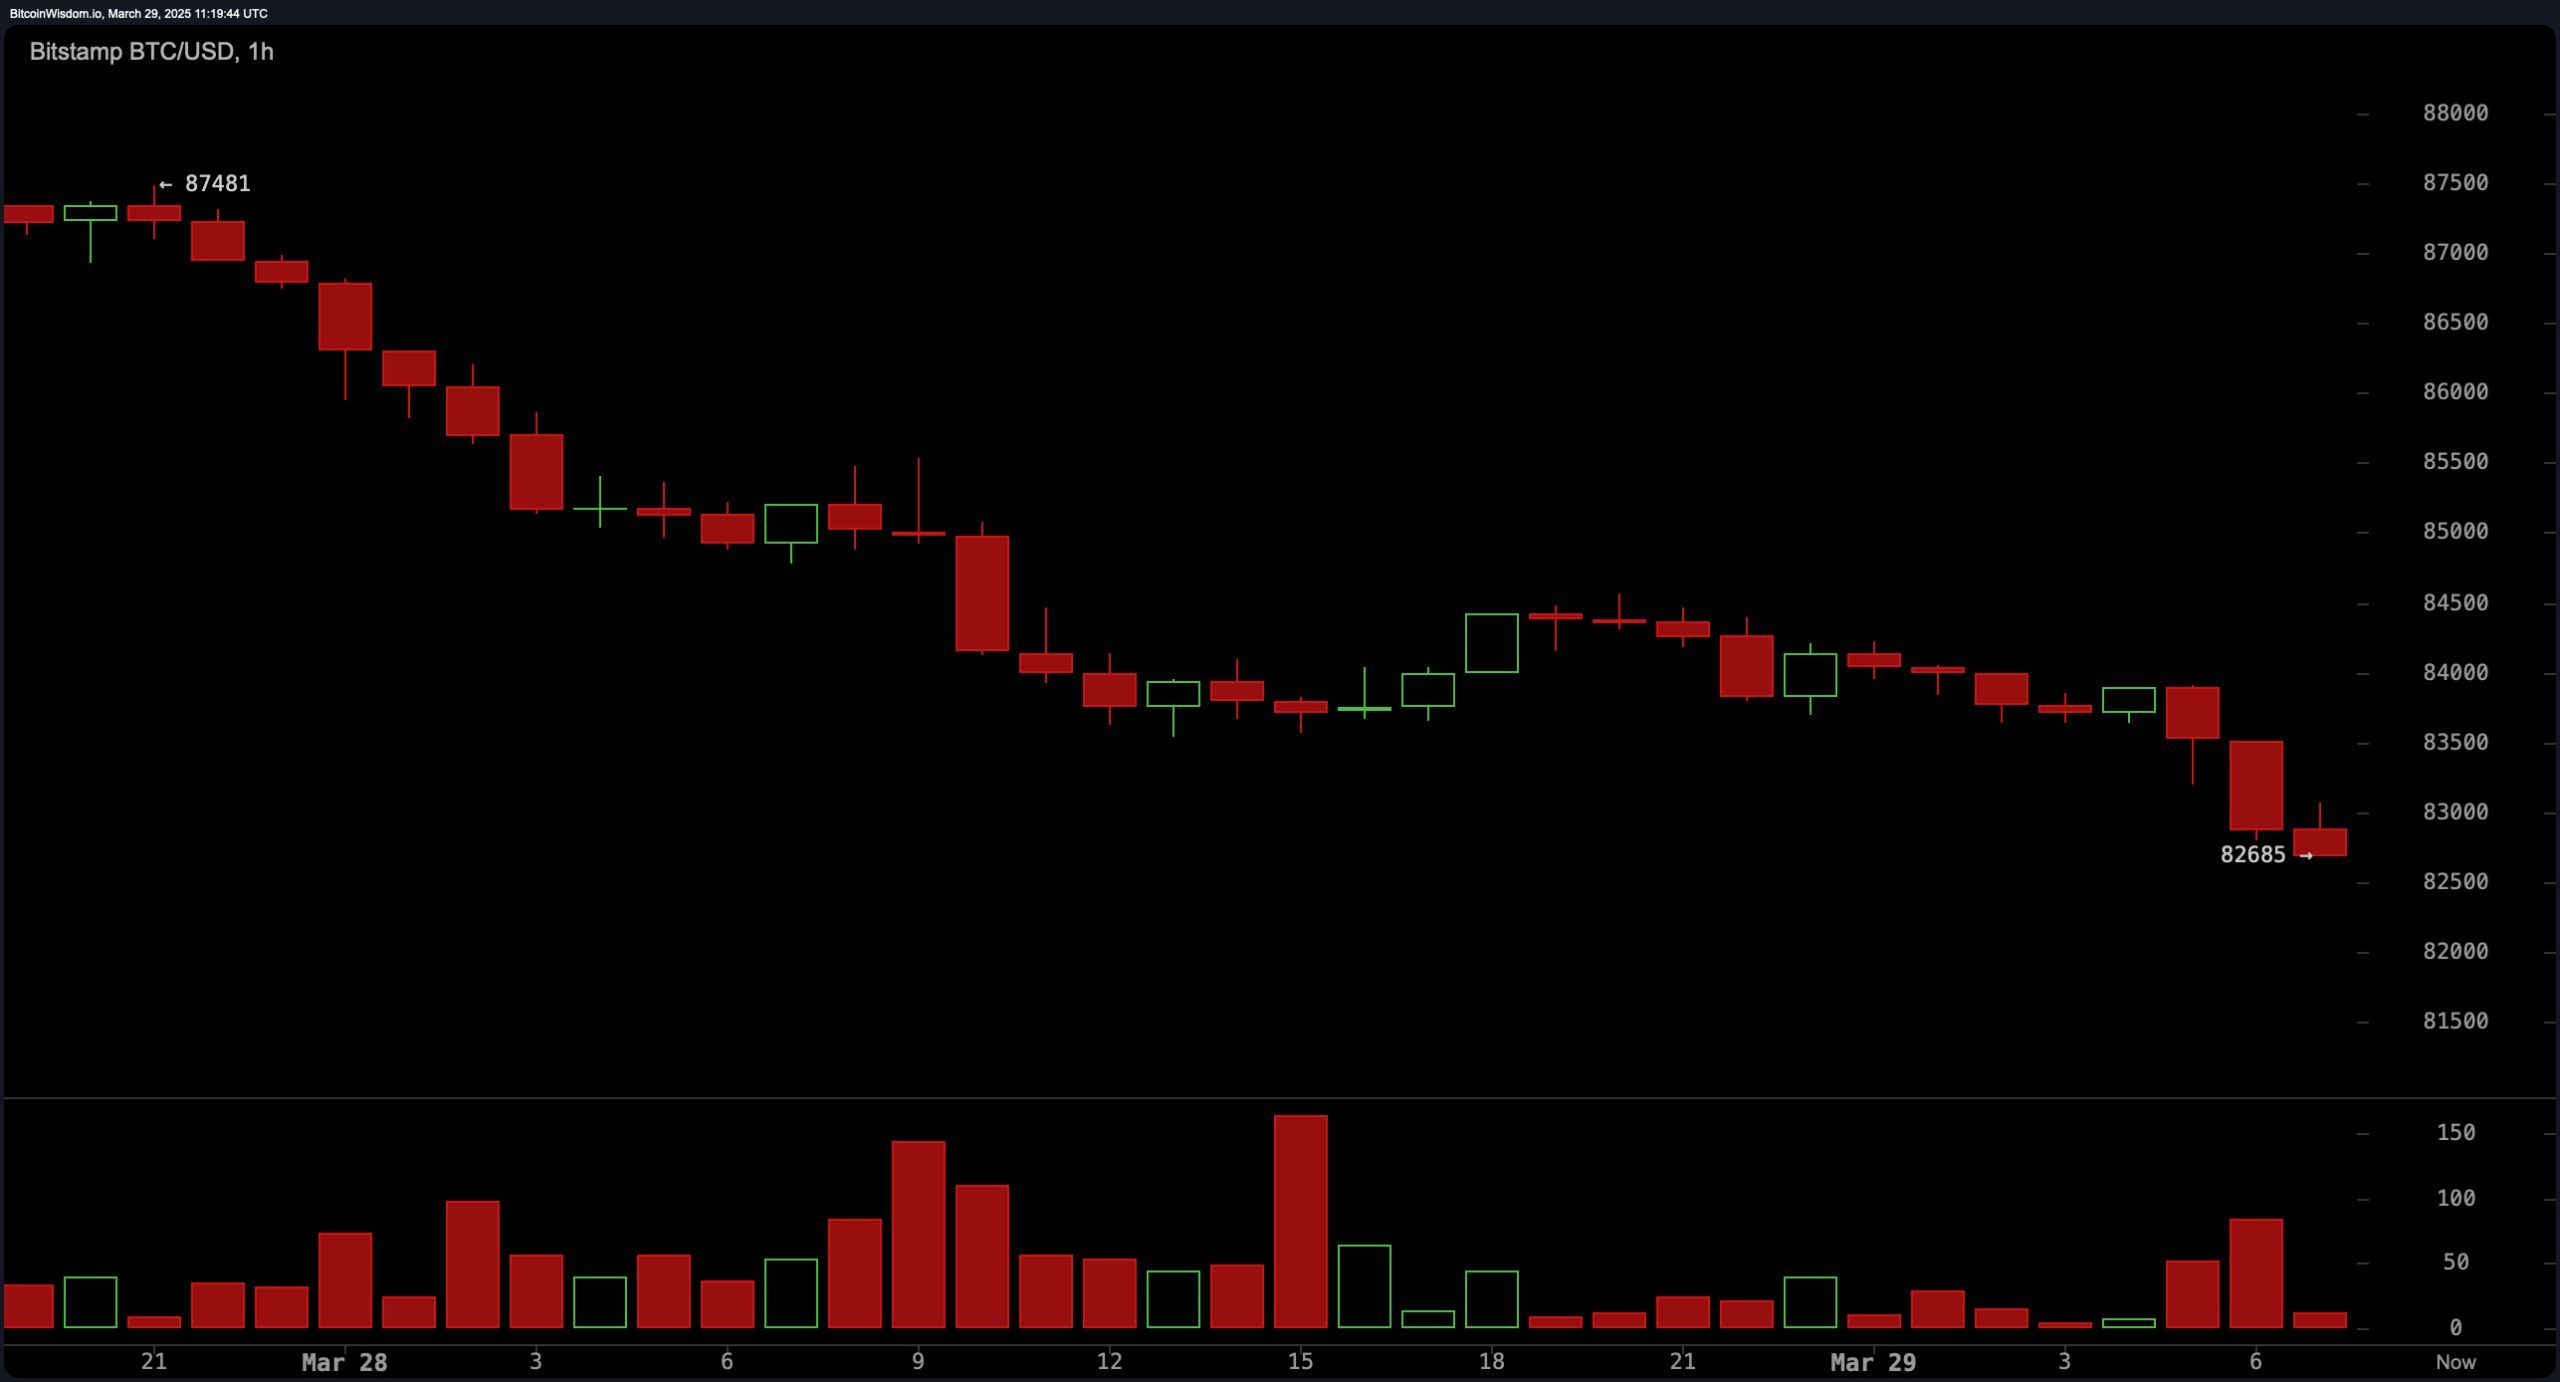
On the 1-hour chart, bitcoin is in a clear downtrend, falling from a recent high of $87,481. Selling pressure has intensified, with volume increasing during downward moves, confirming the bearish bias. Support is established near $82,000, while resistance lies around $84,000. Traders may consider shorting on minor rebounds, using $84,000 as a key level for invalidation. Should bitcoin break above this resistance with strong volume, the trend could reverse.
BTC/USD 1H chart via Bitstamp on March 29, 2025.
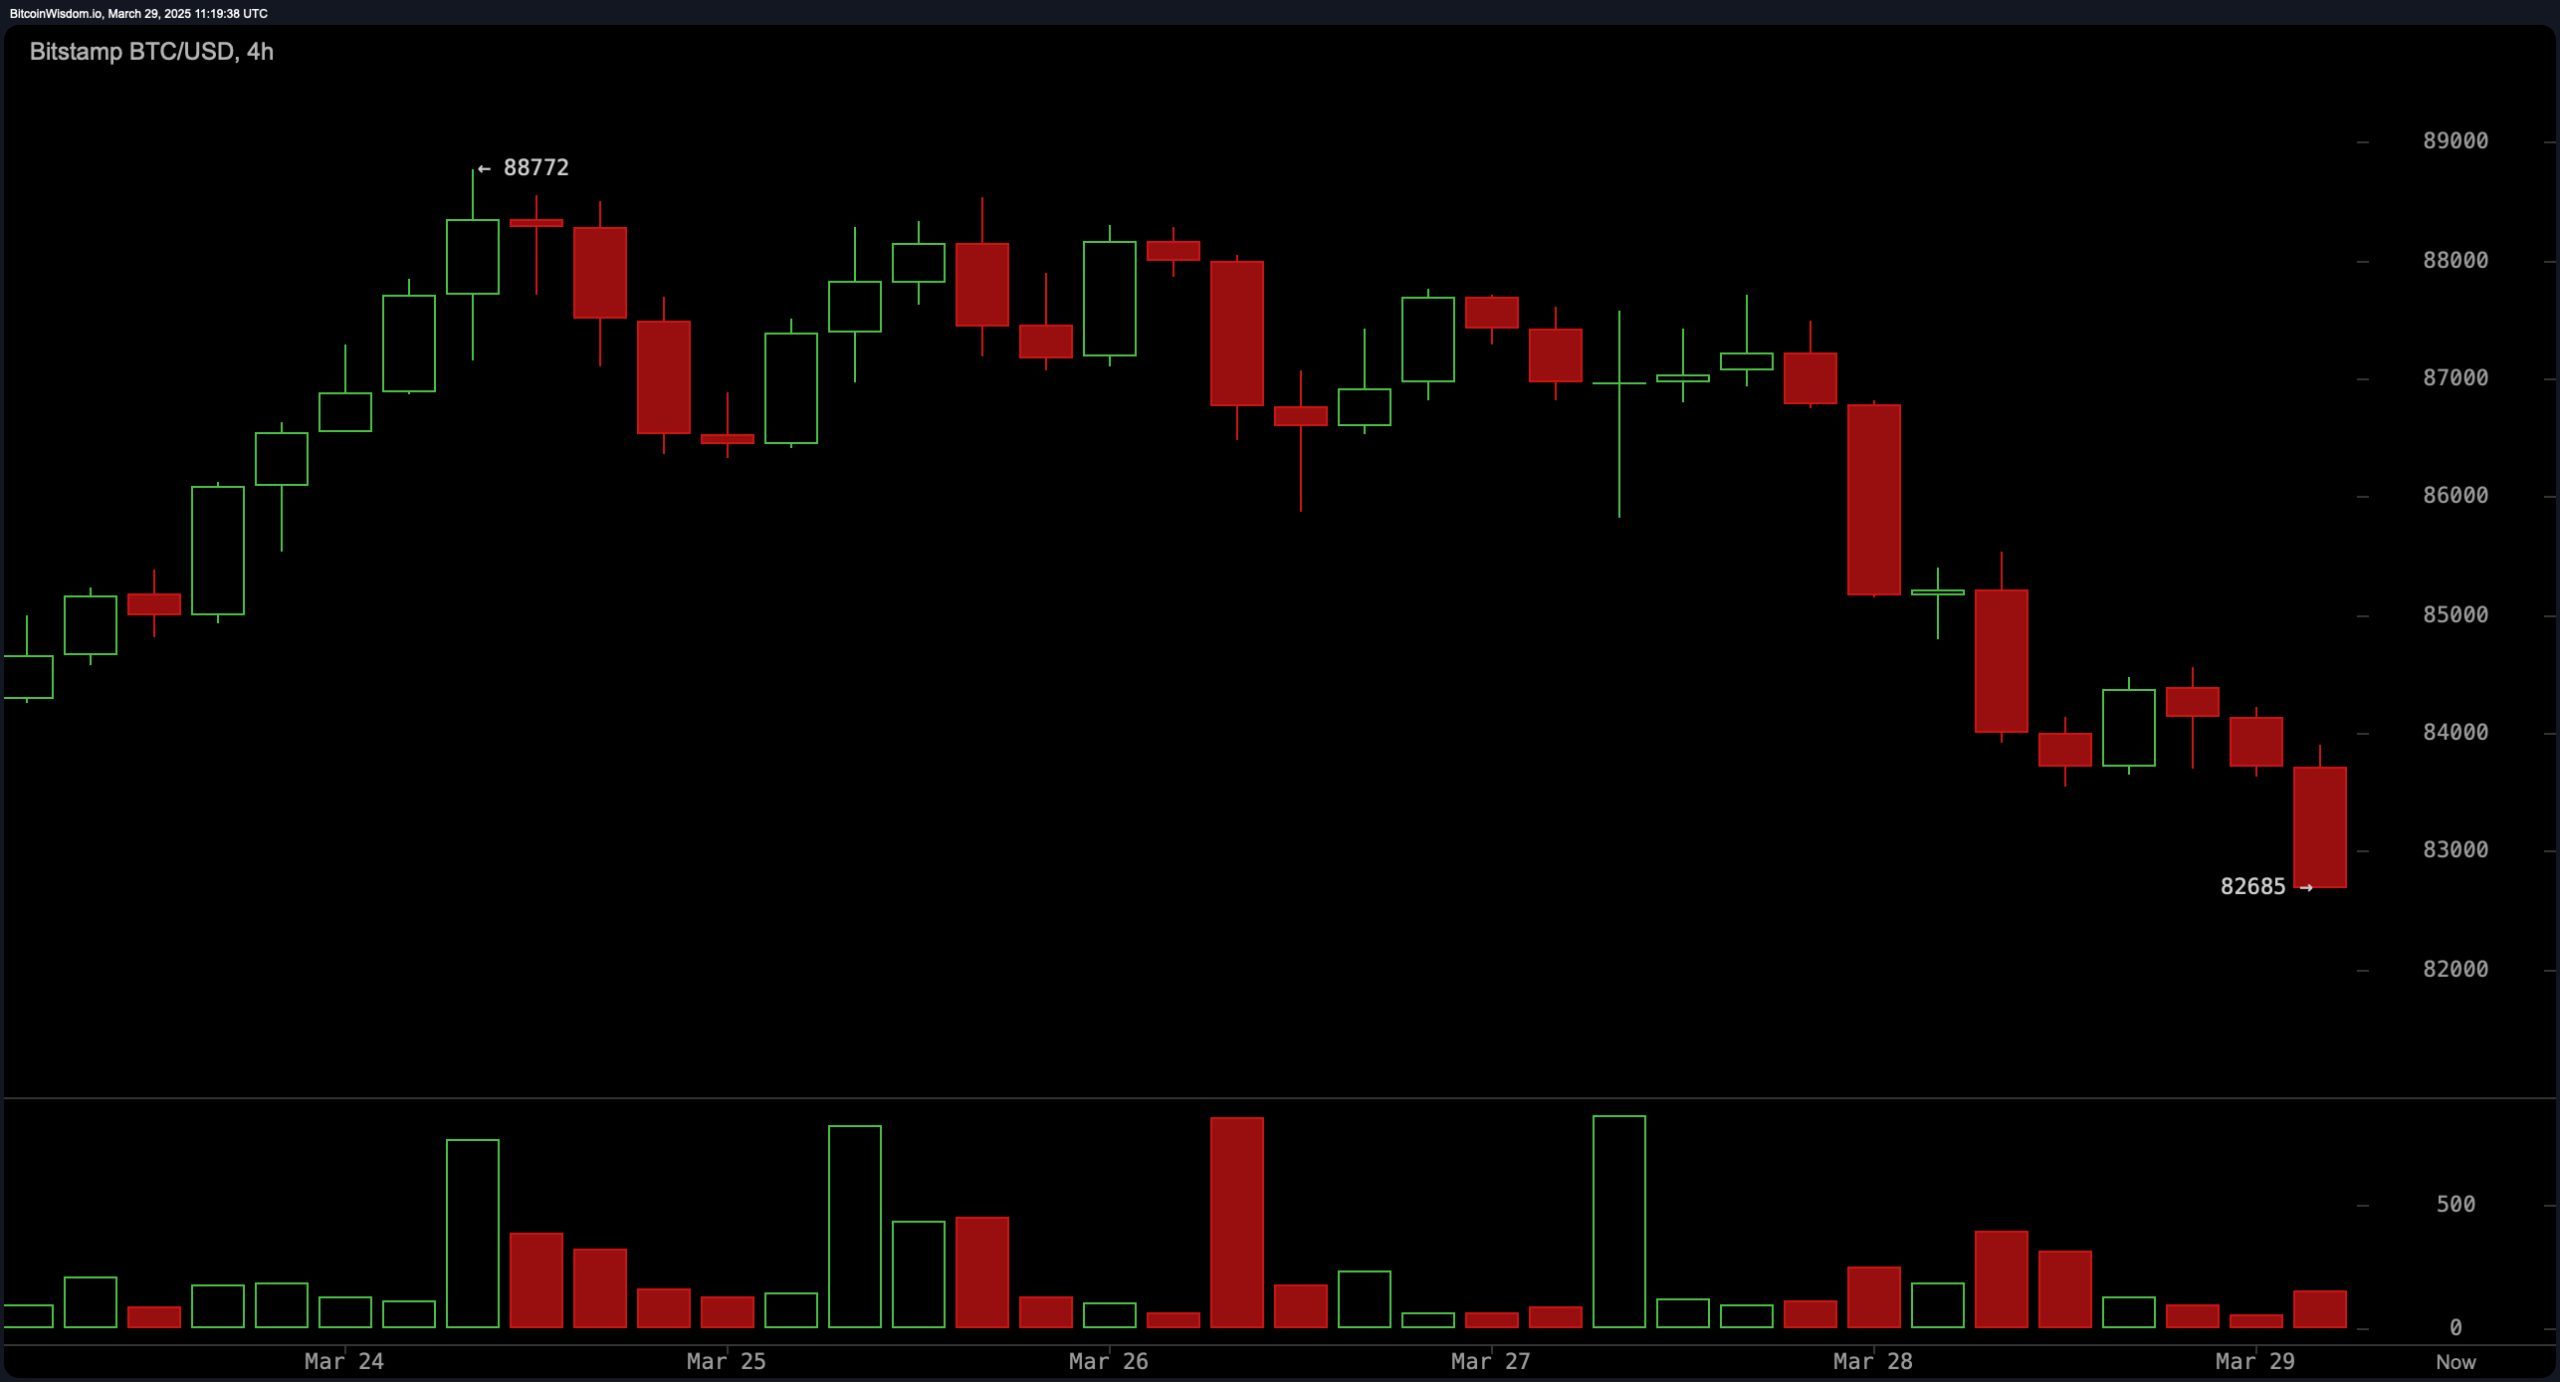
The 4-hour chart further underscores the bearish sentiment, with a sharp decline from $88,772. The market is forming consistent lower highs and lower lows. Resistance is visible between $85,000 and $86,000, while support remains at $82,000. High-volume red candles suggests stronger selling pressure. Any recovery attempts would need to overcome resistance at $86,000 for a shift in momentum.
BTC/USD 4H chart via Bitstamp on March 29, 2025.
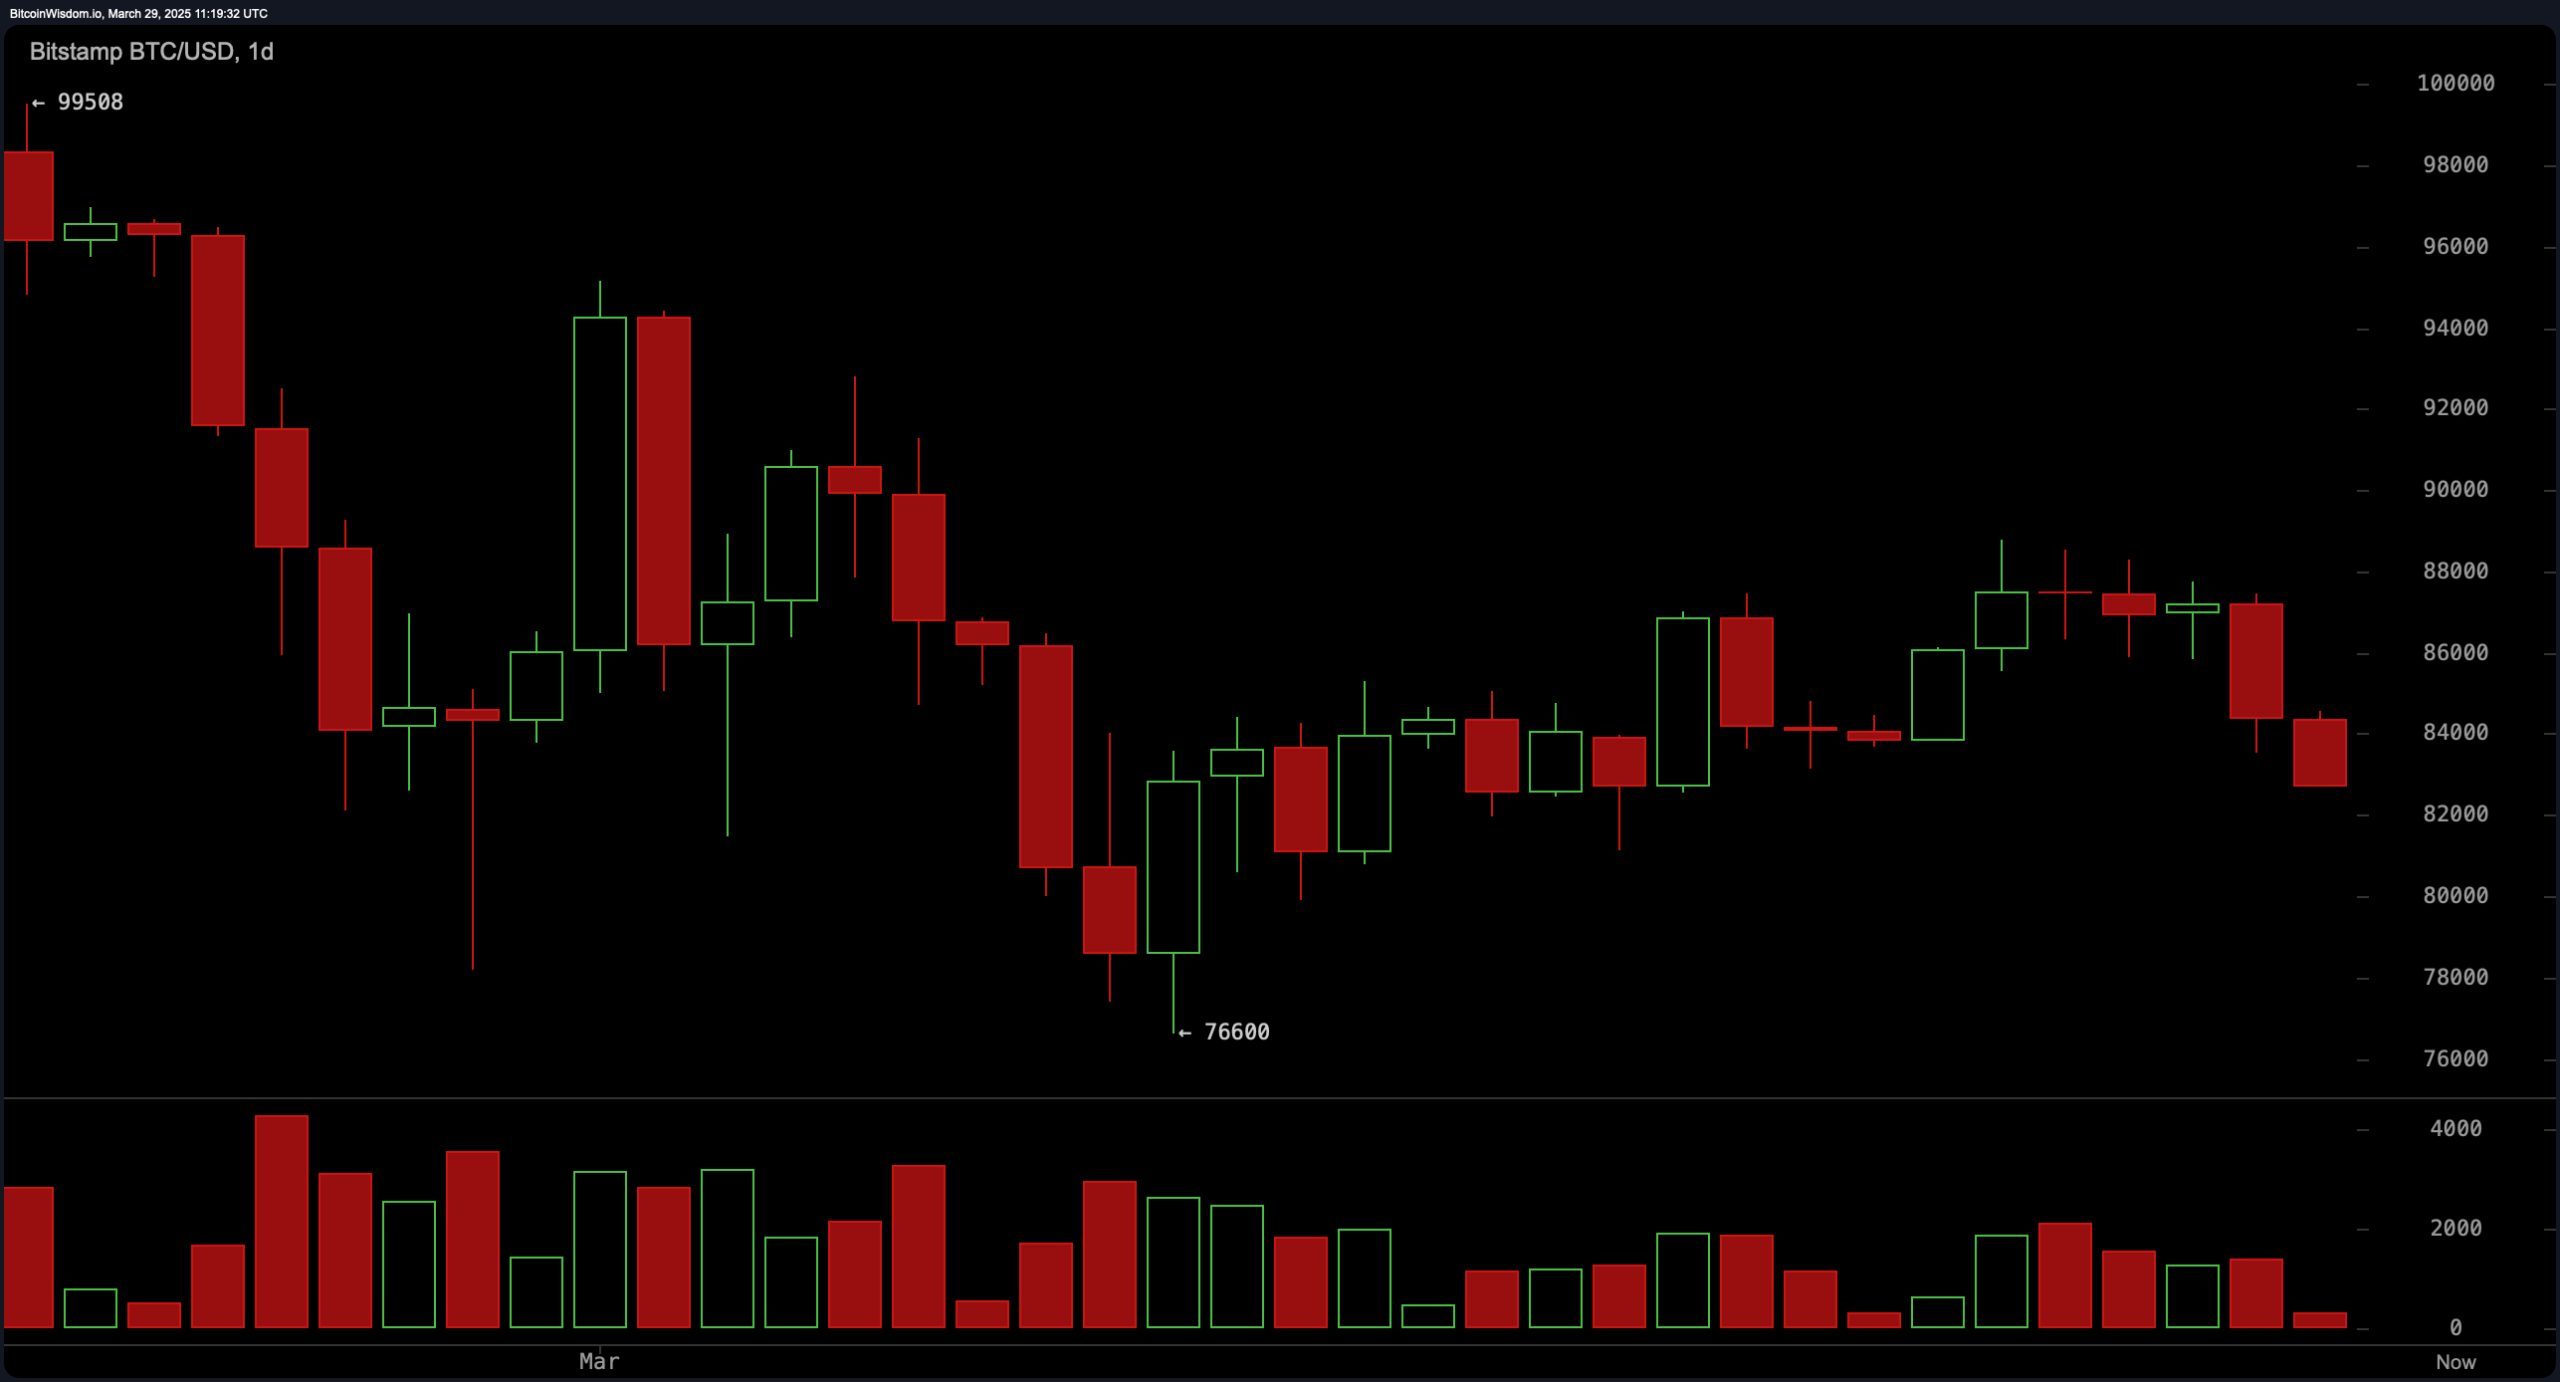
On the daily chart, bitcoin has shown a prolonged decline from its peak at $99,508. The key support level at $76,600 remains intact, while resistance ranges from $88,000 to $90,000. The bearish structure remains prominent, with volume spikes occurring mostly on red candles. Traders may look for buying opportunities only if bitcoin manages a decisive breakout above $90,000. Otherwise, further downside may be anticipated.
BTC/USD 1D chart via Bitstamp on March 29, 2025.
Oscillators present a predominantly neutral outlook, with the relative strength index (RSI) at 43, Stochastic at 49, commodity channel index (CCI) at -32, and the average directional index (ADX) at 23, all signaling indecision. The awesome oscillator also remains neutral. However, the momentum indicator at -3,954 suggests downward pressure, while the moving average convergence divergence (MACD) at -831 offers a buying signal, hinting at potential price stabilization.
Moving averages (MAs) across various timeframes align with the bearish narrative. The exponential moving average (EMA) and simple moving average (SMA) for the 10, 20, 30, 50, 100, and 200-periods all signal selling. Notably, the EMA (10) at $85,196 and the SMA (10) at $85,446 reinforce immediate selling pressure. Long-term MAs like the SMA (200) at $85,809 indicate that sustained recovery remains unlikely without significant buying interest.
Fibonacci retracement levels further illustrate key resistance points. On the daily chart, bitcoin remains below the 50% retracement level at $88,054, suggesting further downside risk. The 4-hour chart shows resistance at the 50% level of $85,728, while the 1-hour chart highlights $84,517 at the 61.8% level as a crucial inflection point. A failure to reclaim these levels would likely lead to further declines. Conversely, a breakout above these Fibonacci markers could trigger a short-term bullish reversal.
Bull Verdict:
If bitcoin manages to break above the key resistance levels of $85,000 and $86,000 on strong volume, a short-term bullish reversal could emerge. The buy signal from the MACD (moving average convergence divergence) offers a glimmer of potential upward momentum. A sustained move beyond the 50% Fibonacci retracement levels across multiple timeframes would further support a bullish case, with targets around $88,000 to $90,000.
Bear Verdict:
The prevailing bearish momentum across the 1-hour, 4-hour, and daily charts, combined with continuous lower highs and lower lows, indicates a strong possibility of further downside. With moving averages showing clear sell signals and oscillators lacking bullish conviction, bitcoin may face additional pressure. A breakdown below the $82,685 support level could accelerate losses, potentially driving the price toward the long-term support near $76,600.
免责声明:本文章仅代表作者个人观点,不代表本平台的立场和观点。本文章仅供信息分享,不构成对任何人的任何投资建议。用户与作者之间的任何争议,与本平台无关。如网页中刊载的文章或图片涉及侵权,请提供相关的权利证明和身份证明发送邮件到support@aicoin.com,本平台相关工作人员将会进行核查。