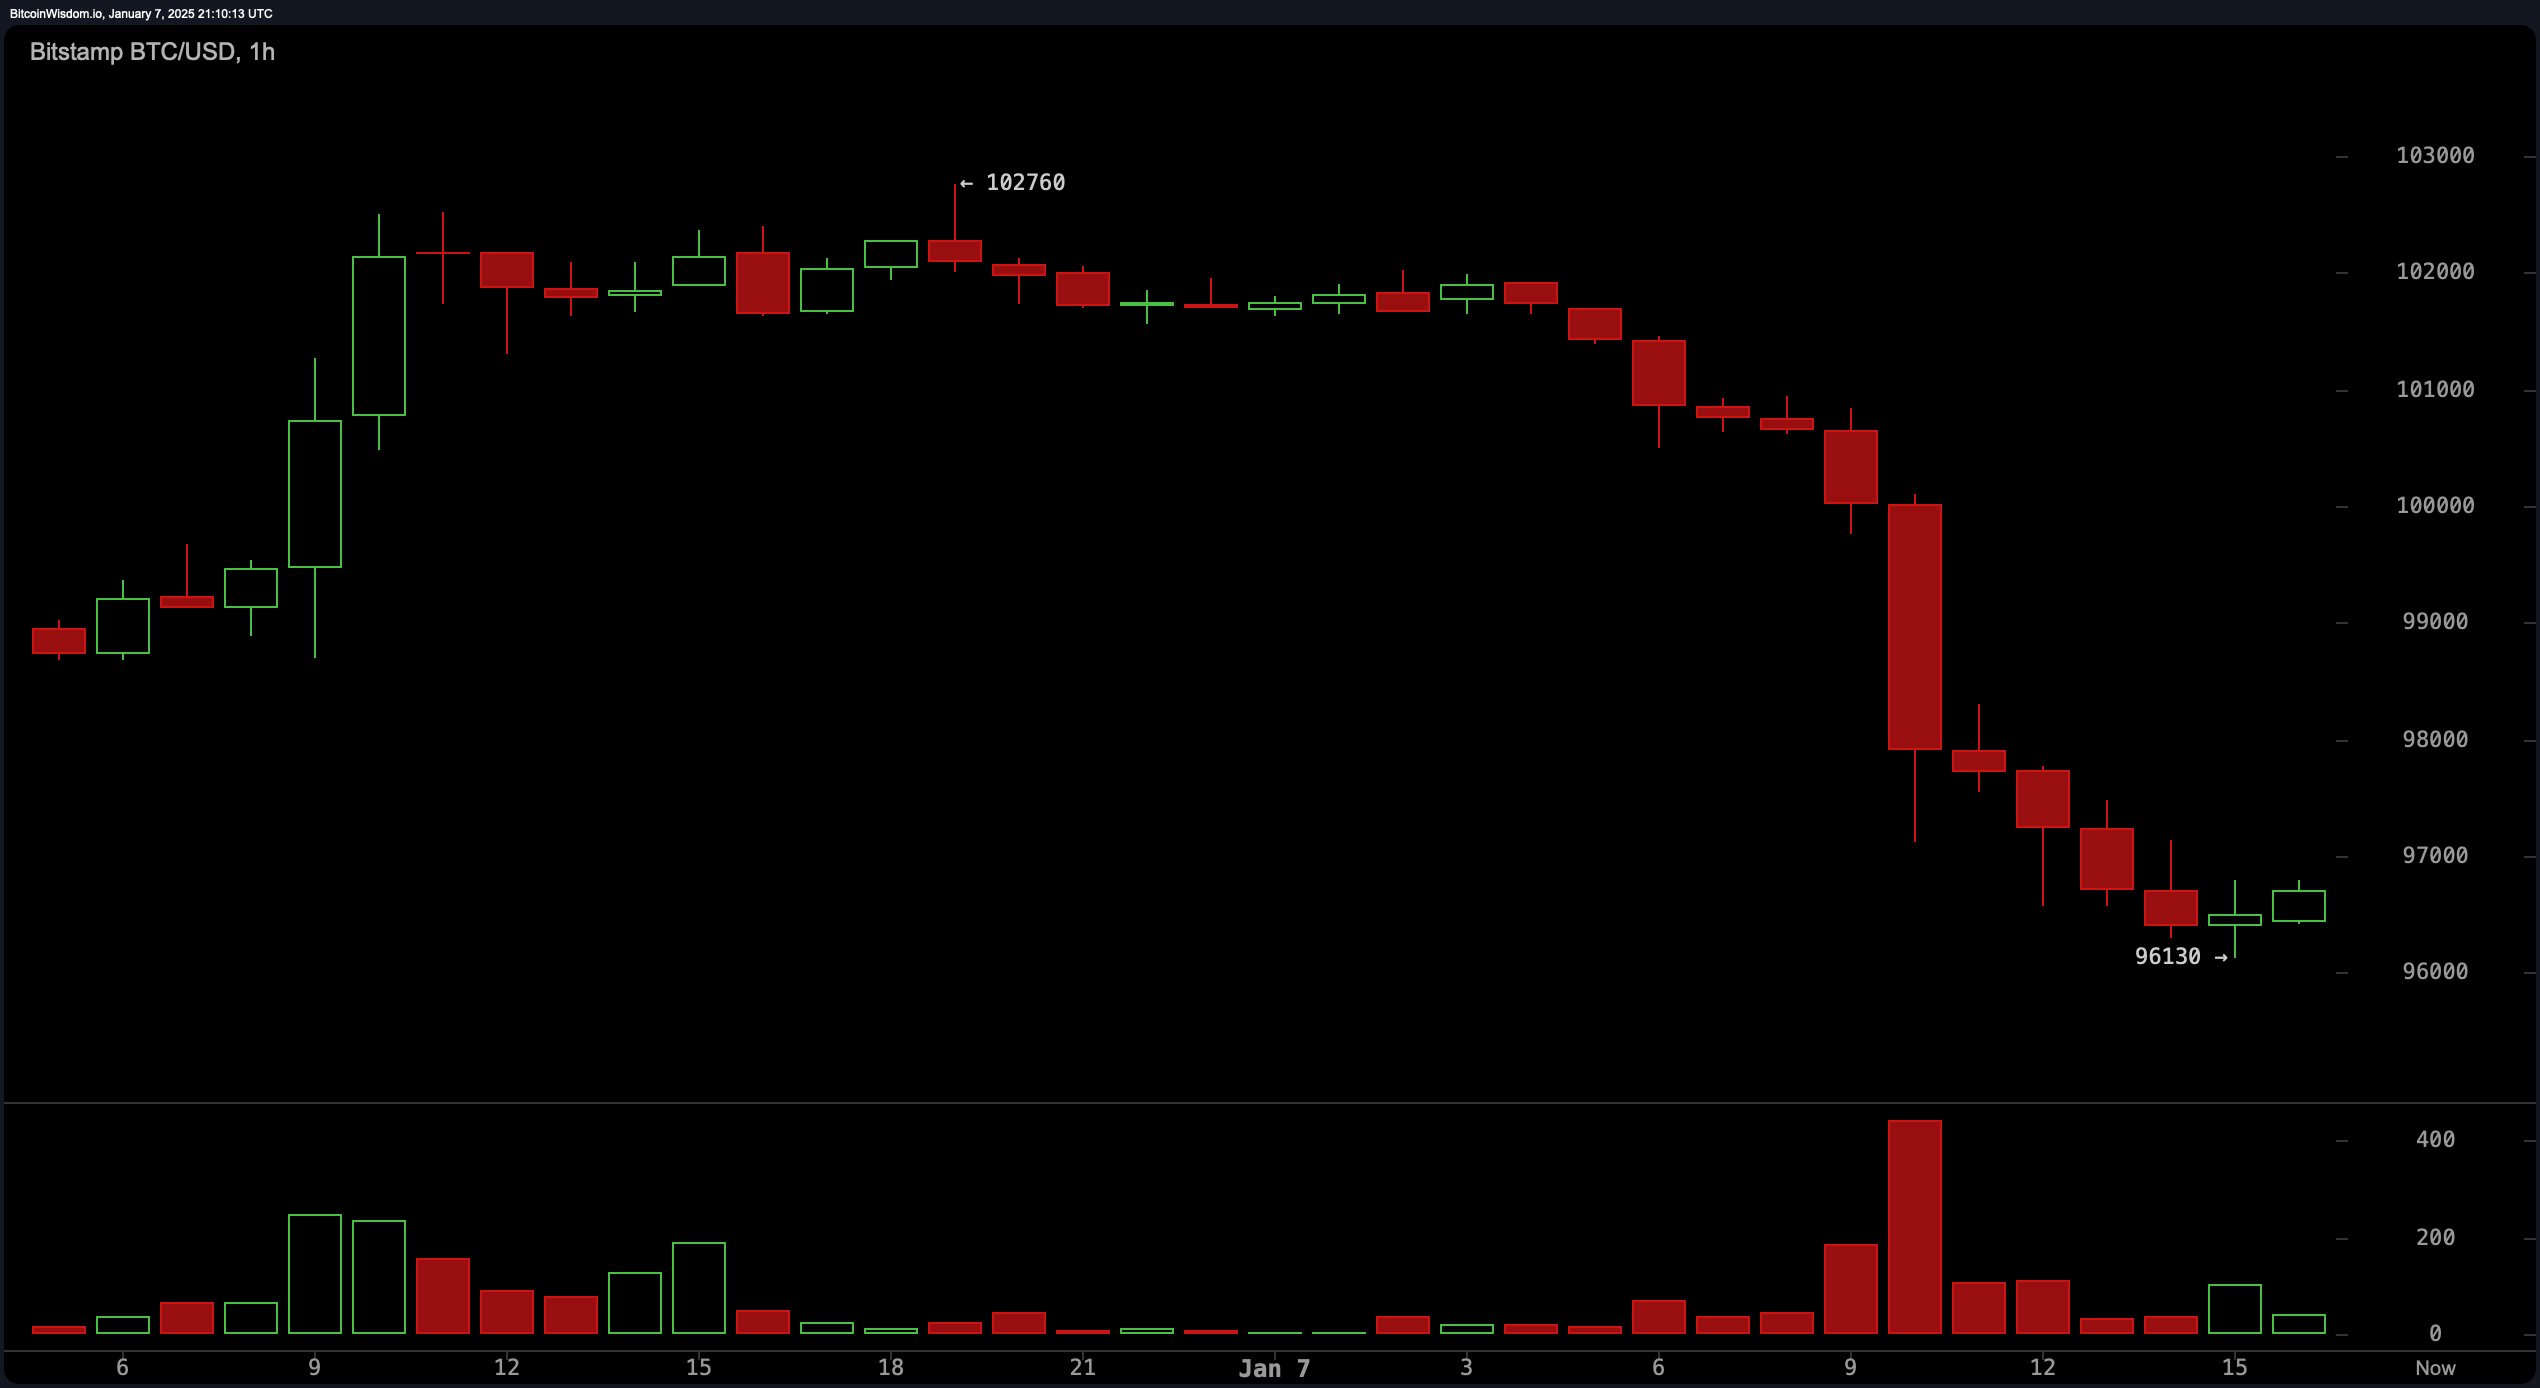
Bitcoin‘s one-hour chart delineates a pronounced downward trajectory, now stabilizing around $96,000, with diminished buying enthusiasm hinting at an enduring bearish trajectory. Immediate support is nestled at $96,000, with resistance observed between $97,500 and $98,000. A decline in volume during this stabilization period points towards a probable continuation of the preceding downward trend. Investors should keep an eye on any potential drop below $96,000, which might herald a move towards even lower thresholds.

BTC/USD 1H chart via Bitstamp on Jan. 7, 2025.
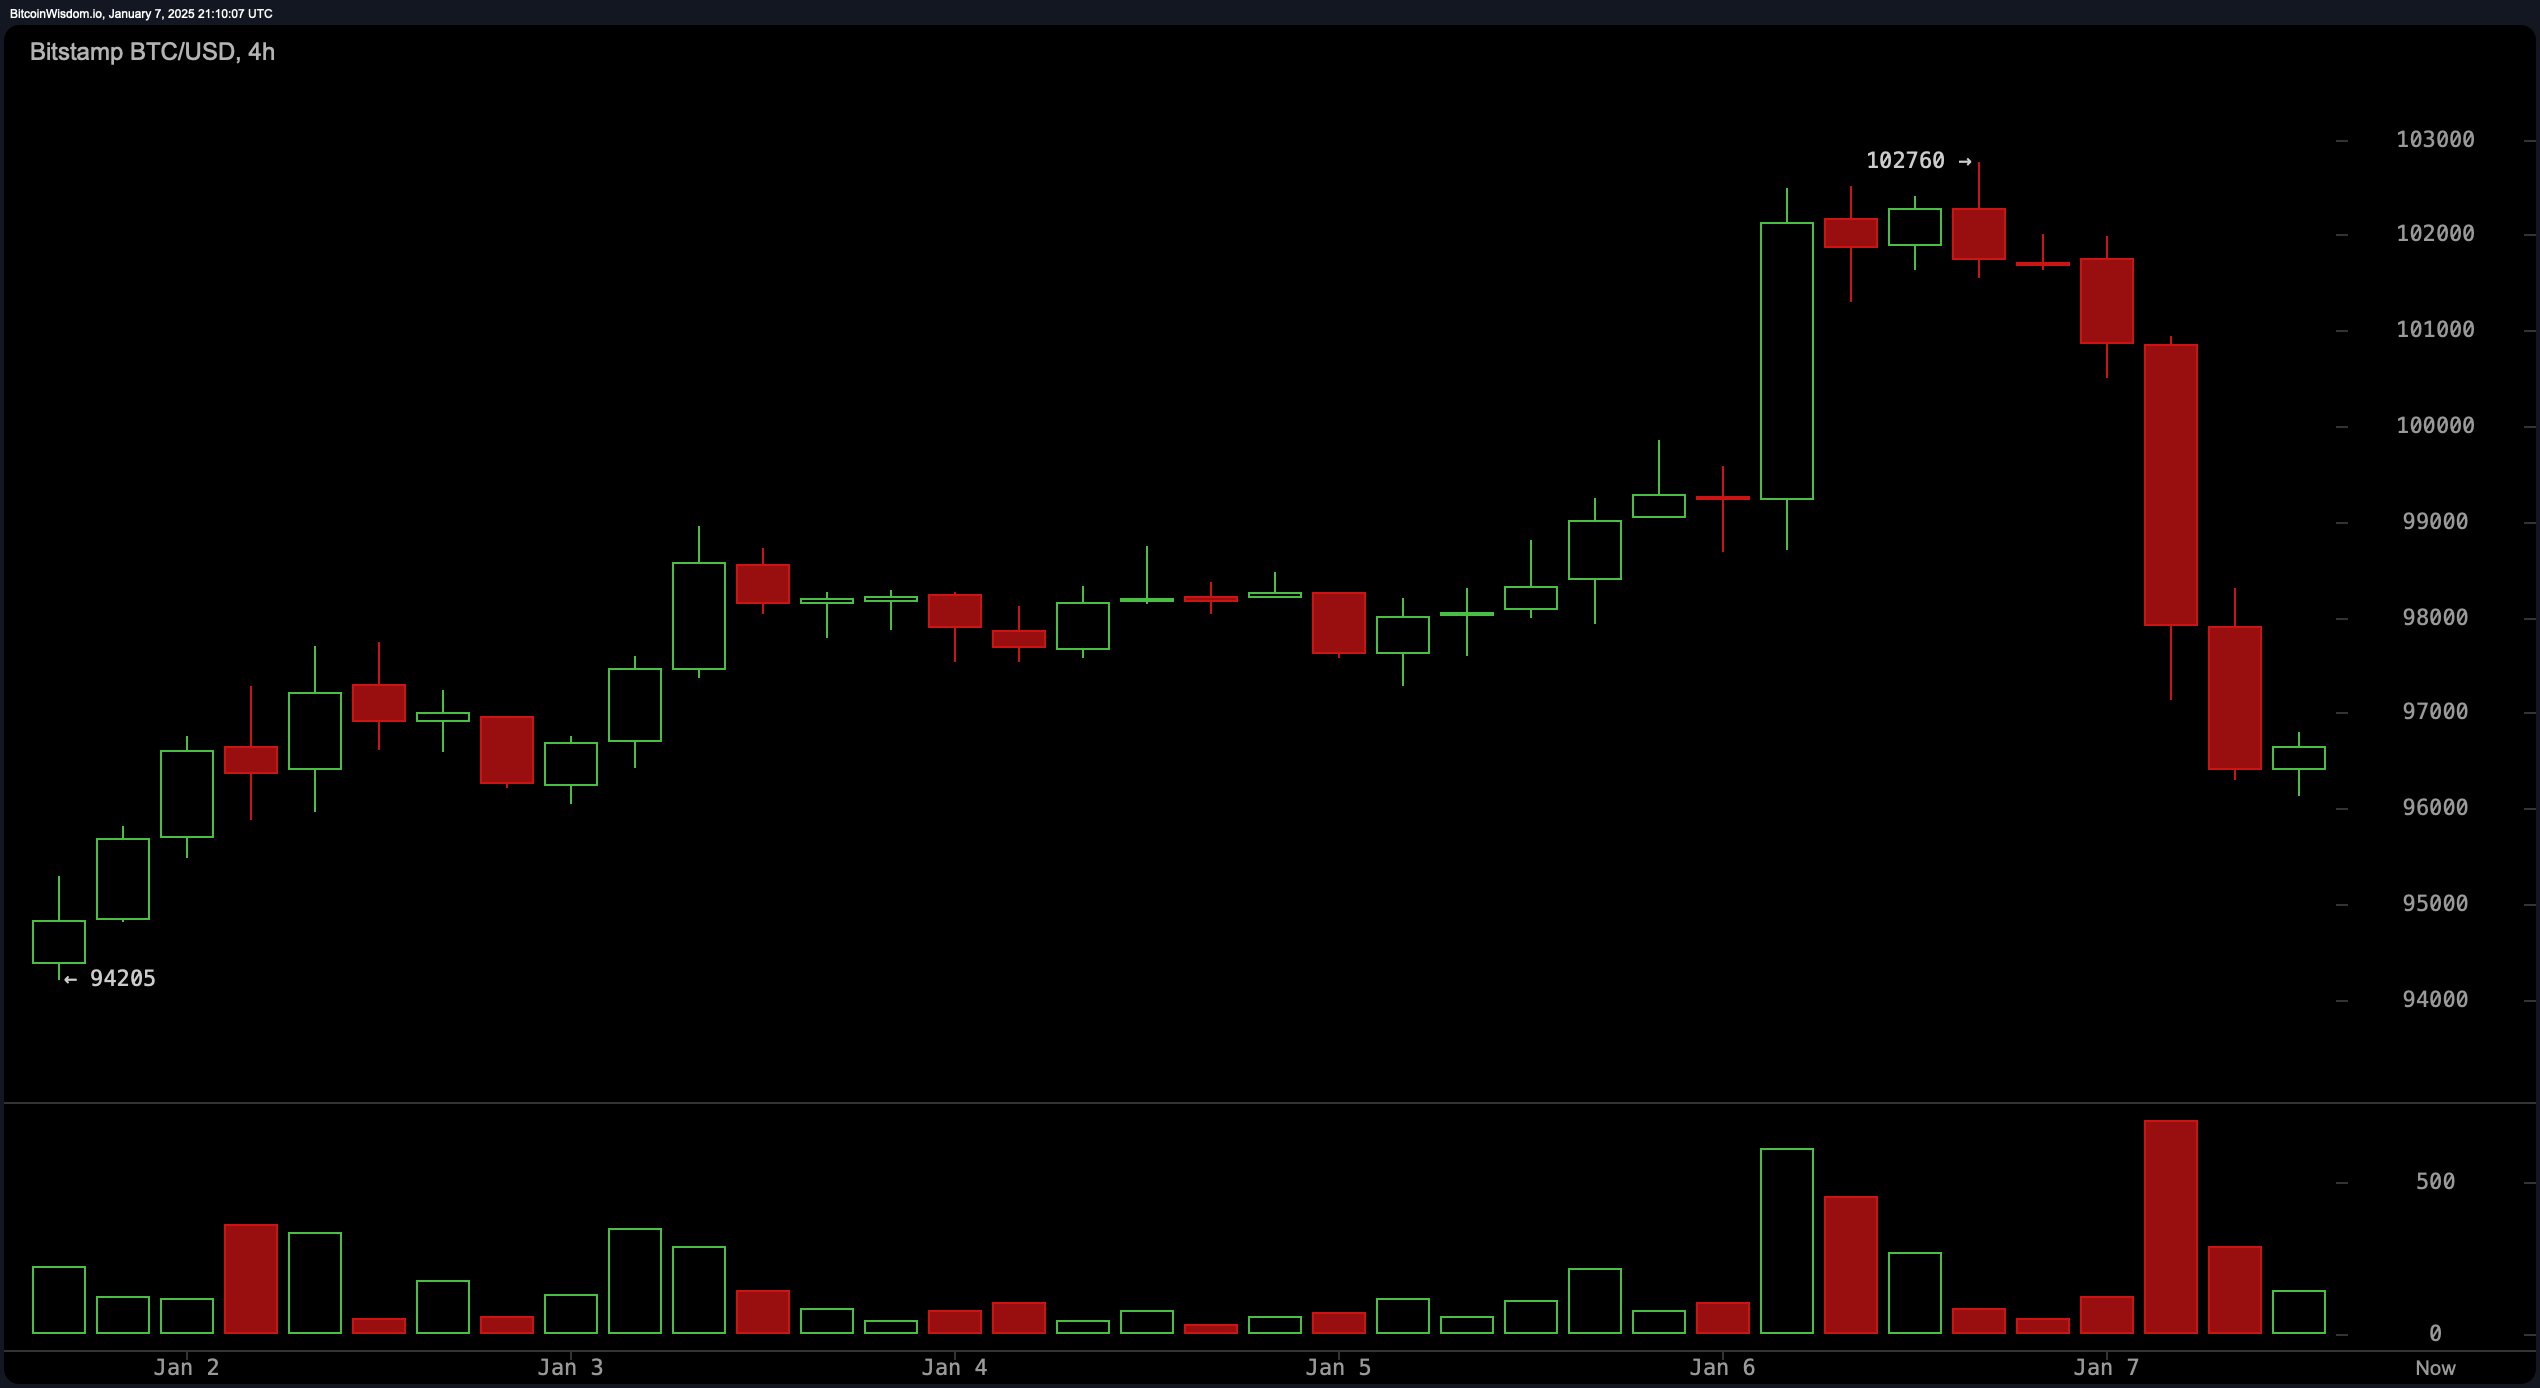
On the four-hour chart, bitcoin’s plunge from $102,760 to the $96,000 zone signifies a dramatic sell-off, accompanied by significant volume, accentuating the bearish sentiment. Resistance is set at $97,500, while support spans from $94,000 to $96,000, defining the current trading range. The breach from an earlier phase of consolidation further suggests an ongoing downward force. A dip below $94,000 could propel the price towards the $91,000 level.

BTC/USD 4H chart via Bitstamp on Jan. 7, 2025.
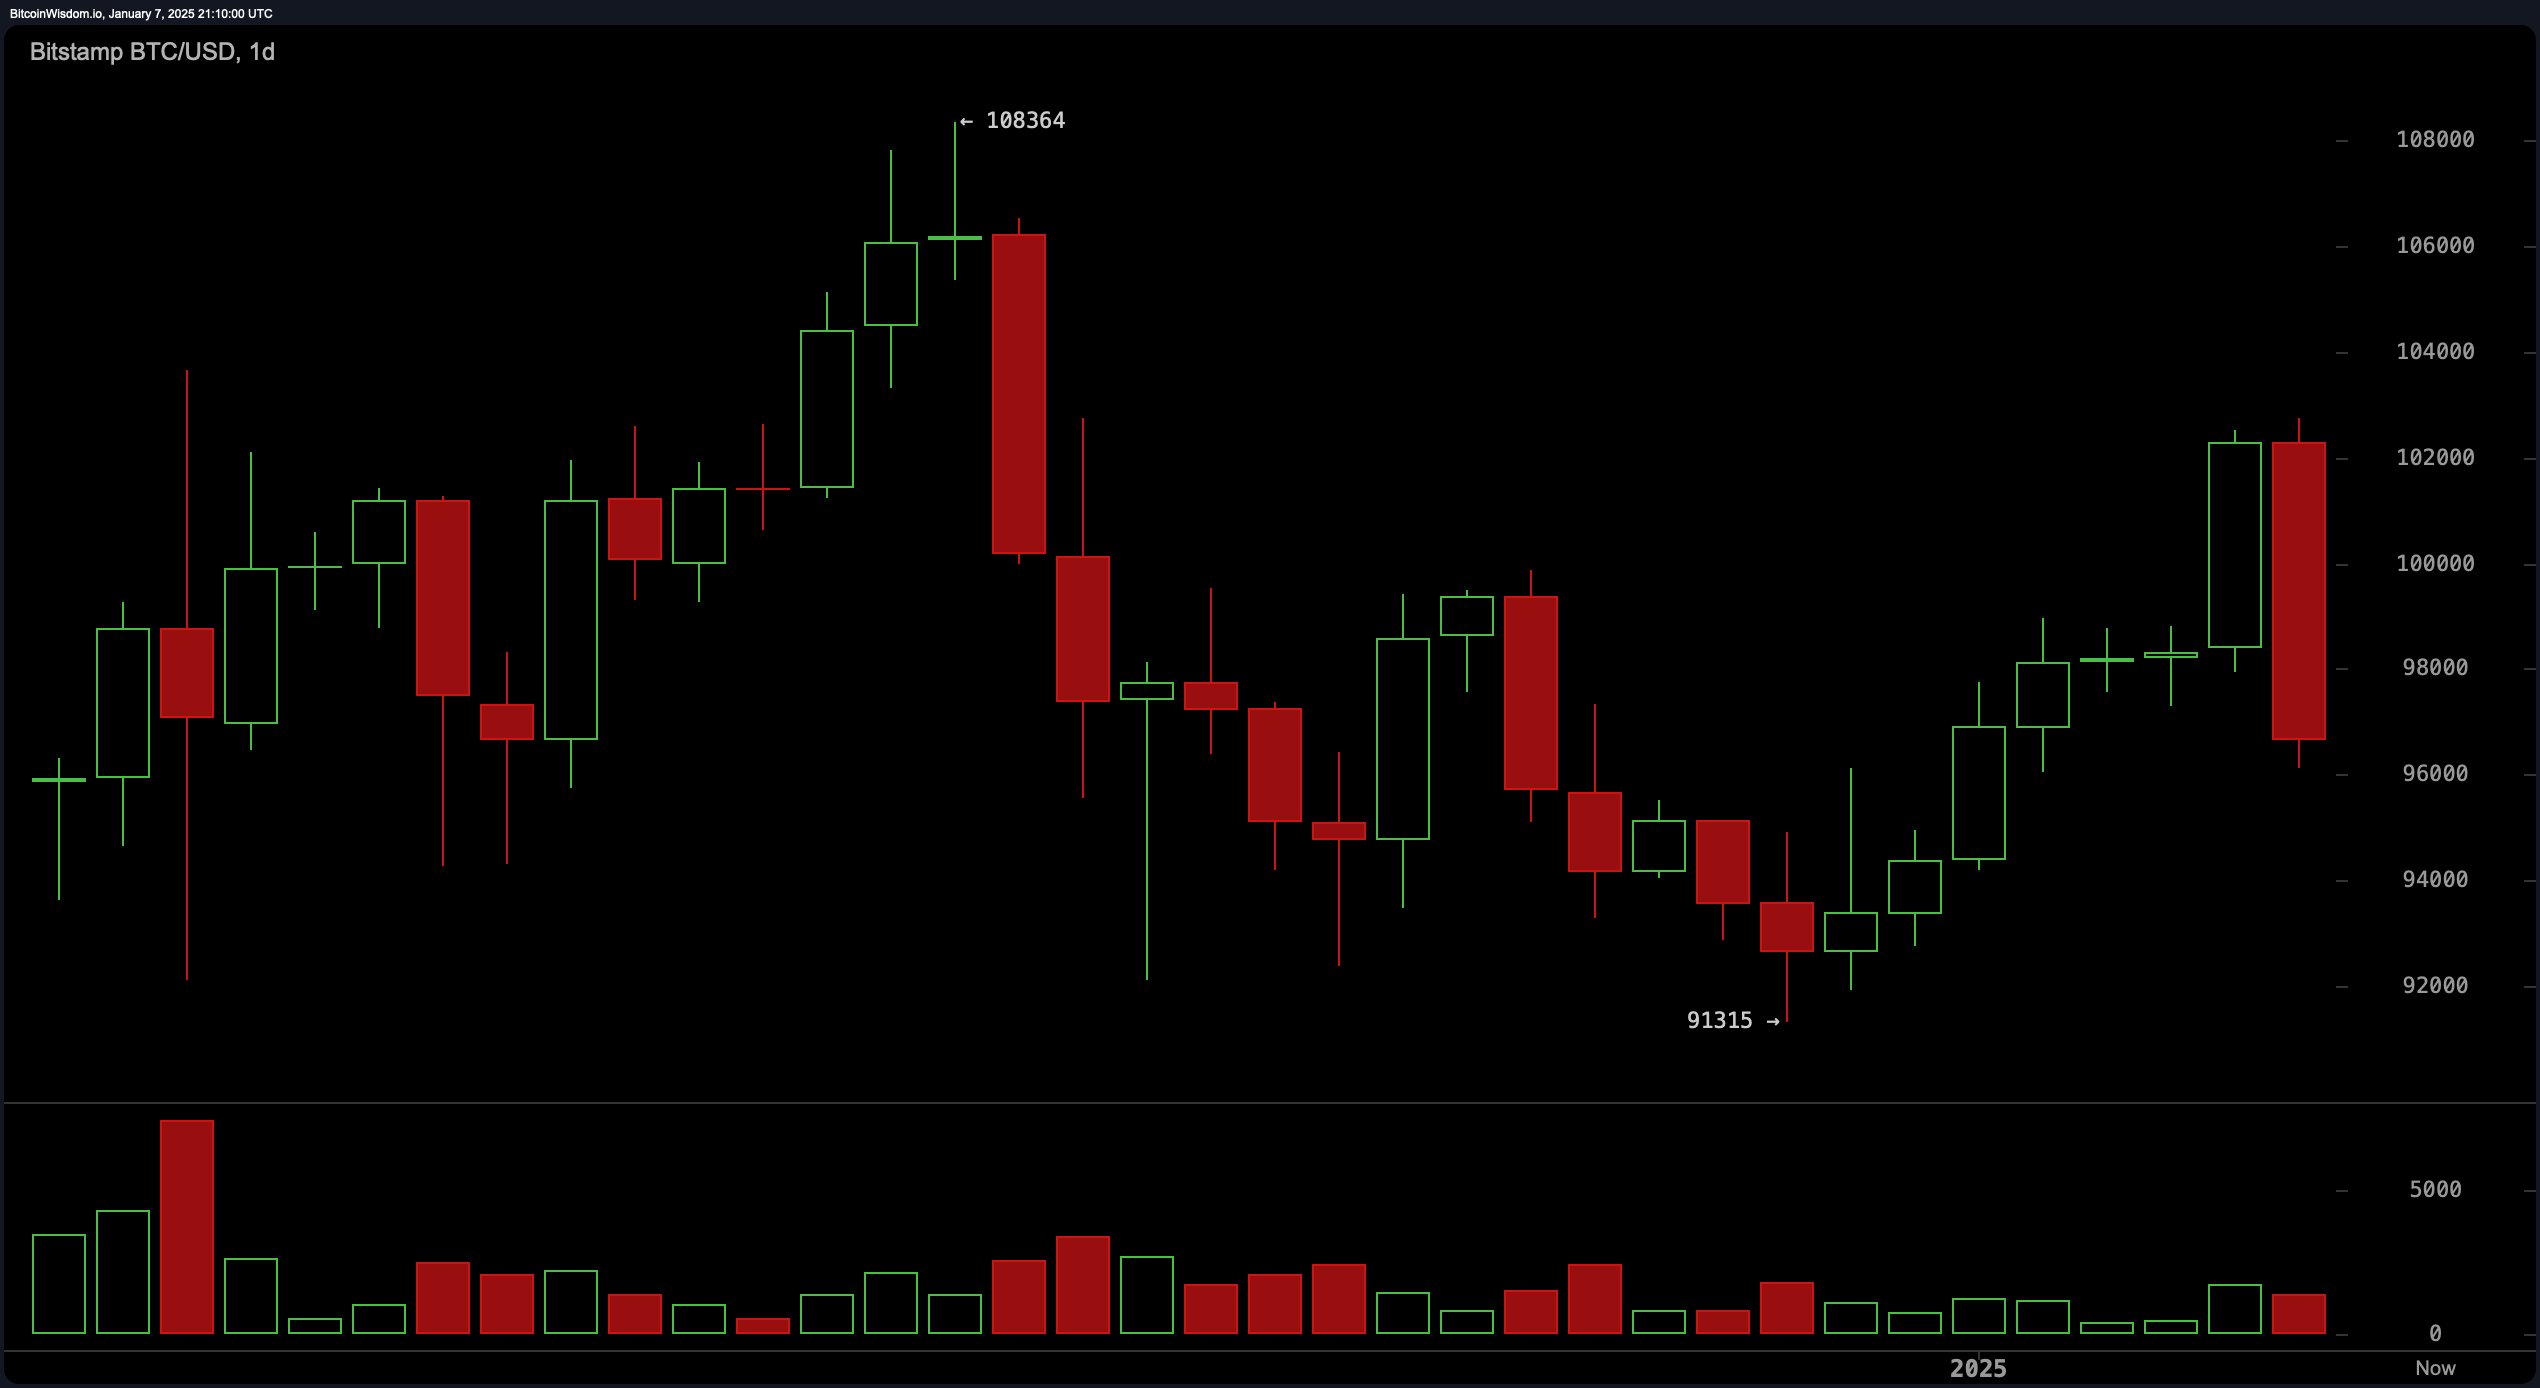
The daily chart sketches a wider bearish engulfing pattern, characterized by a significant red candle at the zenith of a prior upward trend. Critical levels include resistance at $108,000 and support at $93,000, the latter marking the trough before the recent ascent. The surge in trading volume alongside this fall signifies formidable selling pressure. Should the price stabilize above $93,000, there could be a phase of stabilization; however, an inability to maintain this level might hasten further declines.

BTC/USD 1D chart via Bitstamp on Jan. 7, 2025.
Oscillator readings offer a convoluted view, with the relative strength index (RSI) at 49 and the Stochastic oscillator at 76, both suggesting neutral momentum. The commodity channel index (CCI) also hovers neutrally at 77, while the average directional index (ADX) at 18 indicates a lack of robust directional momentum. Notably, the awesome oscillator advocates for a buy, whereas momentum signals negative sentiment, highlighting a discord in short-term indicators.
Moving averages shed further light on the prevailing bearish climate. Shorter-term exponential moving averages (EMA) of 10, 20, and 30 days advocate for sell signals, while the corresponding simple moving averages (SMA) suggest buy signals, contributing to the market’s complexity. However, longer-term indicators like the 100-day and 200-day EMAs and SMAs maintain a bullish stance, suggesting an underlying resilience despite the immediate downward pressure.
Bull Verdict:
If bitcoin successfully consolidates above $96,000 to $97,000 with declining selling pressure, it could establish a foundation for a reversal toward higher resistance levels, such as $98,500 and $100,000. The long-term bullish signals from the 100-day and 200-day moving averages suggest resilience remains intact, providing hope for a recovery if the broader market sentiment improves.
Bear Verdict:
The persistent bearish signals across multiple timeframes, coupled with weak buying momentum and a potential breakdown below $96,000, favor further downside movement. If the $93,000 support level fails to hold, bitcoin could swiftly test $91,000 or lower, reinforcing the dominance of sellers in the current market environment.
免责声明:本文章仅代表作者个人观点,不代表本平台的立场和观点。本文章仅供信息分享,不构成对任何人的任何投资建议。用户与作者之间的任何争议,与本平台无关。如网页中刊载的文章或图片涉及侵权,请提供相关的权利证明和身份证明发送邮件到support@aicoin.com,本平台相关工作人员将会进行核查。


