XRP’s upward momentum has brought the crypto asset close to a pivotal resistance zone at $2.65, with short-term oscillators and moving averages (MAs) offering a mixed picture for traders.
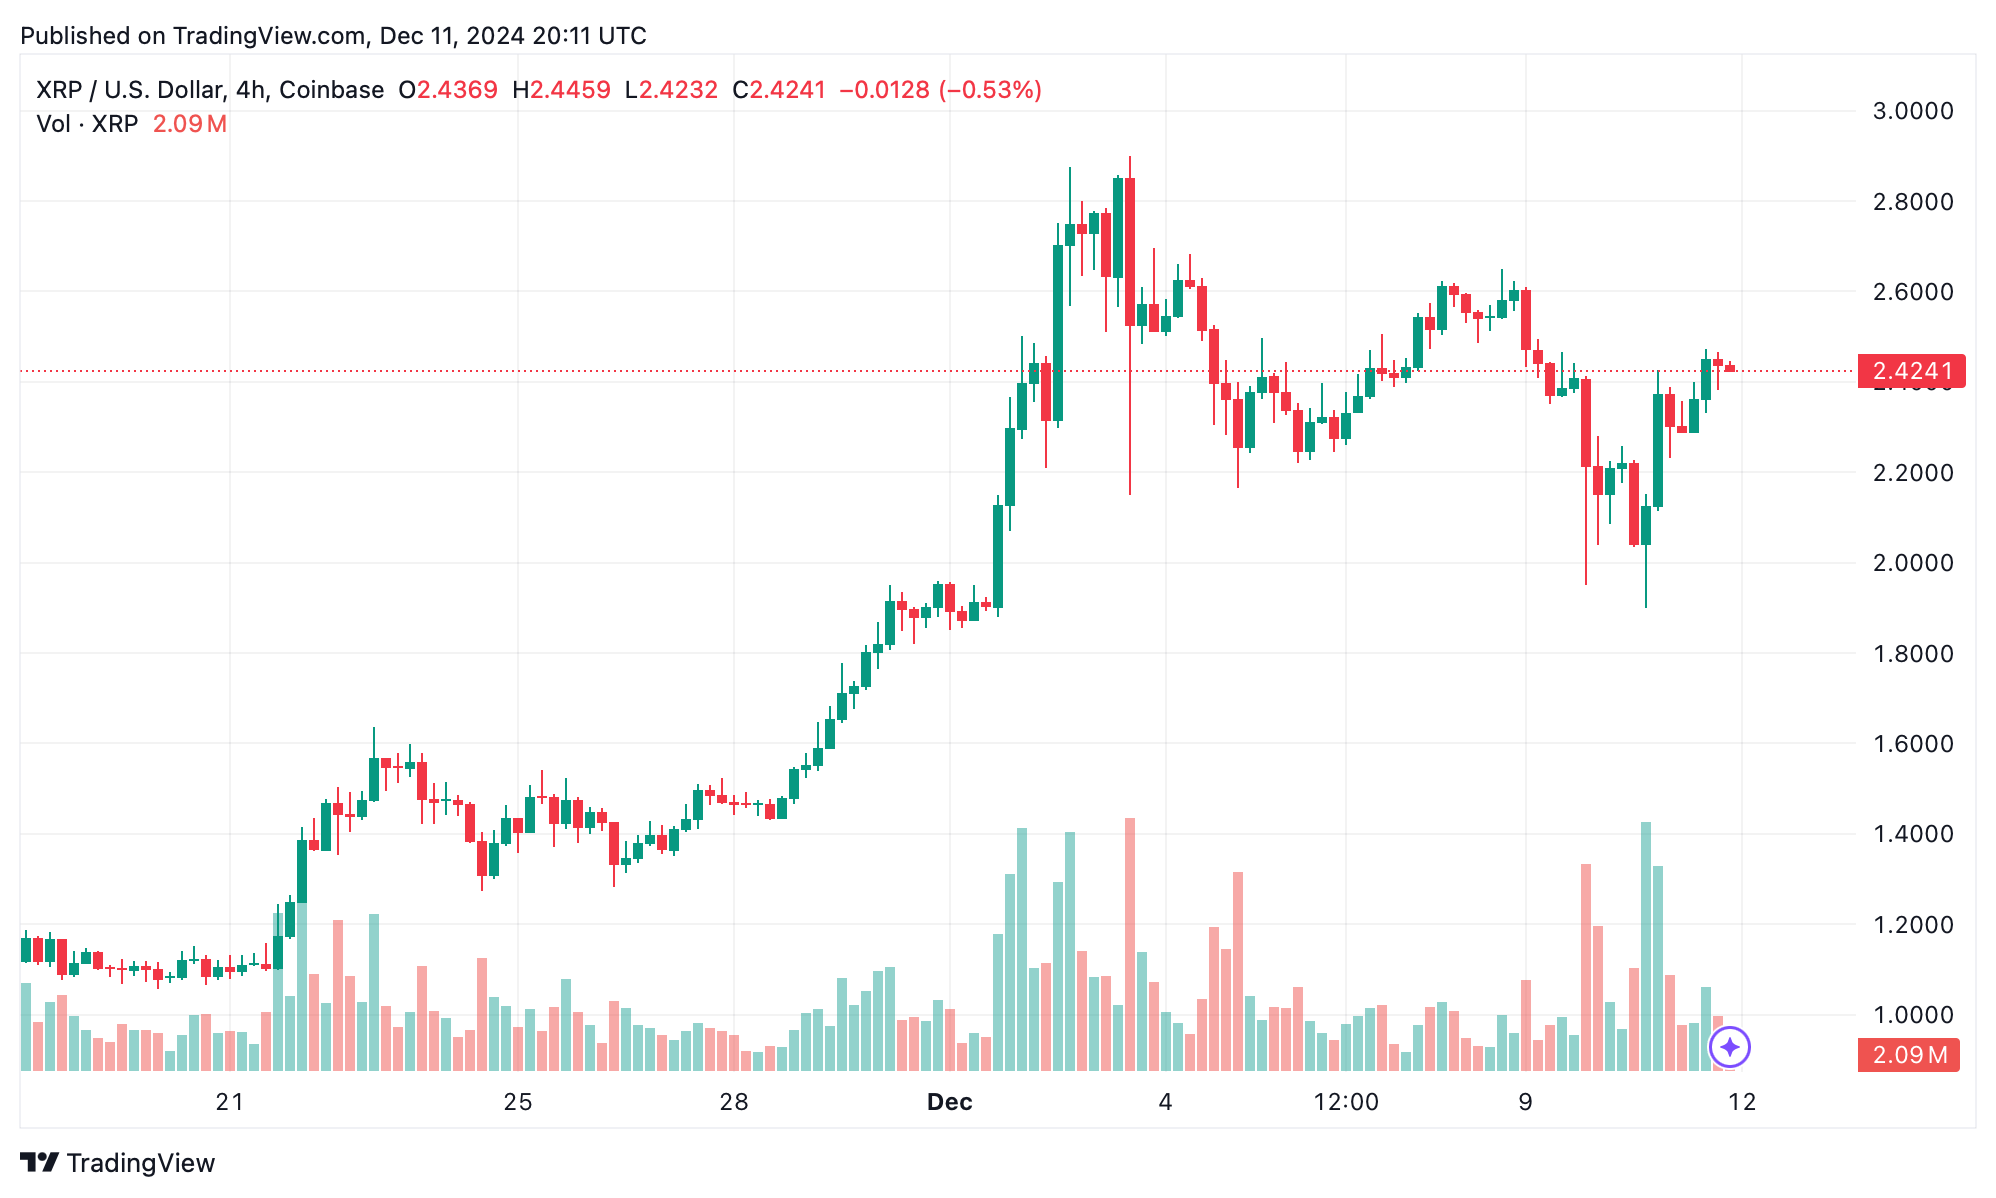
XRP 4H chart on Dec. 11, 2024.
On the 4-hour chart, XRP bounced sharply from its December 10 low of $1.898, propelled by robust buying volume. As it consolidates around $2.40, volume has tapered, suggesting a pause in the rally. Key exponential moving averages (EMA) such as the 20-period ($2.04978) and 30-period ($1.80879) remain supportive, while the simple moving average (SMA) for 10 periods ($2.45043) signals near-term selling pressure.
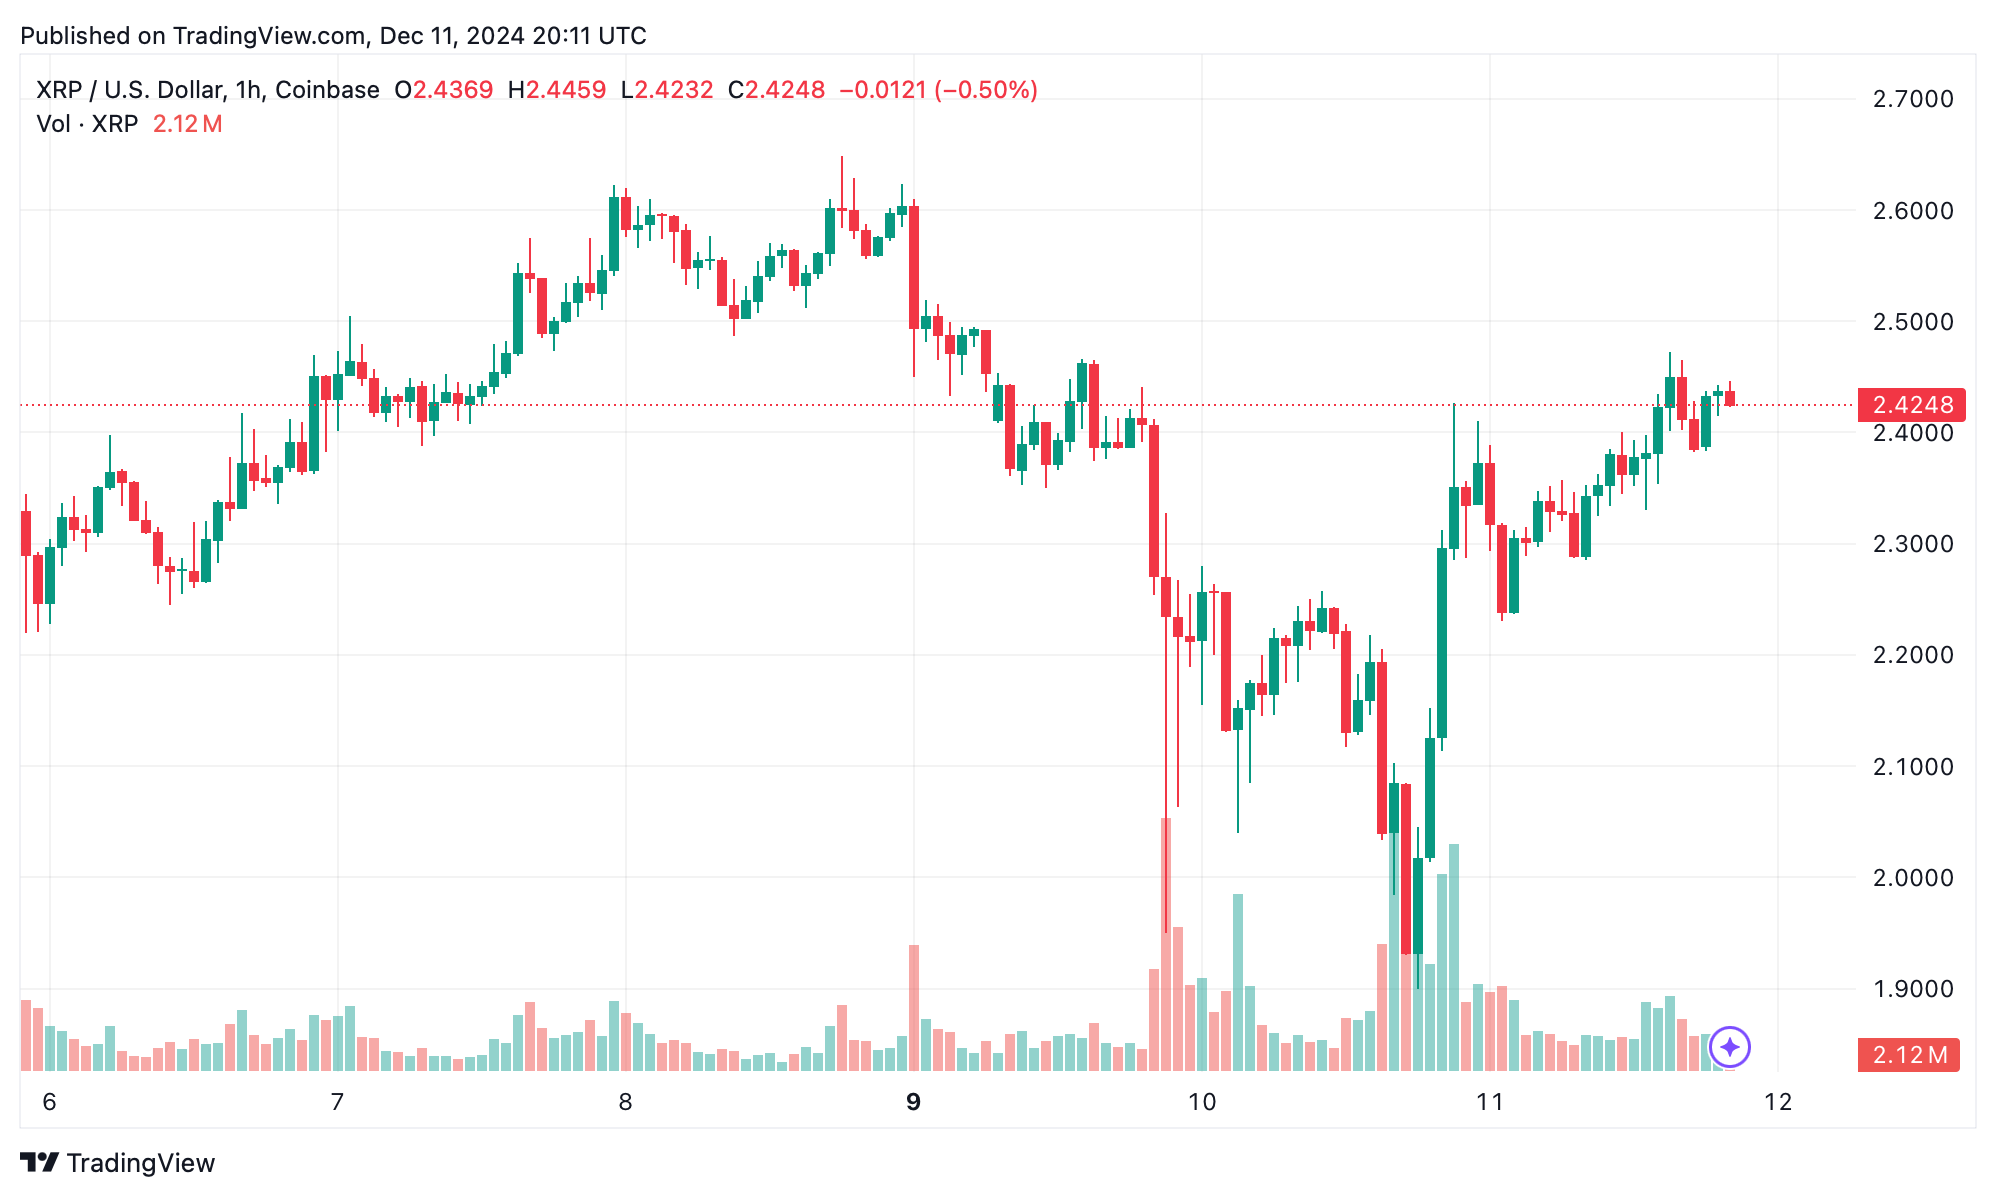
XRP 1H chart on Dec. 11, 2024.
The 1-hour chart reveals a series of higher lows since the $1.898 bottom, with resistance emerging between $2.474 and $2.50. The relative strength index (RSI) at 65.35307 is neutral, indicating the potential for either a breakout or retracement. Momentum and the moving average convergence divergence (MACD) suggest caution, with both signaling a sell position.
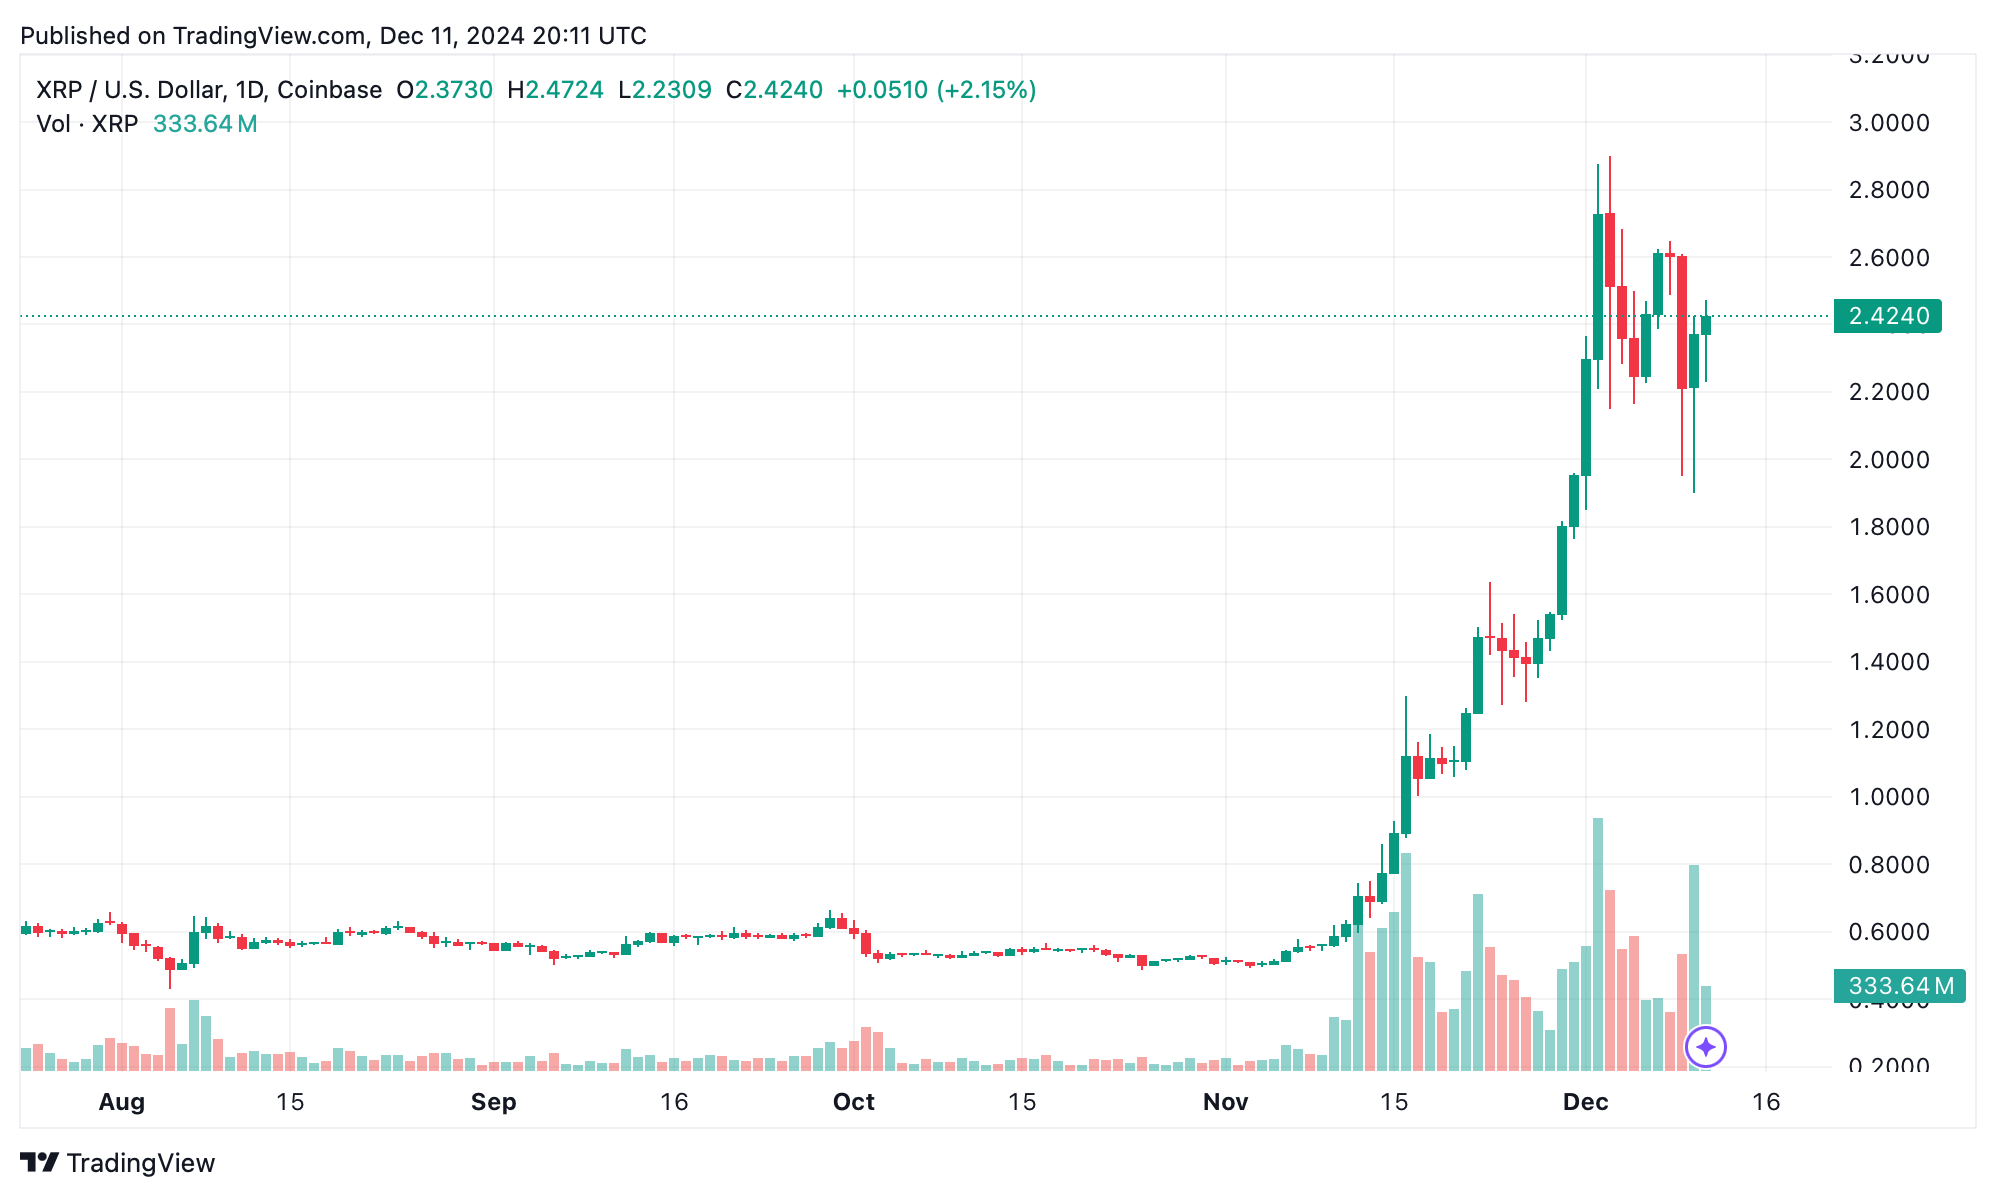
XRP Daily chart on Dec. 11, 2024.
On the daily timeframe, XRP continues to reflect bullish patterns despite facing resistance at $2.65. The rally from a $0.5141 low to $2.909 has formed a higher low at $1.898, affirming the overall uptrend. Key EMAs such as the 200-period ($0.85717) and 100-period ($1.10811) further solidify XRP’s bullish foundation. However, declining volume during the recent rally suggests waning momentum. The commodity channel index (CCI) at 56.48218 and awesome oscillator (AO) at 0.85351 both remain neutral, adding to the mixed signals. Targets above $2.65 would aim for $2.90, but a breach below $2.10 could threaten further downside.
The oscillators present a neutral outlook overall, with key indicators like the Stochastic oscillator at 63.48869 and average directional index (ADX) at 63.99980 reflecting neither strong bullish nor bearish bias. Moving averages show strength in mid- to long-term trends, with significant buy signals in EMAs from 20-period through 200-period.
Bull Verdict:
If XRP breaks through the $2.65 resistance level with strong volume and maintains higher lows, the uptrend could accelerate toward $2.9 and beyond. The bullish signals from longer-term exponential moving averages (EMAs) and the intact uptrend on the daily chart provide a favorable backdrop for further gains.
Bear Verdict:
A failure to break above $2.65, coupled with declining volume and neutral oscillator readings, could lead XRP to retrace toward key support levels at $2.2 or even $1.898. A breakdown below $2.1 would signal a deeper correction and challenge the bullish narrative.
免责声明:本文章仅代表作者个人观点,不代表本平台的立场和观点。本文章仅供信息分享,不构成对任何人的任何投资建议。用户与作者之间的任何争议,与本平台无关。如网页中刊载的文章或图片涉及侵权,请提供相关的权利证明和身份证明发送邮件到support@aicoin.com,本平台相关工作人员将会进行核查。