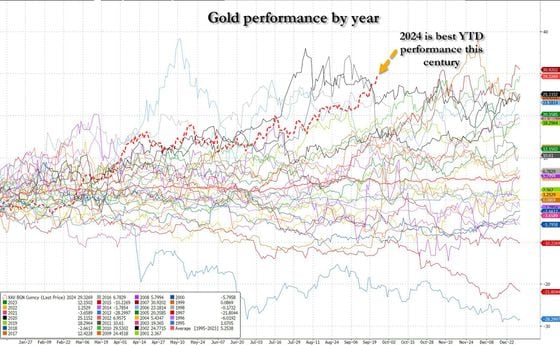
9月24日,金融资产飙升至创纪录水平,其中标普500指数达到了5735点的历史最高水平,黄金价格也攀升至每盎司2670美元。事实上,黄金今年以来上涨了30%,使2024年成为本世纪黄金表现最佳的一年,详情请参阅Zerohedge。
但是是什么推动了金融市场的持续上涨?仔细观察发现,流动性和货币供应是关键因素。
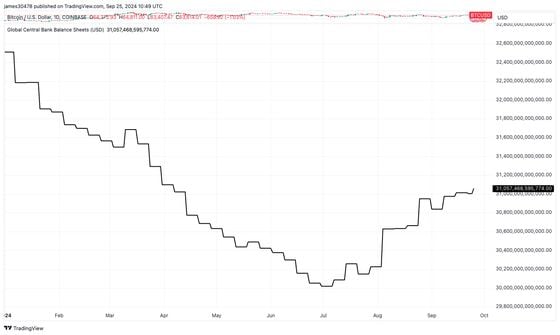
各国央行的政策大大促进了向全球经济注入流动性。截至9月25日,全球前15家央行的联合资产负债表超过了31万亿美元,这是自2024年4月以来的最高水平。自7月以来,这一数字一直在上升,反映出对经济挑战和不确定性的重大货币刺激,这对支持金融市场至关重要。
中国的承诺大幅放松货币政策,再加上美联储大幅度的50个基点降息,进一步推动了市场势头,使得加密货币成为自9月18日FOMC会议以来表现最佳的资产。CME FedWatch Tool现在预测11月7日会议再次降息50个基点的概率为60%,这将使联邦基金利率区间降至4.25-4.50%。
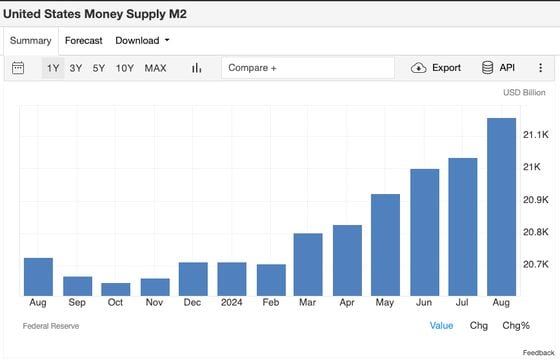
另一个流动性的关键指标是M2货币供应,包括流通中的实际货币、储蓄和定期存款以及货币市场互助基金。根据Trading Economics的数据,M2货币供应呈现了持续的月度增长趋势,这一趋势始于2024年2月。仅在8月,M2货币供应就环比增长了近1%,突显了持续的货币扩张。货币供应的增加对支持资产价格至关重要。
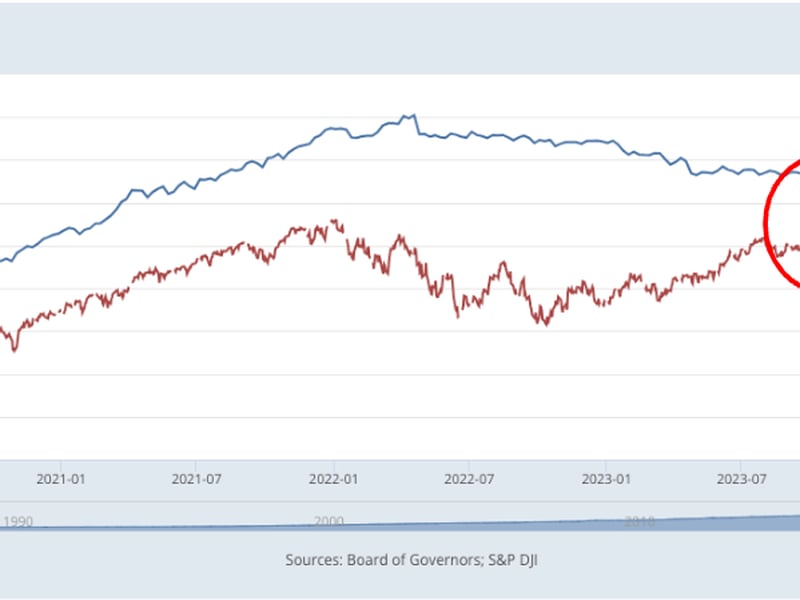
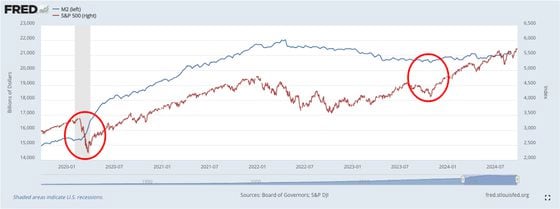
在过去五年中,标普500指数和M2货币供应之间存在着很强的相关性,两者同步变动。例如,在2020年初的大流行病期间,M2在2月份触底至15.2万亿美元,就在那之后的3月,标普500指数触及了约2409点的低点。类似的情况也发生在2023年10月,当时货币政策收紧导致M2触底至21万亿美元,随后标普500指数也触及了4117点的低点。这种关联突显了流动性在推动股市表现中的关键作用。
过去五年,M2货币供应的复合年增长率(CAGR)为7%,而标普500指数的CAGR为14%。尽管这代表了强劲的表现,但被比特币在同一时期惊人的50%的CAGR所掩盖。尽管比特币的波动性很大,但其更高的增长率反映了其作为一种资产类别日益突出,往往受益于推动传统市场的相同流动性动态。
央行的扩张性政策与不断增长的货币供应正在推动各类资产价格的上涨。无论是黄金、标普500指数还是比特币,与M2等货币指标的相关性突显了流动性在当今经济中仍然是资产表现的关键驱动因素。只要央行继续提供支持,金融市场很可能会继续上涨,尽管这一趋势的可持续性仍然是未来的问题。
免责声明:本文章仅代表作者个人观点,不代表本平台的立场和观点。本文章仅供信息分享,不构成对任何人的任何投资建议。用户与作者之间的任何争议,与本平台无关。如网页中刊载的文章或图片涉及侵权,请提供相关的权利证明和身份证明发送邮件到support@aicoin.com,本平台相关工作人员将会进行核查。


