作者:南枳,Odaily 星球日报
近期,以太坊Meme热潮重新回归,链上Gas也有所复苏。另一方面,以太坊上的 Meme市场氛围和玩家相较其他链,给大众的印象更偏向于「钻石手」,真正的赢家是「钻石手」还是PvP高手?他们的数据特征如何?
Odaily 星球日报在本文梳理了二十个Meme代币的TOP100盈利地址,包括数百万市值的BURGER、千万美元的DOGE、上亿市值的Nerio和MOG等多种代币,对其多维度特征进行解析。
数据来源与处理说明
本文各钱包的数据来自 GMGN,其中未修改的基础数据包括7天盈利、30天盈利、30天胜率、钱包余额。自定义数据包括:
- 总盈利:由于大量地址在GMGN上的总盈利数据存在偏差,本文采用「盈利最多的十个代币」减去「亏损最多的十个代币」的盈利值替代总盈利,不足十个时有几个计算几个。
- TOP盈利:剔除了GMGN上标记为「流动性不足」但大额获利的代币,此类多为市值造假的诈骗代币。然后分别统计盈利前1、3、5的代币的盈利值,亏损同理。
- 每次购买 / 出售平均盈利:30天总盈利÷30天内购买 / 出售次数。
此外本文手动移除了重复地址、通过转账获得大量代币的地址(此类地址盈利计算或存在问题)、MEV Bot地址,最后共有1581个地址。
钱包数据分析
有多少钻石手?
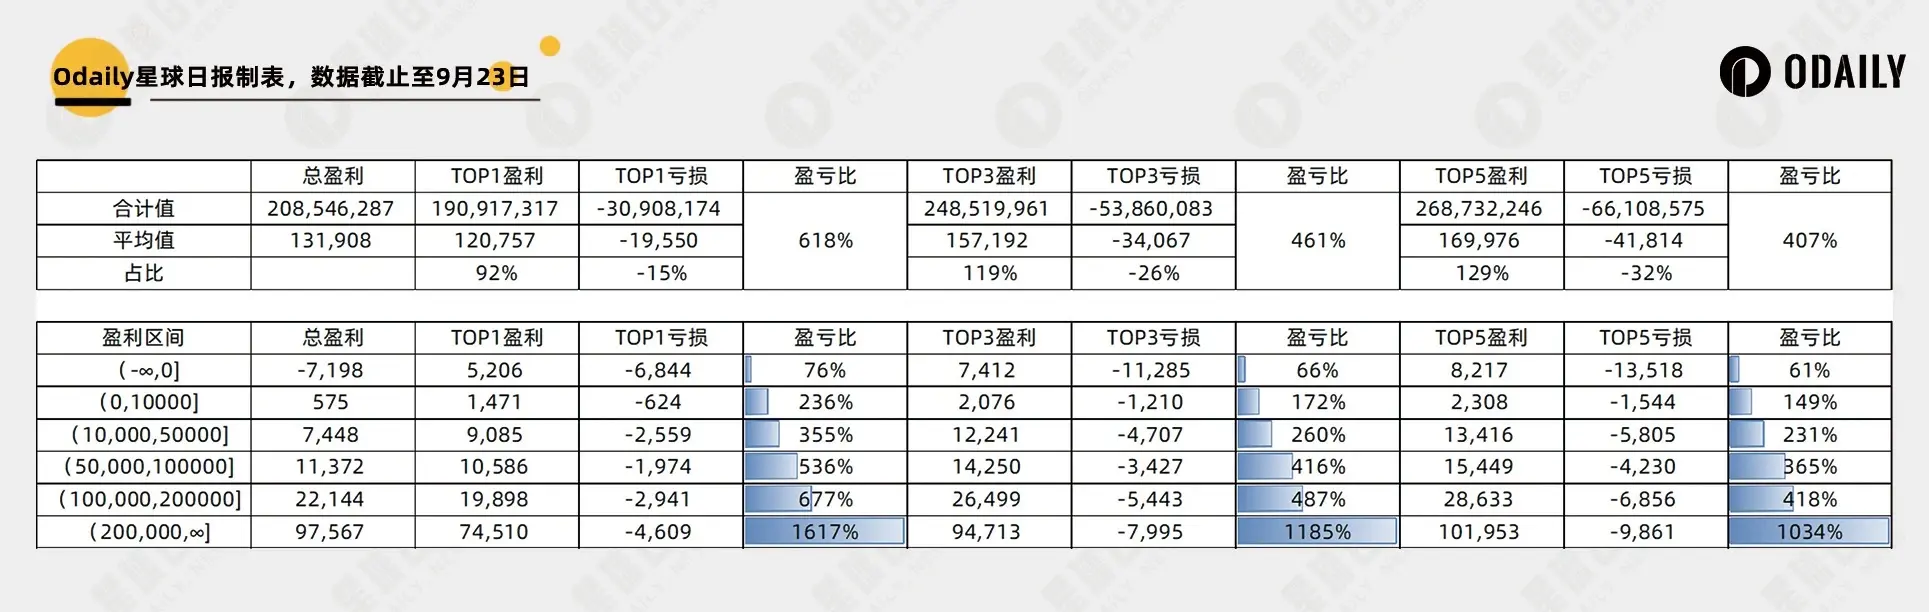
- 统计的1581个地址总盈利为2.08亿美元,平均盈利13.19万美元;
- 其中盈利TOP1的代币为这些地址带来了1.9亿美元的利润,平均盈利12.07万美元;
- 亏损TOP1的代币合计损失3090万美元,平均损失1.95万美元。
可见这些「聪明钱」在盈亏比方面表现良好,在600%的盈亏比下仅需14%的胜率即可实现收益持平。
进一步地,Odaily按照总盈利金额的不同对各个地址进行切分,并加入了TOP3和TOP5盈亏分析,结果如下图所示:
- 总盈利越多的地址,盈亏比或者说「钻石手程度」越高;
- TOP1的盈亏比相较TOP3、5更高,意味着这些「聪明钱」地址往往通过单个代币实现大额盈利。
钻石手们的出手频率?
进一步地,我们剔除了钱包内ETH余额小于0.1 ETH或30天内未进行过交易的地址,得到所有地址在30天内平均交易了337次,分总盈利区间详情如下表所示:
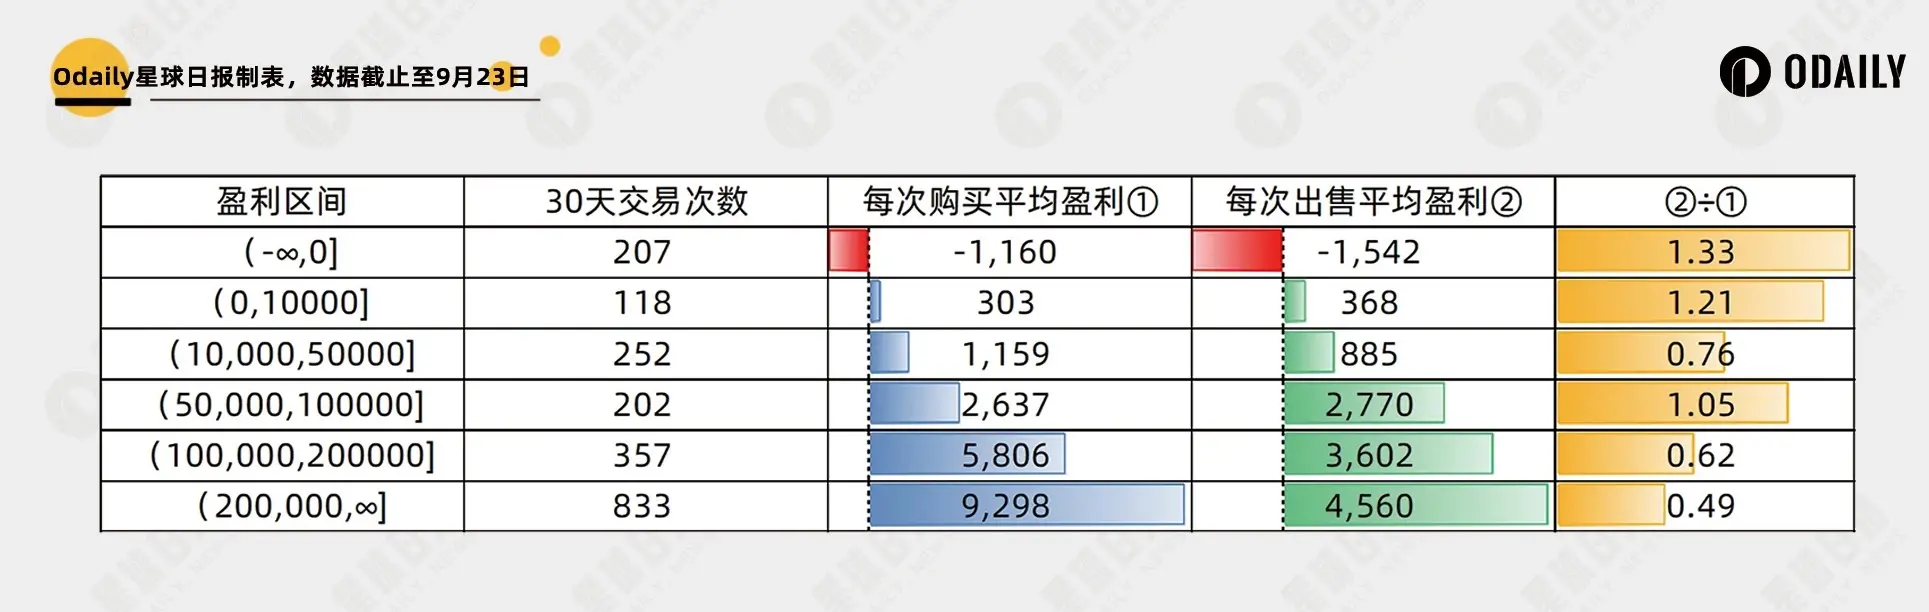
- 出乎意料地,盈利最多的地址出手频率远高于其他区间,或许这些地址更加频繁地尝试寻找机会;
- 而盈利最多的地址每次交易的盈利也远超其他地址,经查验主要是有少数几个地址在Nerio上线币安前购买了几笔价值上万美元的代币,导致单地址平均盈利特别高;
- 盈利10万美元以上的地址的「每次出售平均盈利÷每次购买平均盈利」显著小于其他区间,说明这些地址倾向于低频购买,然后分批出货。
胜率与盈利解读
同样地,分区间对胜率、7天盈利、30天盈利的均值进行分析,结果如下表所示:
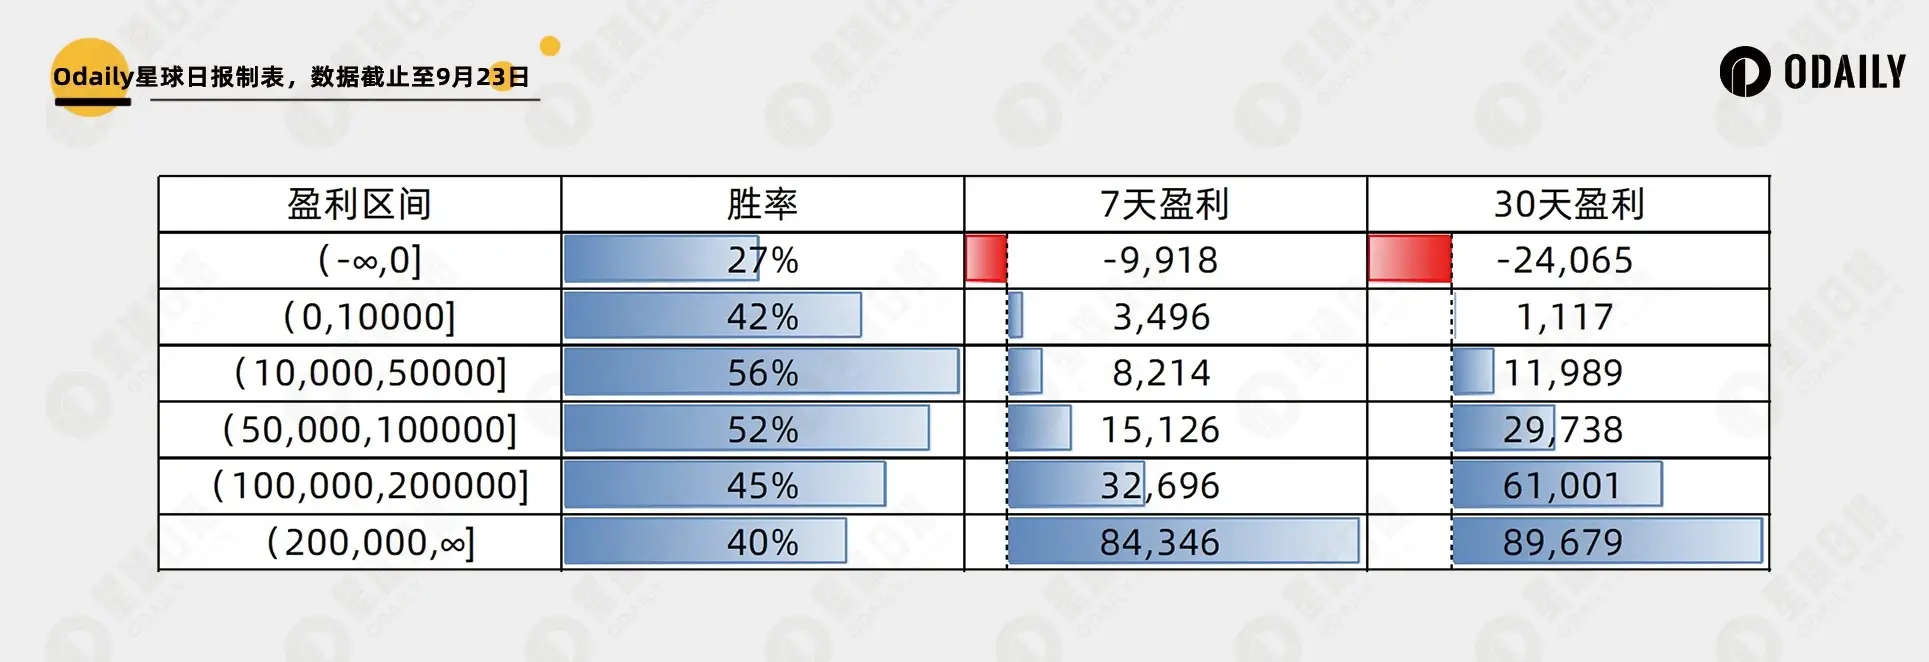
- 可见,与Solana不同,盈利地址的各区间的胜率都不算特别高,结合上两个小节,维持住一定胜率的基础上,应当把重点放在扩大盈亏比上。
(Solana聪明钱分析详见《透视一千个Solana「聪明钱包」:谁在狂赚?从中能学到什么?》)
- 盈利20万美元以上的地址,7天盈利和30天盈利非常接近,主要原因仍是部分地址近几日在Nerio上大幅盈利所导致的。意味着盈利在5万 -20万美元区间的地址,单论持续盈利能力,反而略胜一筹,值得偏好该策略的读者进行关注。
- 负盈利地址存在着胜率低、且亏损可持续的情况,也可作为「反指」进行参考。
免责声明:本文章仅代表作者个人观点,不代表本平台的立场和观点。本文章仅供信息分享,不构成对任何人的任何投资建议。用户与作者之间的任何争议,与本平台无关。如网页中刊载的文章或图片涉及侵权,请提供相关的权利证明和身份证明发送邮件到support@aicoin.com,本平台相关工作人员将会进行核查。


