Ethereum’s 1-hour chart reflects a range-bound market, with prices fluctuating between $2,240 and $2,340. Support is firmly held at $2,240, while resistance looms at $2,338. Recent volume spikes indicate a lack of follow-through buying pressure after the drop to $2,240, signaling indecision among traders. As the market remains in consolidation, ethereum’s next move will likely hinge on a breakout from this range.

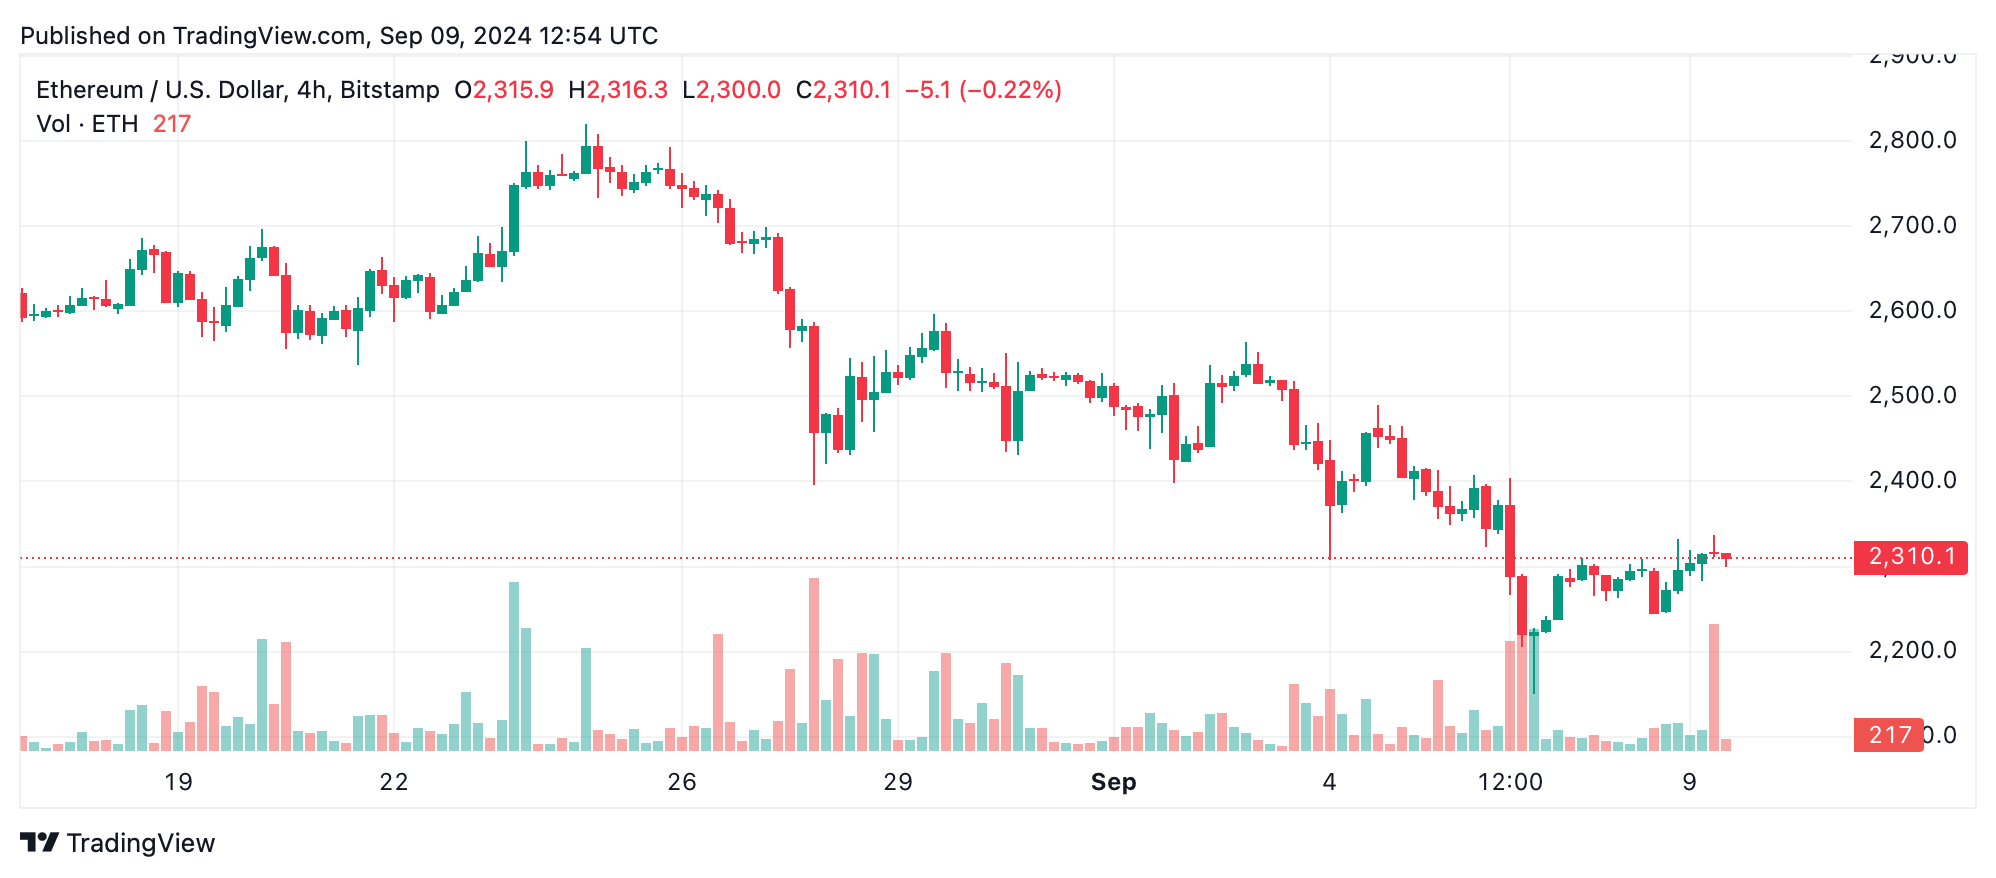
On the 4-hour chart, ethereum shows a mild recovery after hitting a low of $2,149. Minor support has formed at $2,240, while resistance remains at $2,338 and $2,450. The drop from $2,500 to $2,200 saw a significant sell-off, but post-selloff volume has decreased, indicating weak bullish momentum. Traders may consider waiting for a decisive move above $2,350 or preparing for a further decline if the price breaks below $2,300.

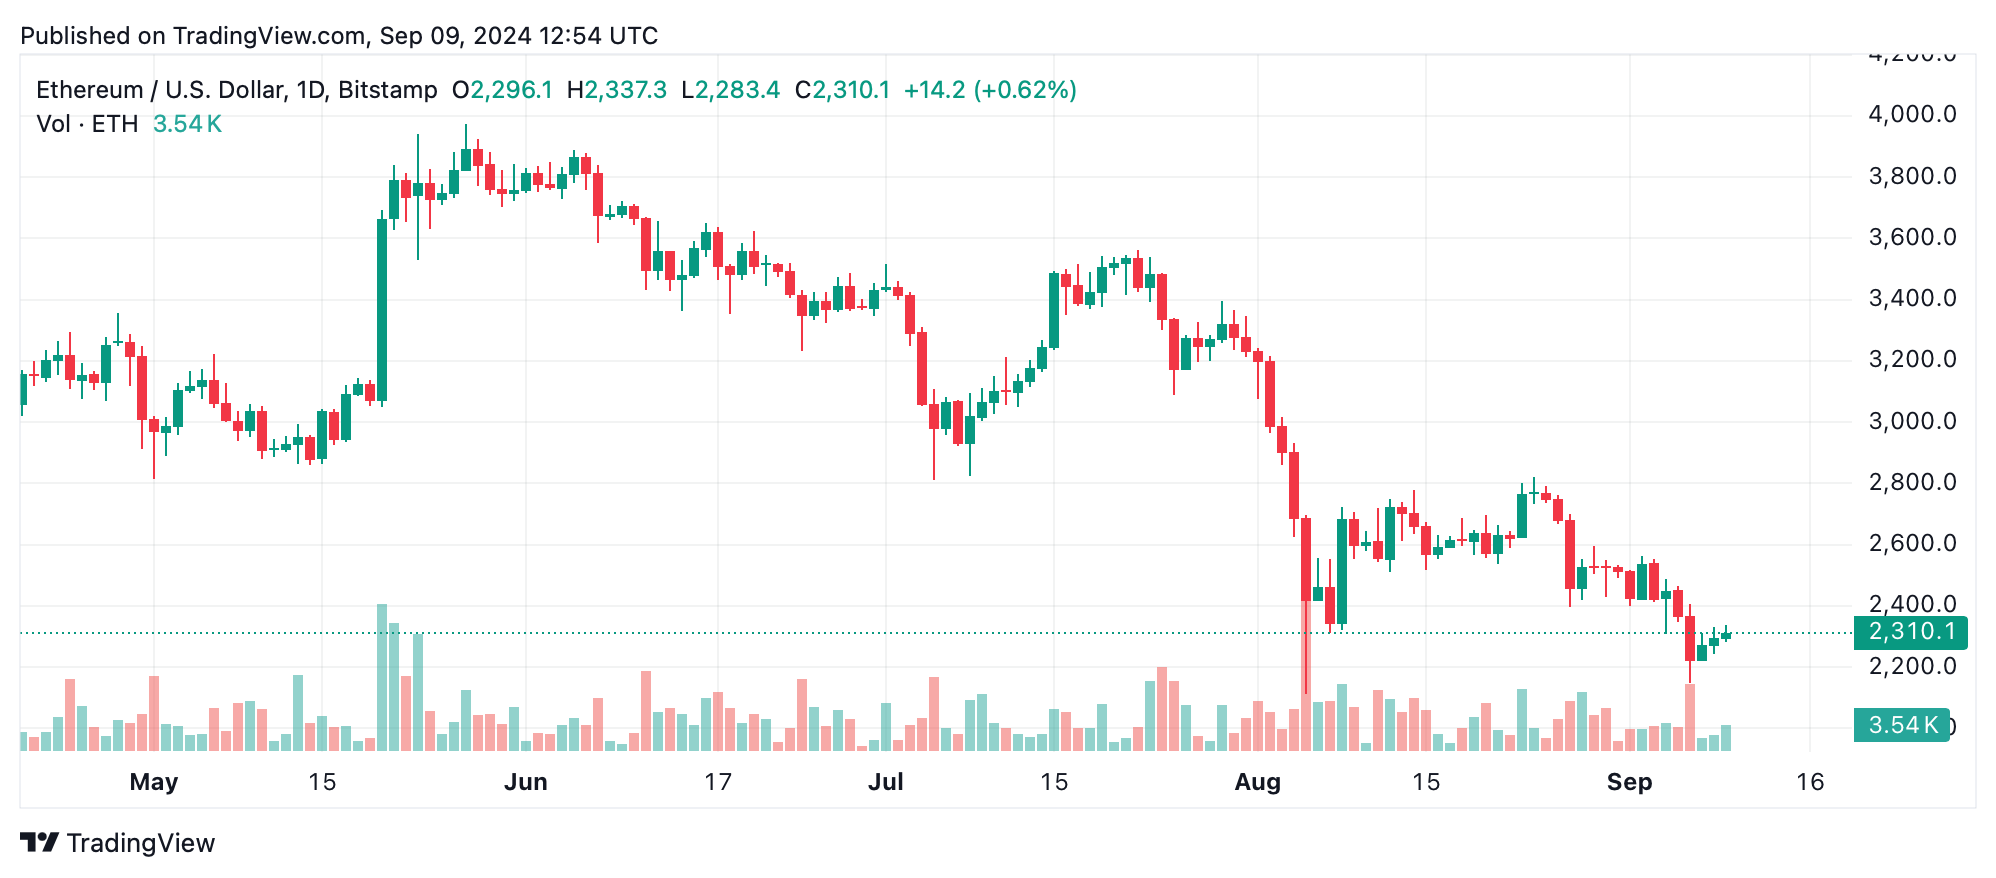
Daily chart analysis paints a clearer picture of ethereum’s prolonged downtrend. The market has seen consistent lower highs and lower lows, with support found around $2,149 and resistance near $2,823. The significant volume during the recent sell-off highlights potential capitulation, but the lack of a strong reversal pattern suggests the market is still vulnerable. A cautious entry near $2,200-$2,300 may be viable, but risk management is crucial.
The oscillators provide mixed signals for ethereum. The relative strength index (RSI) at 37 is neutral, while the commodity channel index (CCI) and momentum suggest a buy signal, indicating potential upward pressure. However, the moving average convergence divergence (MACD) at -121.2 signals continued bearish momentum, while the majority of moving averages (MAs)—both exponential and simple—remain in sell territory, reinforcing the overall downtrend.
Bull Verdict:
Ethereum shows potential for recovery if it can break above the $2,350 resistance level. Oscillators such as the CCI and momentum indicate buying pressure, suggesting that a bounce from the $2,200-$2,300 support zone could lead to short-term gains. A breakout above key resistance levels could attract more buyers, potentially reversing the current downtrend.
Bear Verdict:
The dominance of bearish signals across moving averages and the MACD suggests that ethereum may continue its downward trajectory. Failure to hold above the $2,300 support level could lead to further declines, with $2,149 as the next key level to watch. The lack of strong buying pressure and weak volume recovery indicate that downside risk remains significant in the near term.
Register your email here to get weekly price analysis updates sent to your inbox:
免责声明:本文章仅代表作者个人观点,不代表本平台的立场和观点。本文章仅供信息分享,不构成对任何人的任何投资建议。用户与作者之间的任何争议,与本平台无关。如网页中刊载的文章或图片涉及侵权,请提供相关的权利证明和身份证明发送邮件到support@aicoin.com,本平台相关工作人员将会进行核查。


