Bitcoin Technical Analysis: Path to $58K Blocked by Heavy Resistance at $56,000

CN
7天前

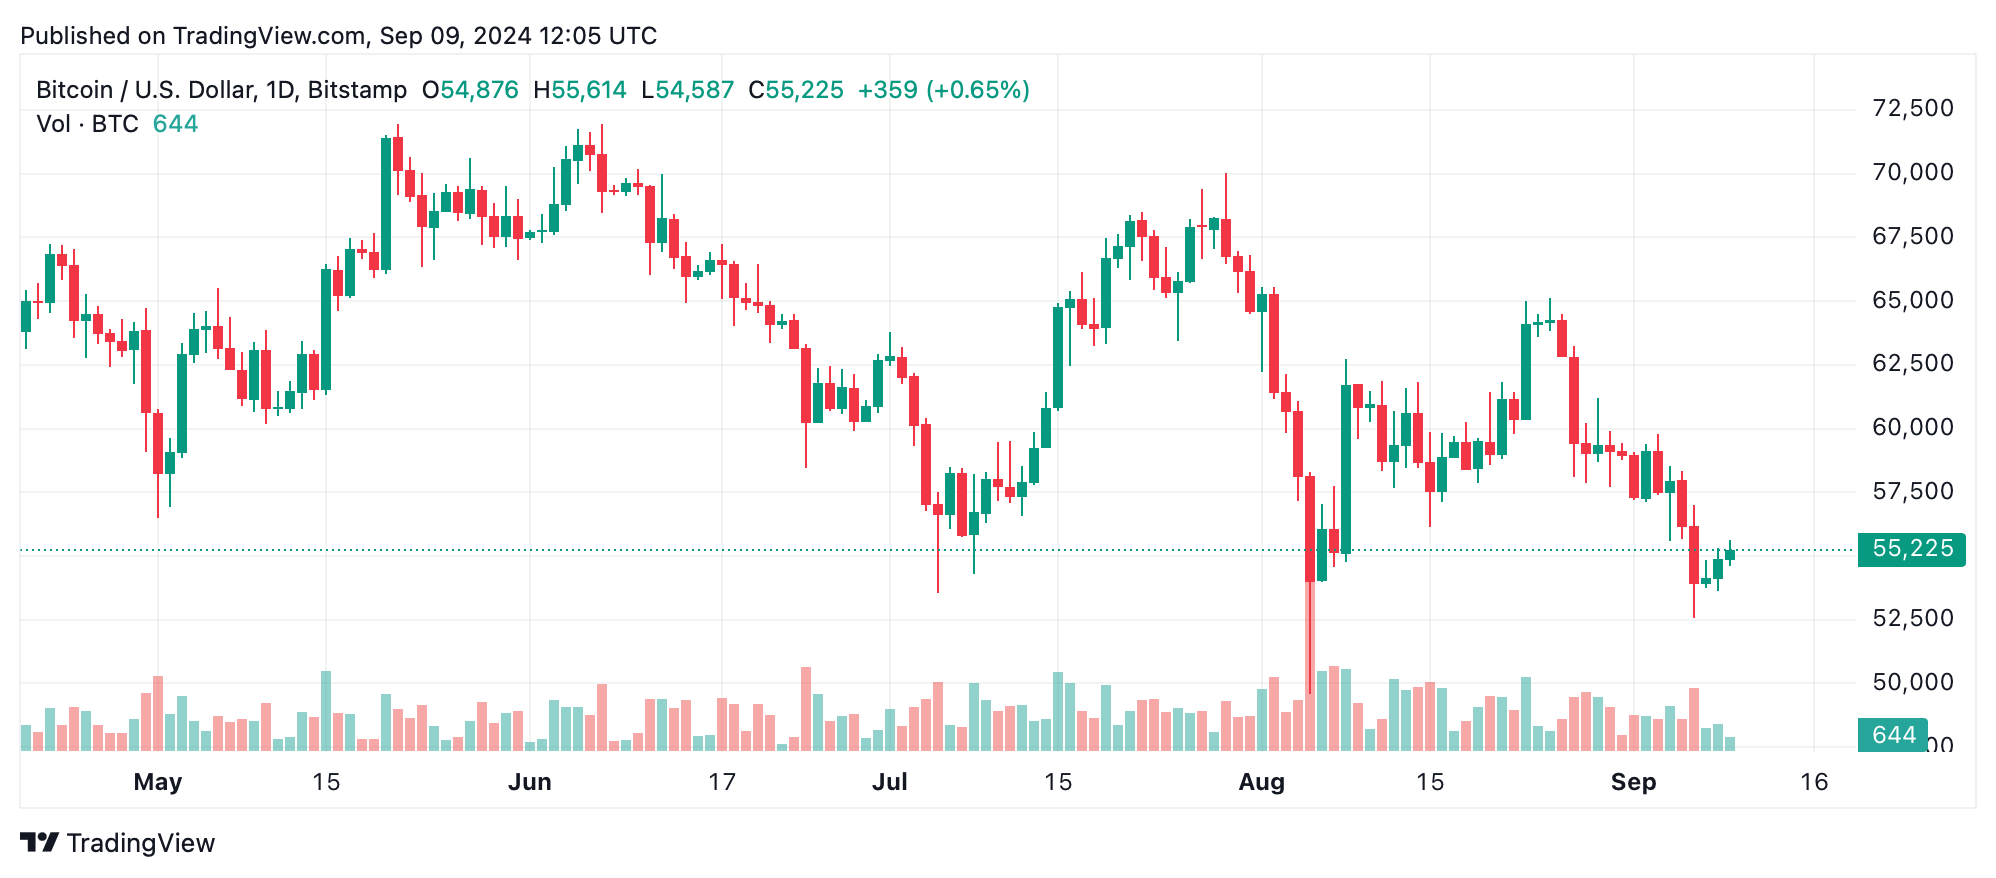
Bitcoin’s price saw a short-term recovery, rising from a low of $53,636 on September 8 to $55,614. The 1-hour chart shows a bullish movement as several upticks dominated after a dip, supported by rising buying pressure. Volume spiked during the price increases, signaling support for the upward trend.

Bitcoin Technical Analysis: Path to $58K Blocked by Heavy Resistance at $56,000

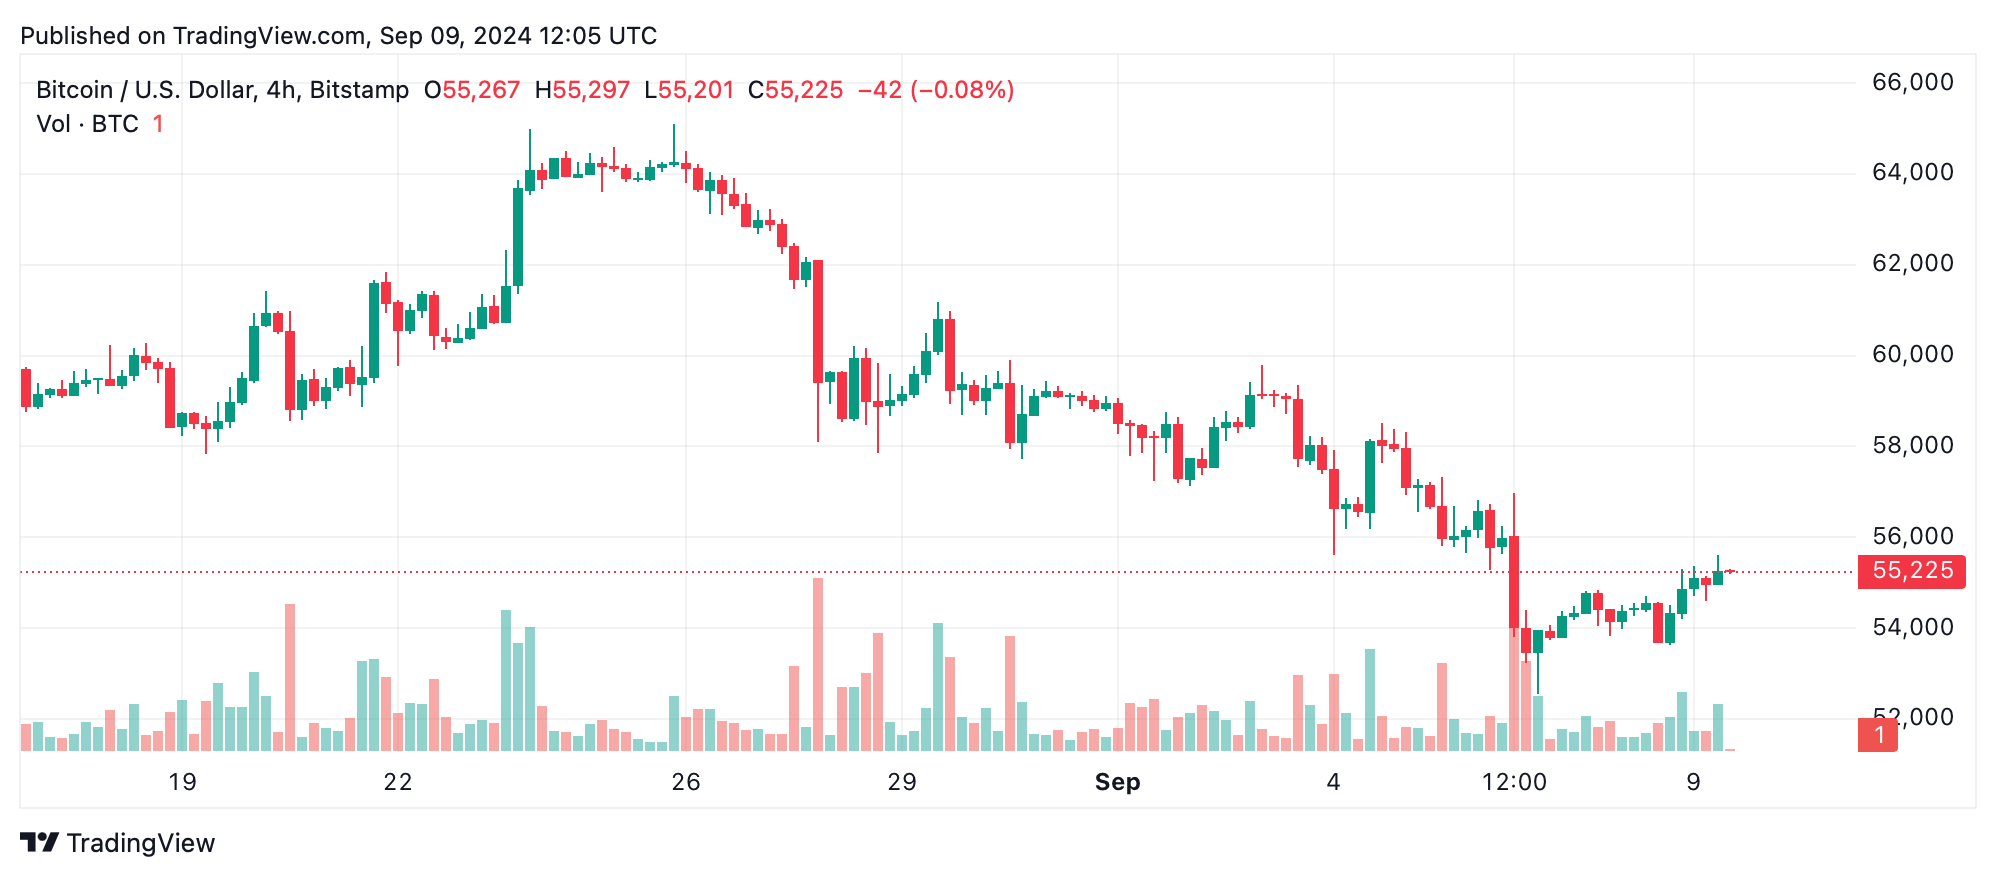
On the 4-hour chart, bitcoin bounced back after hitting a low of $52,546 following a sharp sell-off. The price is trending toward $55,000, but resistance looms at $56,000. Previous attempts to break this level have failed, indicated by wicks touching this mark without sustaining higher. Although buyers are slowly gaining control, volume remains lower than the sell-off, suggesting caution.

Bitcoin Technical Analysis: Path to $58K Blocked by Heavy Resistance at $56,000

Bitcoin remains in a broader downtrend since its peak near $65,103, with the recent dip to $52,546 potentially marking a bottom. While BTC has rebounded, the resistance between $56,000 and $58,000 remains significant. Volume analysis shows weaker buying pressure during the recovery compared to the strong selling from the $58,000 region, hinting at cautious market sentiment. Traders should watch whether bulls can drive the price past these resistance levels.

Technical indicators offer a mixed outlook for leading crypto asset. The relative strength index (RSI) sits at 40, signaling neutrality, while the commodity channel index (CCI) and momentum indicators point to bullish signals. On the contrary, the moving average convergence divergence (MACD) level and several moving averages (MAs) across multiple time frames suggest sell conditions. This divergence indicates that significant resistance is still in play while some momentum is building.

Bull Verdict:

Bitcoin shows signs of resilience with buyers stepping in after recent dips, and a recovery from the $52,546 level suggests underlying support. While resistance at $56,000 remains a hurdle, a breakout above this level could trigger a stronger upward momentum, potentially testing the $58,000 mark. The upward movement on shorter time frames and certain buy signals from oscillators support a cautiously bullish outlook.

Bear Verdict:

Despite the recent bounce, bitcoin faces significant resistance between $56,000 and $58,000, with sell signals from moving averages and weak recovery volume suggesting the rally may lack strength. The broader downtrend remains intact, and failure to break above $56,000 could see bitcoin retesting support levels near $52,500. The cautious market sentiment and bearish moving average trends support a bearish outlook in the near term.

Register your email here to get weekly price analysis updates sent to your inbox:

免责声明:本文章仅代表作者个人观点,不代表本平台的立场和观点。本文章仅供信息分享,不构成对任何人的任何投资建议。用户与作者之间的任何争议,与本平台无关。如网页中刊载的文章或图片涉及侵权,请提供相关的权利证明和身份证明发送邮件到support@aicoin.com,本平台相关工作人员将会进行核查。

分享