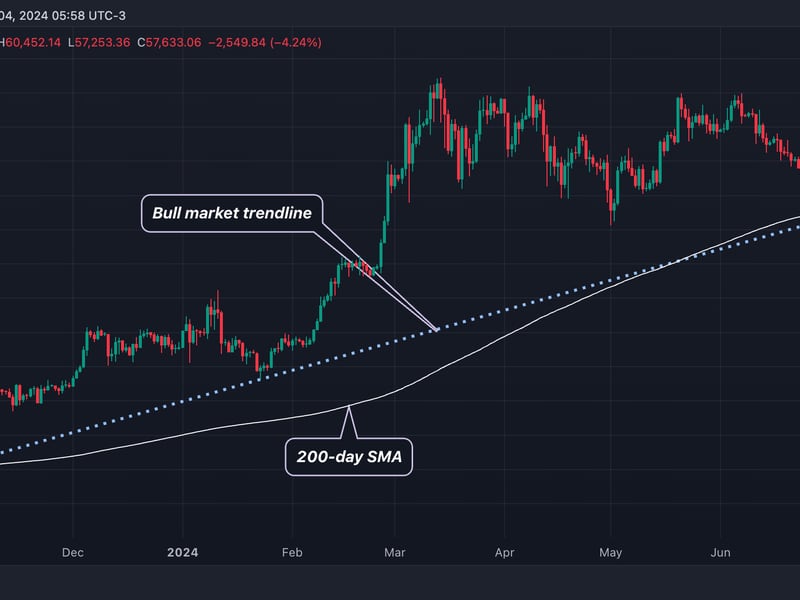
Bitcoin's (BTC) decline gathered pace Thursday, sending prices under the 200-day simple moving average (SMA), a good indicator of long-term trends in both traditional and crypto markets.
The cryptocurrency fell below the 200-day SMA at $58,492 during European hours, putting lows under $57,300, a level last seen on May 2, according to charting platform TradingView.
Markets that consistently trade below the 200-day SMA are said to be in a downtrend, while those trading above the average are bullish. BTC rose past the 200-day SMA in October, when the average value was $28,000. The breakout – fueled by expectations for a spot bitcoin ETF in the U.S. – paved the way for a sharp rally to record highs above $70,000 by March.
That bull market can be identified by a rising trendline connecting October and January lows. BTC's latest break below the 200-day line has put the focus on the bull market trendline support at $57,590.
A close (midnight UTC) below that level could lead to further selling and downward price momentum, as traders often use trendline breakdowns as indicators to make trading decisions.
免责声明:本文章仅代表作者个人观点,不代表本平台的立场和观点。本文章仅供信息分享,不构成对任何人的任何投资建议。用户与作者之间的任何争议,与本平台无关。如网页中刊载的文章或图片涉及侵权,请提供相关的权利证明和身份证明发送邮件到support@aicoin.com,本平台相关工作人员将会进行核查。


