Yesterday, around 6 o'clock in the afternoon, BTC fell below 61,000 points, hitting a low of 60,630, and the market sentiment was quite panicked. In the evening, around 8 o'clock, the price of BTC was near 61,150. This account clearly indicated in the community that the 30-minute downward trend of BTC had completed a segment structure and was about to rebound. The first target was 63,000, and the current target of 63,000 has been achieved.
Why did BTC experience a short-term reversal after falling below 61,000 points? And why dare to make a judgment for a rebound at the moment? All of this has nothing to do with news, market sentiment, or data. It is a precise prediction made in advance through the internal structure of the BTC trend. The more complete the structure, the higher the accuracy!
Let's review the ETH strategy chart and live chart given on Tuesday:
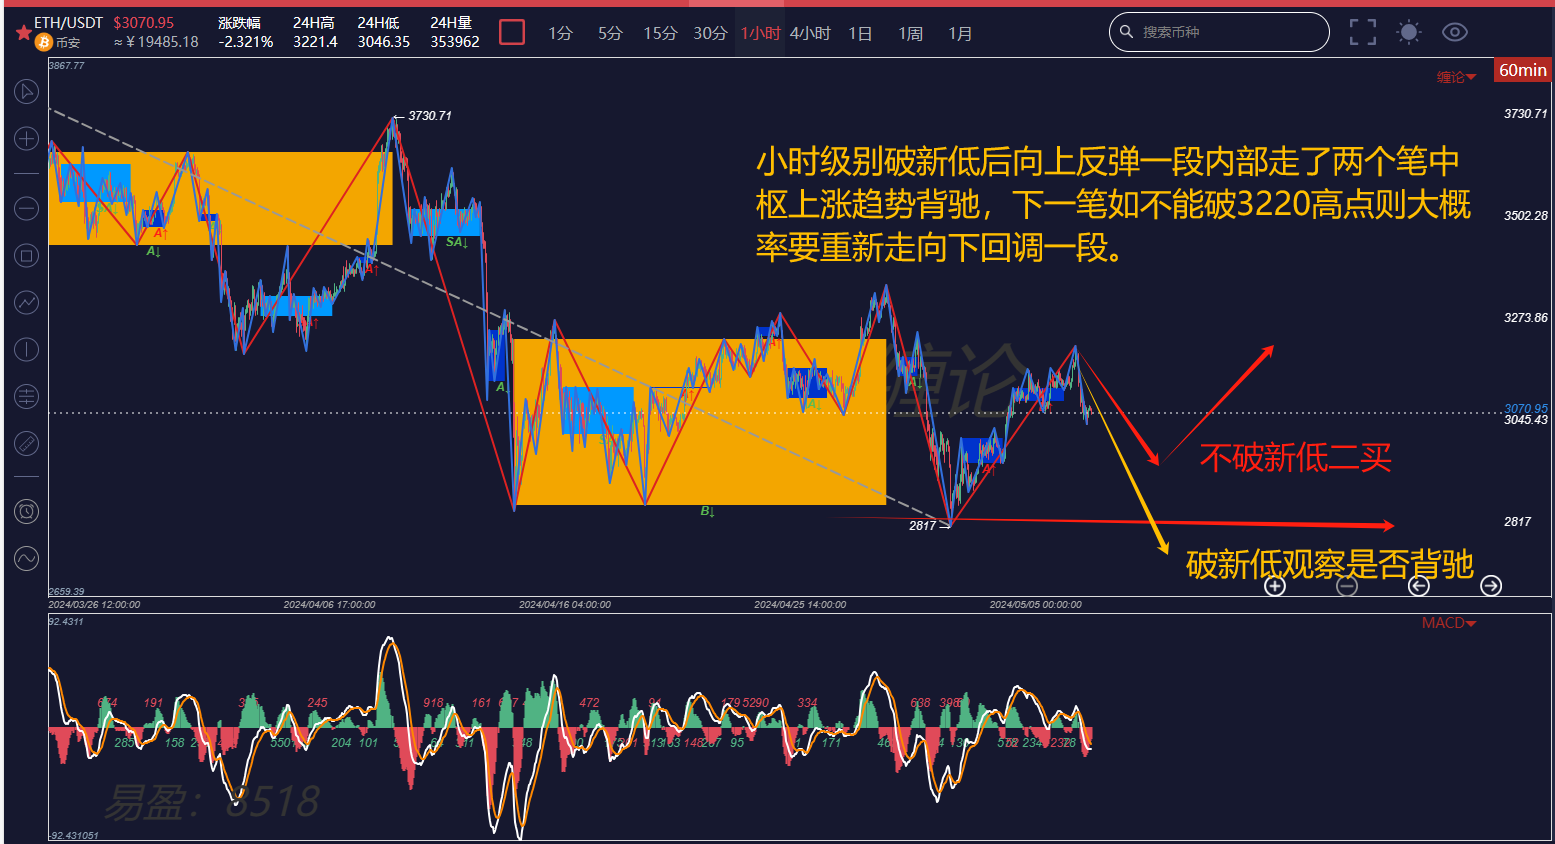
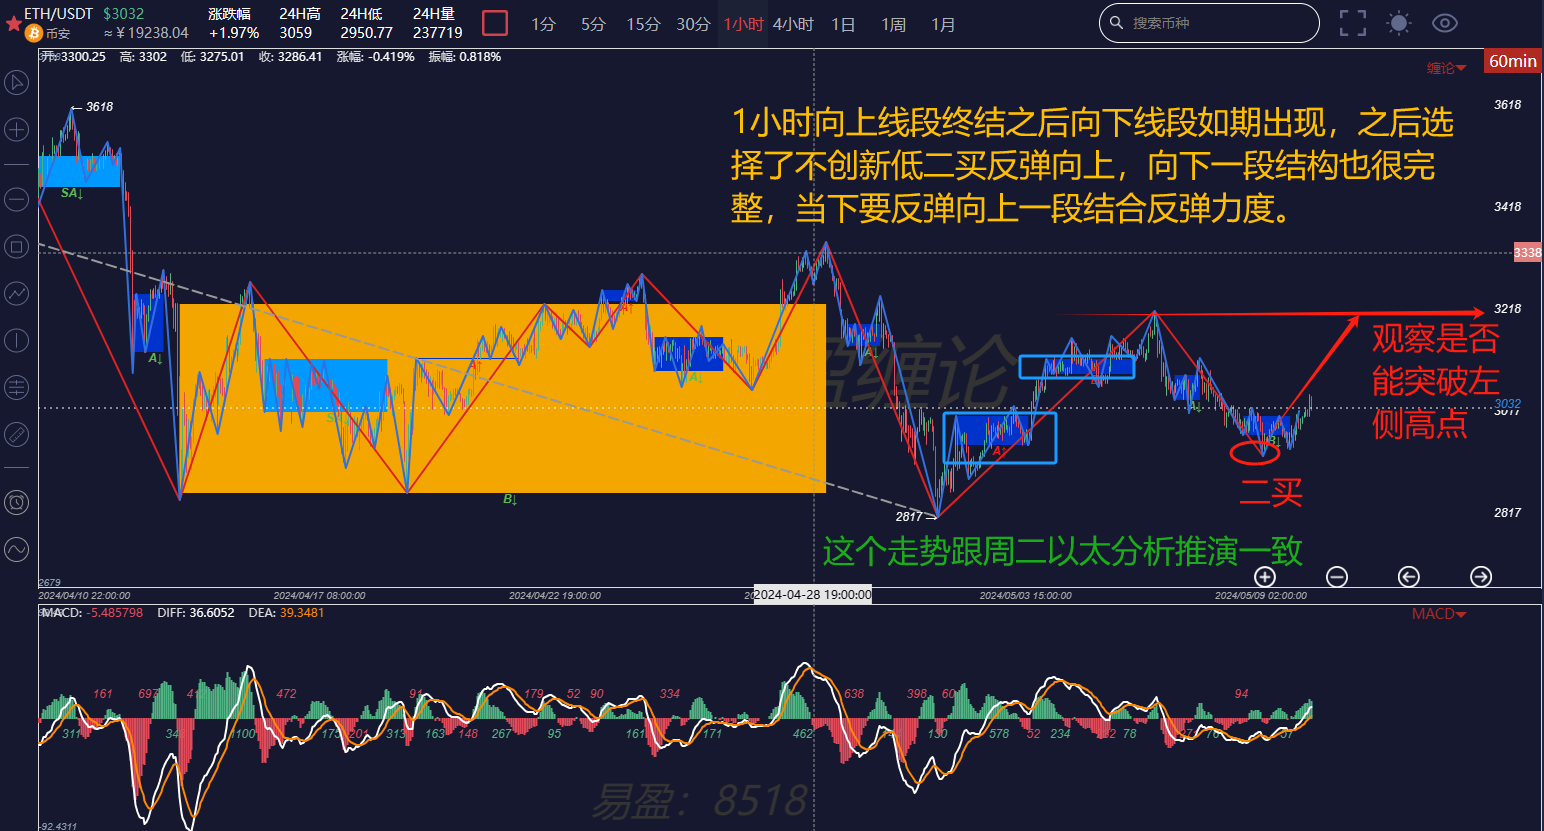
After comparing the two charts three days apart, it feels very magical! The current actual trend is basically consistent with the yellow trend analyzed on Tuesday. From this, two basic conclusions can be drawn: 1. When a complete structure appears, it is a signal that the market is about to turn around. The more complete the structure, the higher the accuracy. 2. The complete classification in the coil theory can guide us in advance to judge the trend and make trading plans and follow them based on trend classification. This is often referred to as "predicting without guessing"!
Back to the current BTC market:
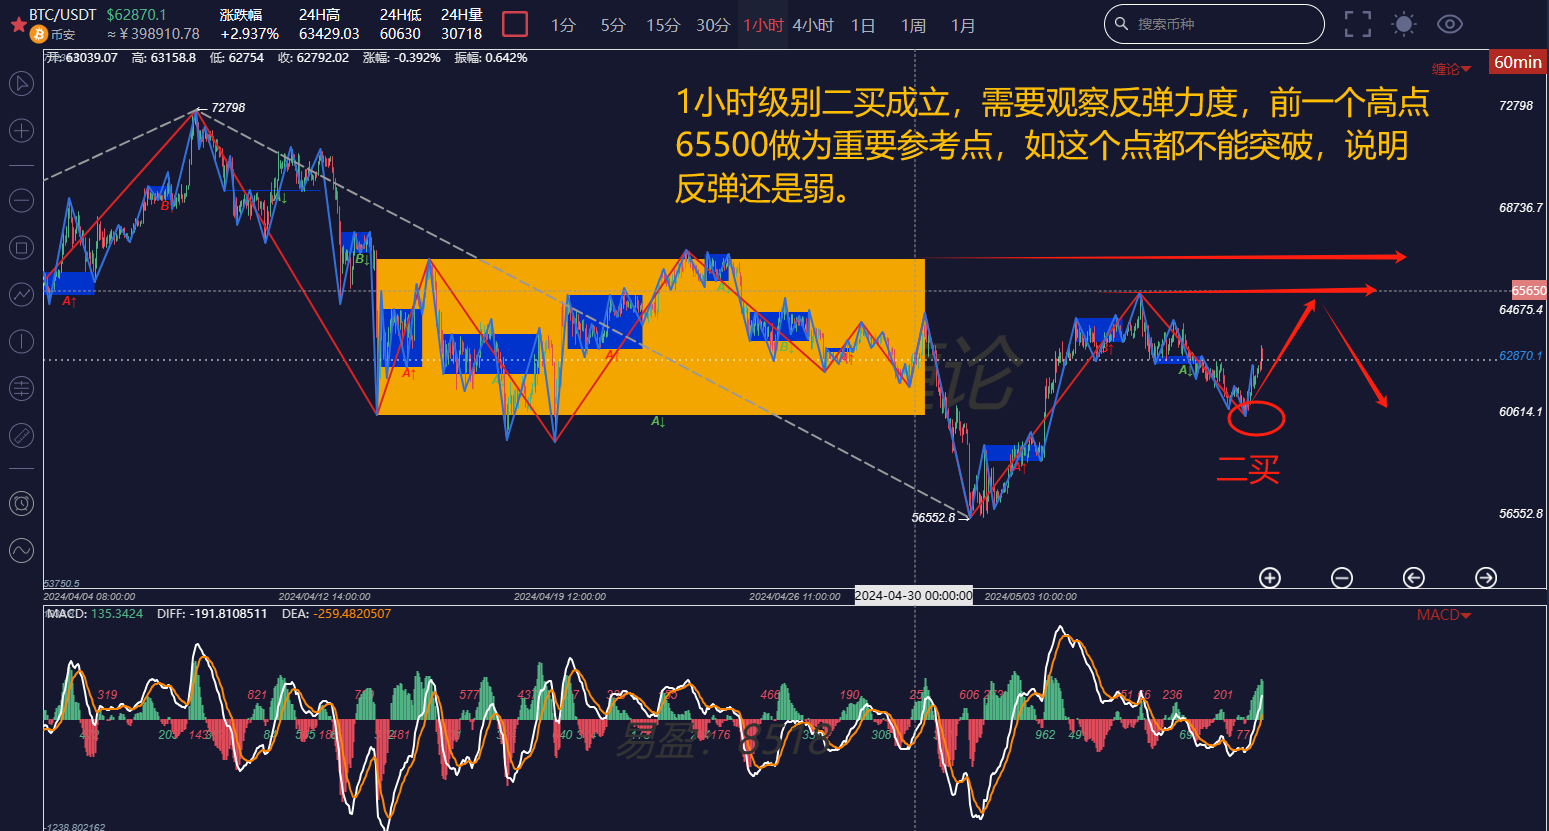
First, look at the hourly chart. The structure of this BTC trend is very similar to the structure of the ETH trend, and similar structures can be found in each different level. This leads to another point in the coil theory: self-similarity and self-conformity. This is the basis for us to make judgments on trends.
The current BTC is running a 1-hour second buy. It can be understood that before the appearance of the three types of buying and selling points on the left side, the coil oscillates around this center. The current trend is upward, and the 1-hour upward trend has not yet been completed. In this upward trend, two reference points should be closely watched: one is the previous high point of 65,500, and the other is the upper edge of the center. If it cannot break through the high point of 65,500, it means that the bullish momentum is not enough, and it will continue to seek a bottom.
How to maintain a high winning rate and profit-loss ratio? The best method is to wait for a complete coil structure that you can understand and then go all in. If you don't understand or can't grasp it, you should learn to give up. For contract traders, staying out of the market in most cases is also a very good strategy!
If you are interested in the coil theory and want to get free learning materials, watch public live broadcasts, participate in offline coil theory training camps, improve your trading skills, build your own trading system to achieve a stable profit target, and use coil theory to timely exit at the top and buy at the bottom, you can scan the code to follow the public account, private message to obtain and add the WeChat of this account to join the group for learning!

免责声明:本文章仅代表作者个人观点,不代表本平台的立场和观点。本文章仅供信息分享,不构成对任何人的任何投资建议。用户与作者之间的任何争议,与本平台无关。如网页中刊载的文章或图片涉及侵权,请提供相关的权利证明和身份证明发送邮件到support@aicoin.com,本平台相关工作人员将会进行核查。


