2024.05.08 Wednesday

After continuous decline, has the bearish trend formed?

① 22:00 US Wholesale Sales MoM for March
② 23:00 Speech by US Federal Reserve Vice Chairman Jefferson on the economy
③ 01:00 the next day US 10-year Treasury Auction - Bid-to-cover Ratio

- Daily chart: After breaking below the 60,000 support level, the price returned above it. If the subsequent pullback does not break this level, there is still a potential for further upward movement.

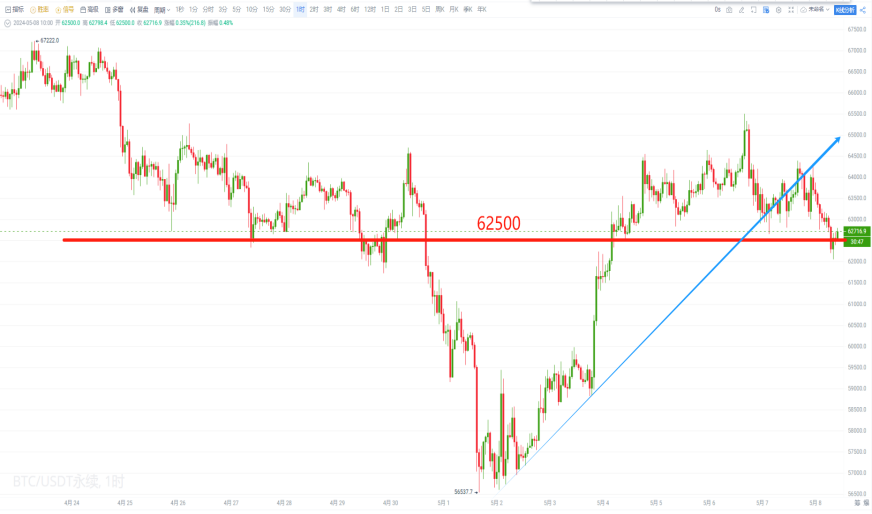
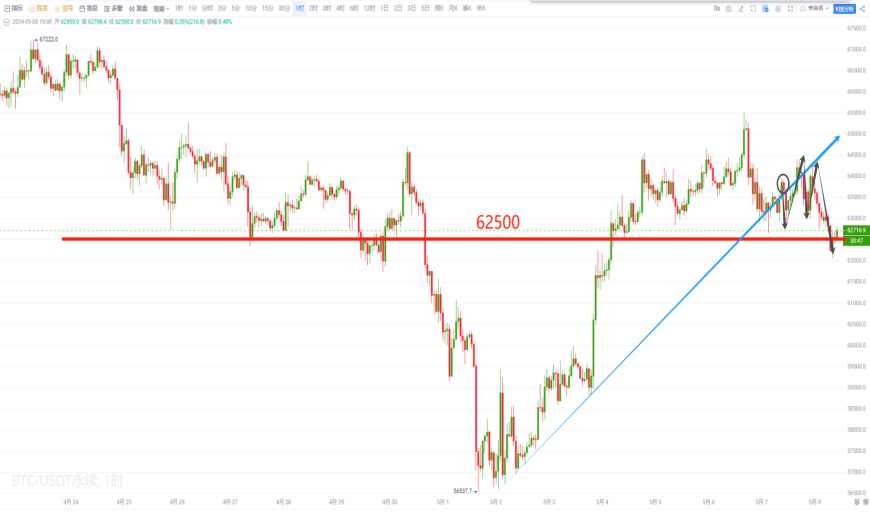
- 1-hour chart: After a short-term dip below the 62,500 support level, the price has been oscillating nearby. If it effectively breaks below this level, the downward space may expand.
II. Ethereum
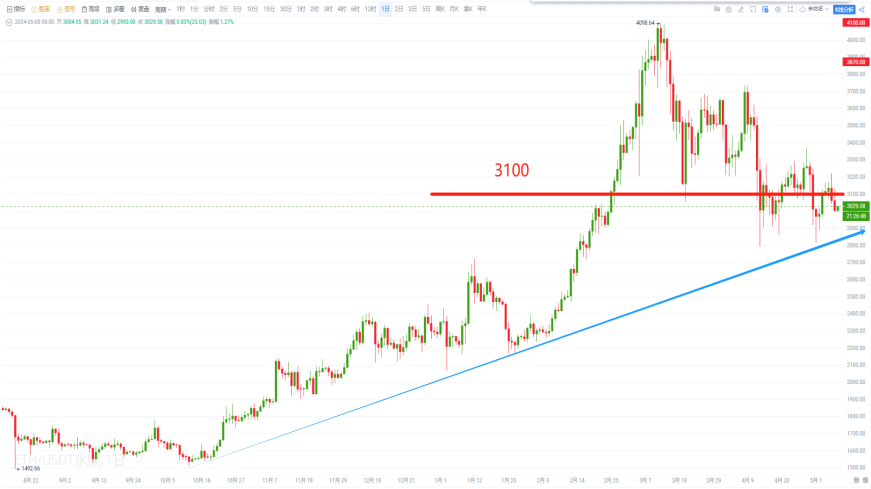
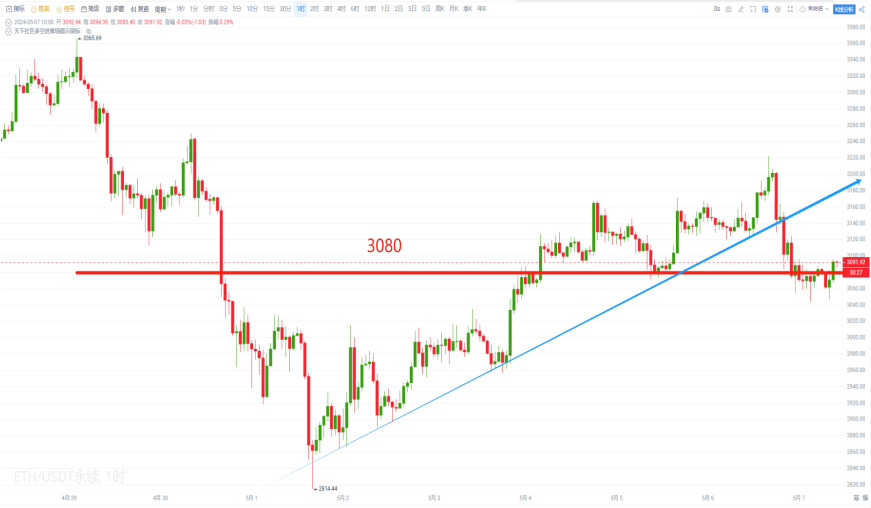
- Daily chart: After testing the 3,100 support level, the price has been oscillating. If the subsequent oscillation does not break this support, the upward trend may continue.
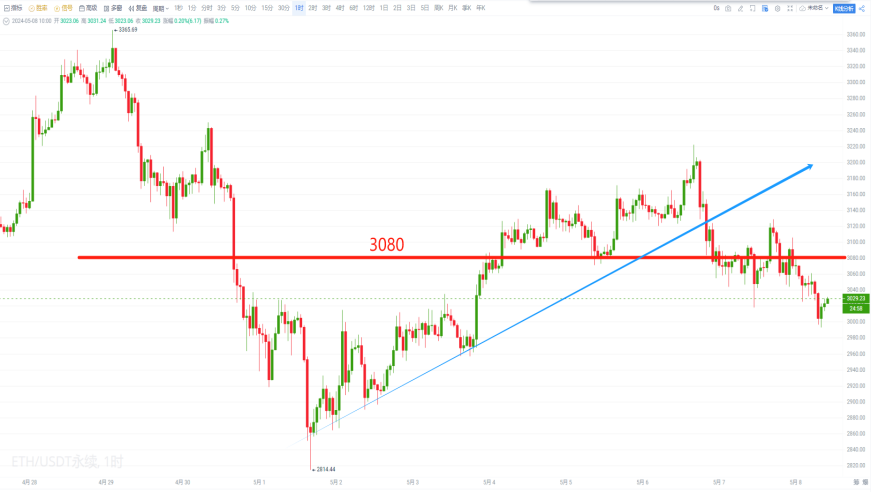
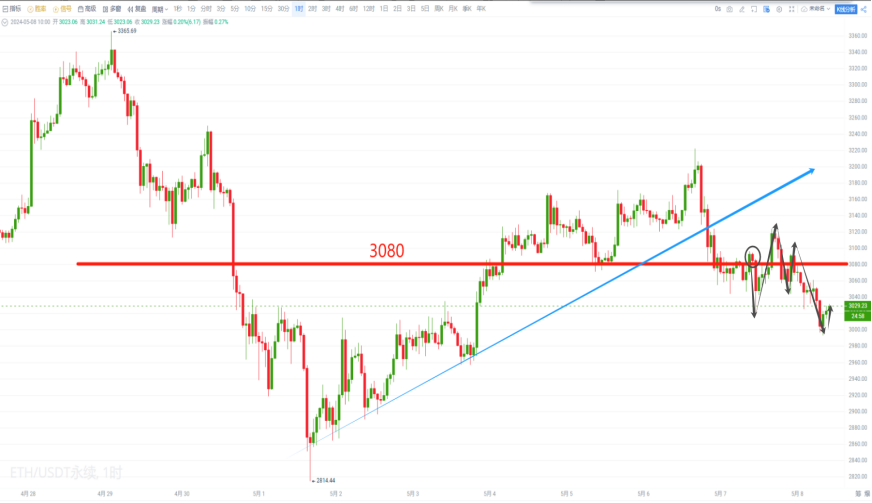
- 1-hour chart: After breaking below the 3,080 support level in the short term, the price continued to decline. If the rebound does not break this level, there is still a potential for further decline.

I. Bitcoin
- Yesterday's view:
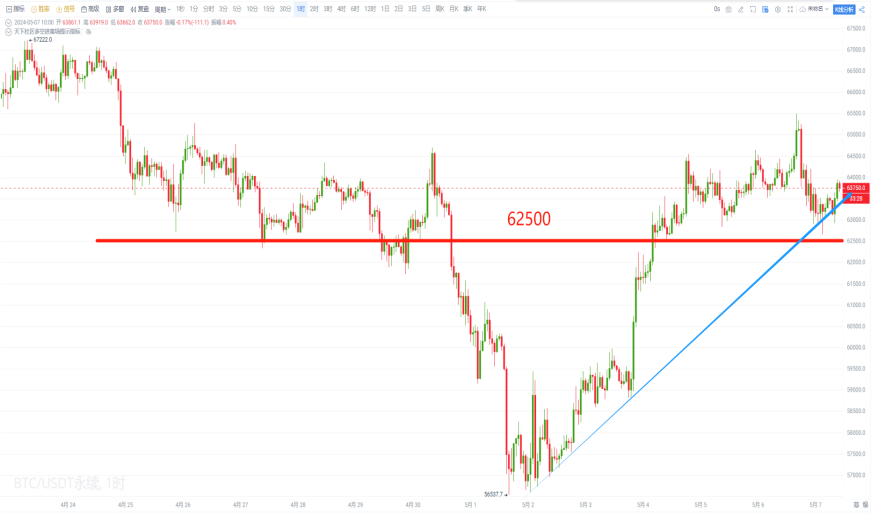
Summary: After a short-term break above the 62,500 level, the price has been oscillating. If the subsequent pullback does not break this support, there is still potential for further upward movement. Resistance above is at 65,700 and 68,500; if it breaks below, it may enter a pullback trend again, with support at 61,000 and 58,800.
- Subsequent trend:
The subsequent trend maintained oscillation after the pullback did not break the 62,500 level, reaching a high of 64,392.
II. Ethereum
- Yesterday's view:
Summary: After a short-term break above the 3,080 level, there was a pullback. If the subsequent test does not break this support, there is still potential for further upward movement. Resistance above is at 3,220 and 3,370; if it breaks below, it may enter a pullback trend again, with support at 2,960 and 2,830.
- Subsequent trend:
The subsequent trend continued to decline after breaking below the 3,080 level, reaching a low of 2,993.

I. Bitcoin
Summary: After a short-term dip below the 62,500 level, the price has been oscillating nearby. If the subsequent trend effectively breaks below this level, the downward space may expand, with support at 60,000 and 57,200; if it stabilizes above this level, there may be a rebound trend again, with resistance at 65,000 and 67,100.
II. Ethereum
Summary: After a short-term break below the 3,080 level, the price continued to decline. If the rebound does not break this level, there is still potential for further decline, with support at 2,900 and 2,790; if it breaks above, there may be a rebound trend again, with resistance at 3,210 and 3,340.


Join the AICoin community to enjoy the following services:
- Morning video explanations updated daily;
- Daily updated textual analysis;
- Technical indicator analysis and answers in the group;
- Long and short-term strategy layout;
- High winning rate short-term trading strategies;
- Trading system long and short signals reference software authorization;
- Enjoy lower transaction fees by joining the community for practical combat;
- One-on-one or one-on-many guidance and answers (by appointment);
- Multiple learning courseware packages to bid farewell to incomprehension;
- Multiple analysts (lecturers, practical teachers) to guide you through the cryptocurrency world, with seven live courses daily.


免责声明:本文章仅代表作者个人观点,不代表本平台的立场和观点。本文章仅供信息分享,不构成对任何人的任何投资建议。用户与作者之间的任何争议,与本平台无关。如网页中刊载的文章或图片涉及侵权,请提供相关的权利证明和身份证明发送邮件到support@aicoin.com,本平台相关工作人员将会进行核查。


