Original Title: A Social and Financial Study of Memecoins
Original Author: Andrew Hong
Original Translation: Ladyfinger, Blockbeats
Editor's Note:
This article delves into the behavior and impact of meme coins in the current market, revealing the diverse performance and investment potential of these cryptocurrencies through a detailed analysis framework. The data and charts in the article are sourced from a dataset specifically compiled for Farcaster meme coins, providing a comprehensive perspective to help readers understand the community and financial performance of meme coins. By combining community data with financial data, the author attempts to provide a more scientific evaluation and classification of these tokens, thereby providing decision support for investors and analysts.
Introduction
Every market cycle is accompanied by the emergence of meme coins. If you are unfamiliar with the concept, think about the frenzy in 2021 where a group of people on reddit drove up the price of AMC stock. People rally around a meme and push the price of an asset up in the short term (ranging from a day to several months). This has become a popular market strategy in the crypto field from the blockchain layer to the application layer, as what people are driving is not just the price, but also the attention of an ecosystem. Some projects, like Avalanche, have even established an official foundation for meme coins to go further.
The difference between meme coins and any other tokens may not be very clear, but generally, apart from the meme image itself, there is nothing else supporting the token. For example, as a token, DOGE is truly supported only by Shiba Inu images, which is different from ETH protected by the Ethereum blockchain, UNI supported by the complete Uniswap protocol, or MKR supported by a complete collateral stablecoin service.
Farcaster meme coins (such as DEGEN) are the latest trend, with their main advantage being their publicly accessible community. Therefore, I would like to conduct some basic analysis by combining community and financial data.
How to Evaluate a Meme Coin
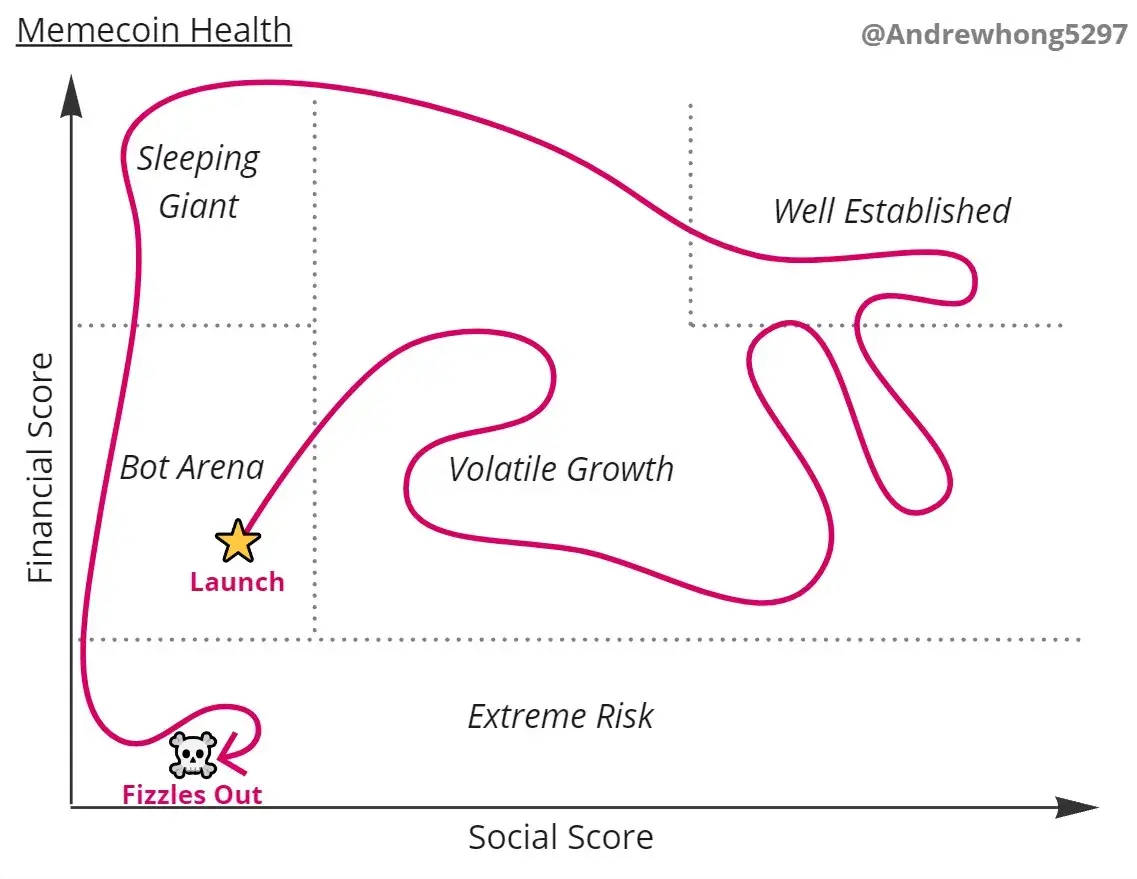
We can use the following chart to categorize all meme coins:

The chart above divides meme coins into five main areas:
· Extreme Risk: Meme coins with low liquidity and trading volume are very risky and are prone to being RUG, as there are too few liquidity providers.
· Bot Arena: Most meme coins will never break out of the war, as there are thousands of coins, and many with the same or similar token names, competing for community and asset attention.
· Volatile Growth: Meme coins that have broken through the initial period need to maintain their momentum and growth. During this period, price fluctuations of 100-500% may be seen, and whether the fluctuations are up or down, many KOLs will start to seize this meme.
· Well Established: Leaders in the meme coin market will occupy a high position in community attention and financial value for a period of time, forming a clear gap with other competitors. This leading status may be manifested as smaller price fluctuations, showing stability, as the number of new investors interested in the meme coin balances with the number of exiting investors, thereby maintaining sustained attention to the meme coin.
· Sleeping Giant: Meme coins with significant growth in both community and funds and have not suffered from "RUG" may temporarily fall silent. It is likely that a DAO has been formed, they start to launch minting or products, and deal with the chaotic situation of the community, while hoping to be noticed again.
Most meme coins should be trapped in the "Bot Arena," some notable meme coins in the "Volatile Growth" section, and perhaps one or two meme coins can become "Well Established." In this process, some may lose community power and become "Sleeping Giant," while others may lose liquidity and become "Extreme Risk."
The roadmap for a successful meme coin should look like this:
You may see many meme coins garnering high media attention due to bot or KOL promotion, but in reality, their liquidity is not strong, which may expose investors to the risk of being "RUG," meaning that if the project suddenly withdraws liquidity, investors will suffer losses.
After extensive data analysis, I created charts related to Farcaster meme coins on Dune:
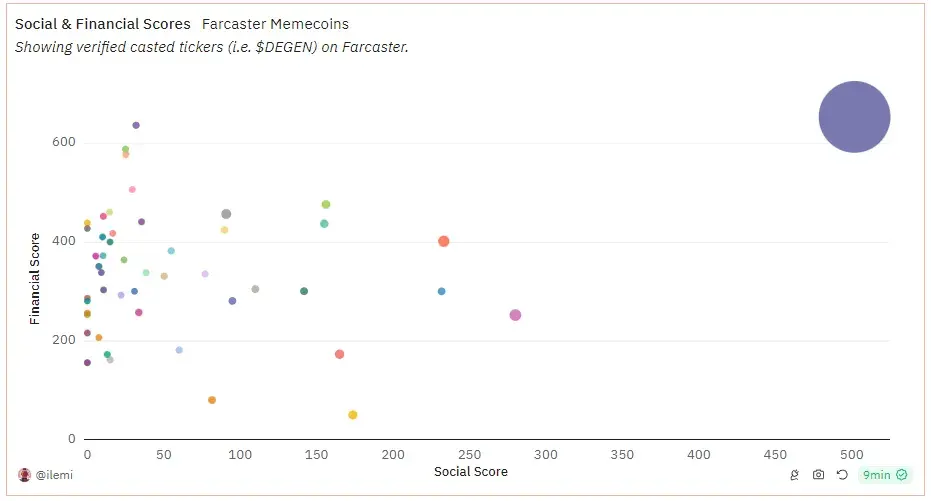
This actually aligns with my expectations. You can see DEGEN at the far end of the upper right corner, followed by others like ENJOY, HIGHER, TN100 X, and EVERY in the middle. Other meme coins are trapped on the left, vying for attention and liquidity.
It is worth noting that I did not filter out Sybil attacks or bots here, so the community scores of some meme coins may be biased. This is an area for improvement in the future.
Now, let's explain how these two scores are generated from this final chart. I will also propose further research questions and provide detailed explanations for those who want to delve deeper.
There are some other charts that I did not list in this article, which can be found here.
Community Score
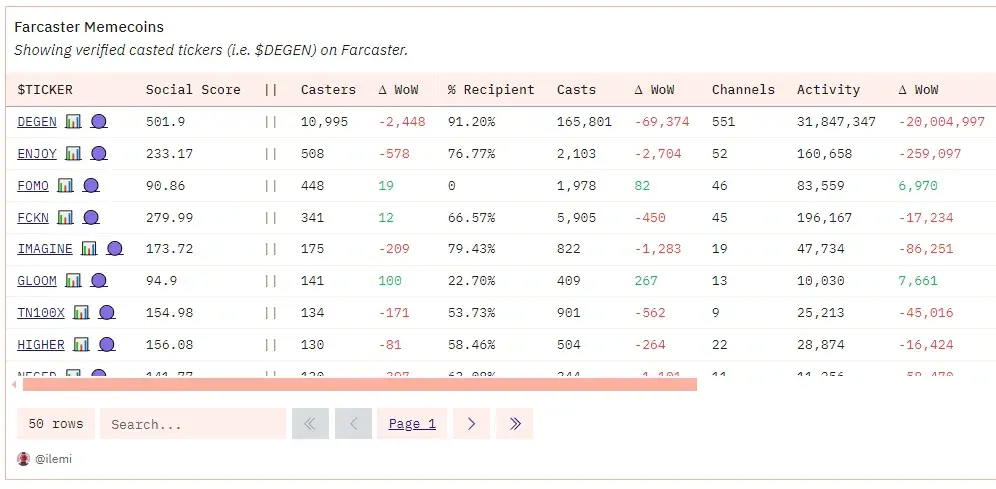
Each score consists of a "base" part and a "growth" part. For the community score, we first measure the delivery and participation associated with the token. Therefore, in this method, "$ DEGEN" would be counted, but "DEGEN" would not. Symbols associated with the token, such as degen hat, higher arrow, tn100 x ham, are also included in the total count.
This provides us with five main indicators:
· Deliverers: The number of people delivering to a specific token.
- Percentage of Receivers: The percentage of receivers who have previously received the token
- Deliveries: The number of deliveries containing the specific token
- Channel Count: The number of channels where deliveries containing the specific token were made
- Activity Level: Engagement (likes + replies) plus the cube root of the number of deliverers multiplied by the cube root of the channel count.
The overall community score is calculated by the "base" activity level and a "growth" multiplier based on the weekly unique deliverers and receivers' deliverer changes. Essentially, if we see more and more people delivering to a token and these people are trying to acquire the tokens, it is definitely a very healthy signal.
Overall, it looks like this in the table:
Financial Score
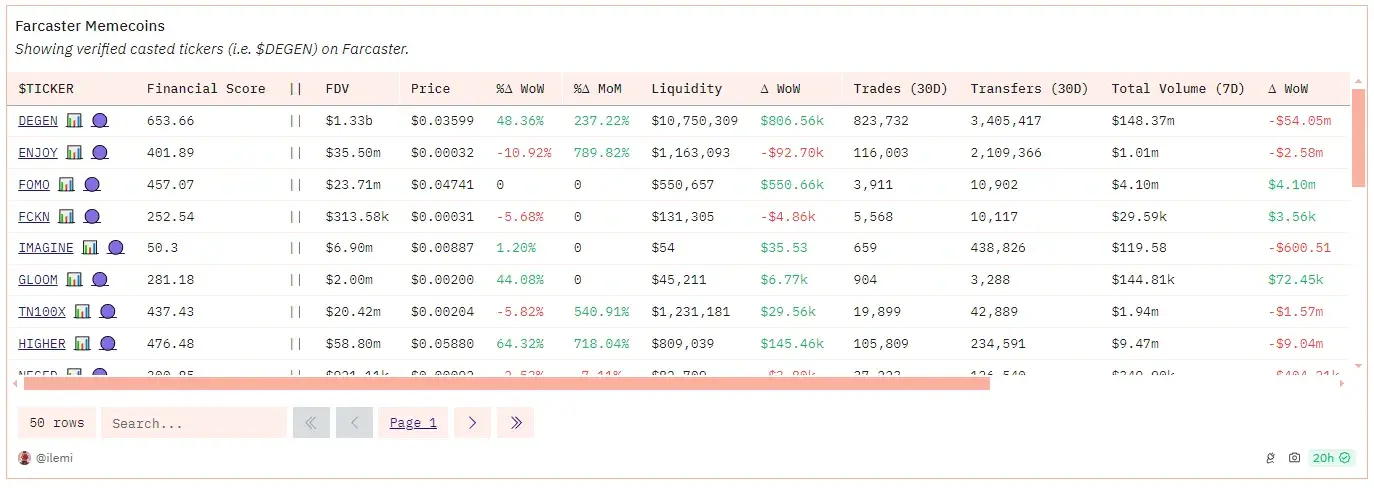
Here are several financial indicators:
- Fully Diluted Value (FDV): Total supply x price
- Price: Latest price based on DEX trades
- Daily, Weekly, Monthly Price Change Percentage: Percentage change in price on a daily, weekly, and monthly basis
- Liquidity: This liquidity refers to non-token liquidity, meaning for a DEGEN - WETH (Ethereum) pool, we only calculate the WETH portion. This provides a more stable signal of how much good liquidity a given token has.
- Trading Volume: DEX trading volume in the past 30 days
- Transfer Count: Number of ERC20 transfers in the past 30 days
- Total Volume: USD trading volume on DEX in the past 7 days
The "base" part of the financial score is determined by its non-token liquidity and DEX trading volume, while the "growth" part is calculated based on the liquidity week-over-week change. Overall, it looks like this in the table:
Follow-up Questions
Here are some questions I hope to delve into further from here:
- How to score "deliverers" for Sybil attacks or bot behavior based on the value of tokens held in wallets?
- Can "deliverers" be graded based on their relationship with known groups or communities?
- How to classify the stages of community and financial growth? What is the correlation between them? Are there time lags or interdependencies?
- Are there the same groups or types of people driving the initial growth stage? What are the characteristics of those who joined a meme earliest, exactly, and latest? How does this relate to user ranks?
- What are the driving factors behind a meme transitioning from one hotspot to another?
- How to evaluate a person's level of interest based on their involvement in the community or financially? Do people change their "delivering" behavior after buying or selling a specific token?
- What is the average lifespan of a meme in terms of community and financial aspects?
Data Query Guidance
Although all the outputs here seem to come from one dataset, the backend data is somewhat complex. You can query related data based on the following guidance:

dune.neynar…… "The dataset is uploaded by Neynar's team, which indexes all Farcaster data. If you are not familiar with the concept of Farcaster data, start with my beginner's guide. In general, if you see "dataset" in the tab name, it means it was uploaded by the team name displayed after the "dune." prefix.
As long as you see "result" in the table name, it is a matview. I created the "erc20 token summary table" to obtain all transaction, price, liquidity, and transfer data for specific tokens. This summary table is further broken down in subqueries, so the final query runtime is only 3 minutes. The total runtime for all queries is about 60-70 minutes.
If the table name you see does not follow the above prefix (nor is it a raw table or decoded table), it is likely from the spellbook. Therefore, tokens.erc20 provides all tokens with symbols or decimals, dex.trades provides all DEX trades on the blockchain, and so on. You can search for the table namespace or table name (such as "dex" or "trades") in the github codebase to find the logic of the table.
Conclusion
As a unique type of cryptocurrency, meme coins' market performance is often strongly influenced by community media and community dynamics. Beyond presenting a framework for evaluating meme coins, through data analysis built on the Dune platform, we can more accurately monitor and predict the performance of these tokens.
Despite certain challenges, such as the potential risks of Sybil attacks or bot manipulation, through continuous monitoring and technical improvements, the analysis of meme coins can become more precise and practical. Future research may further deepen the understanding of these complex factors and bring new insights to the broader field of cryptocurrencies.
免责声明:本文章仅代表作者个人观点,不代表本平台的立场和观点。本文章仅供信息分享,不构成对任何人的任何投资建议。用户与作者之间的任何争议,与本平台无关。如网页中刊载的文章或图片涉及侵权,请提供相关的权利证明和身份证明发送邮件到support@aicoin.com,本平台相关工作人员将会进行核查。


