Trading philosophy: Look at the trend in the long term, and find the position in the short term.
Technical analysis: The lower Bollinger band of the daily chart is near the key levels of 60,000 for Bitcoin and 2,900 for Ethereum. The MACD moving average is running flat and downward, the bearish volume continues to show weak expansion, and the KDJ line is running downward. The 4-hour chart shows the Bollinger band starting to widen, the MACD moving average running downward, the bearish volume starting to expand, and the KDJ line running downward.
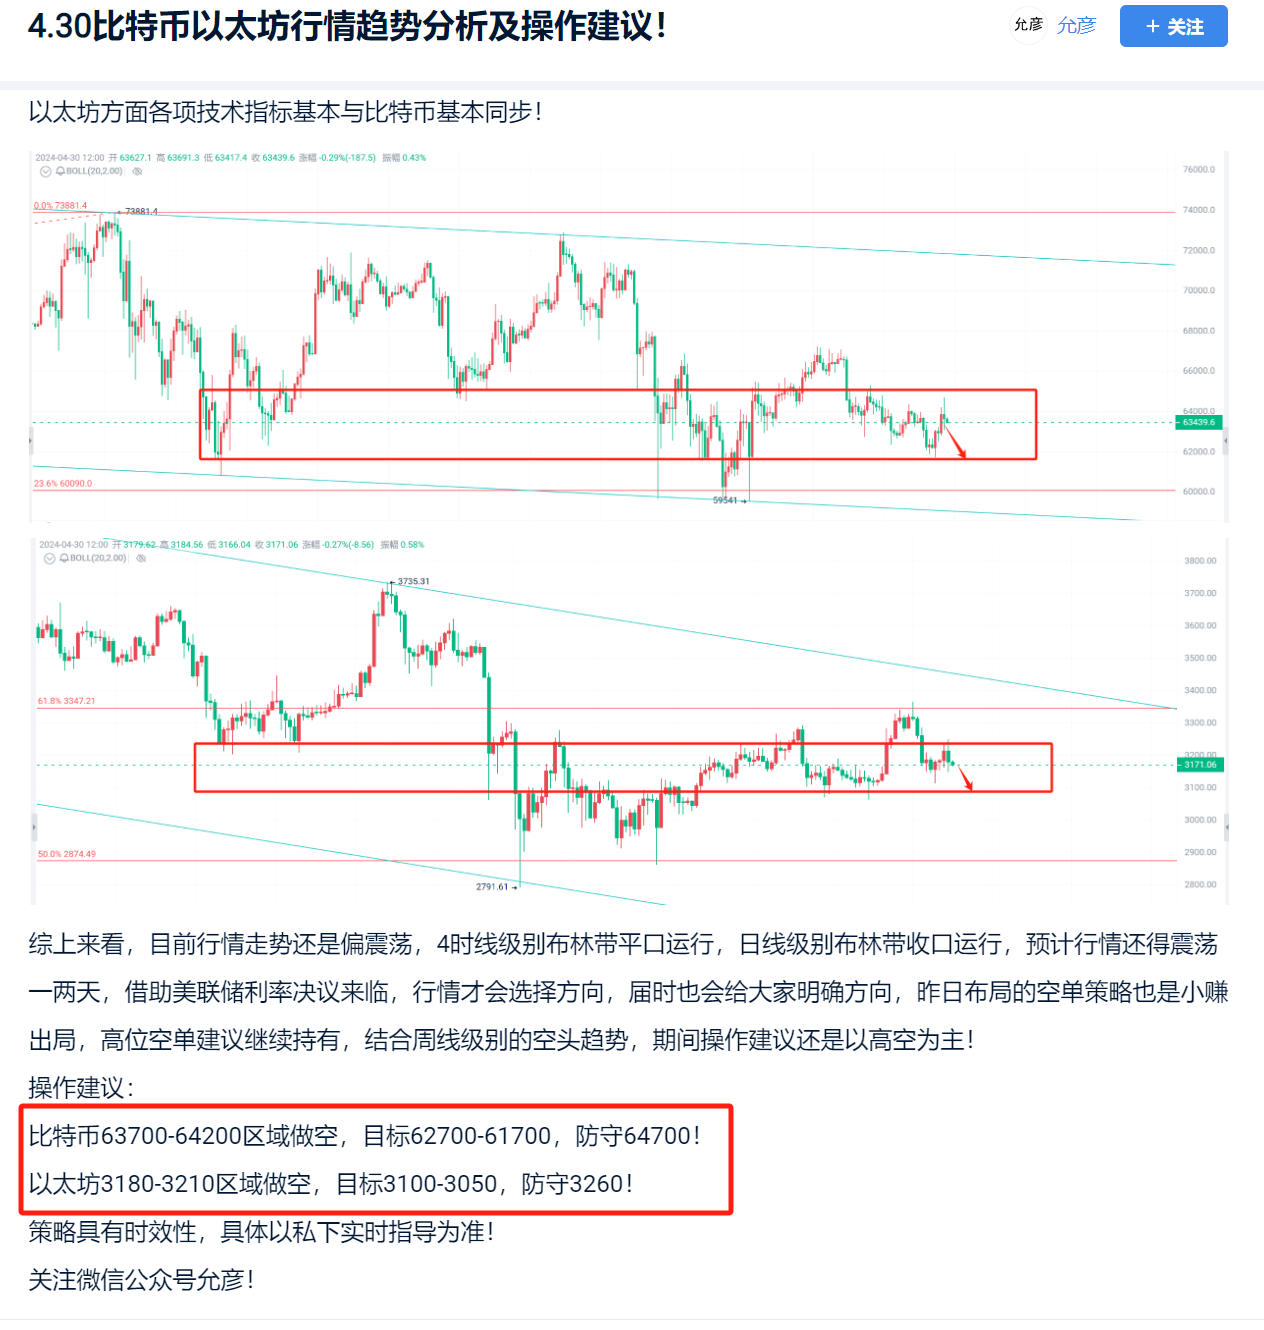
Overall, the current market trend is still running within a box structure. It has been mentioned multiple times before that the levels of 64,500 for Bitcoin and 3,350 for Ethereum are the short-term turning points for the market. The market stability at these levels is essential before discussing the bullish return. In the past two days, short positions have been established based on the pressure level, including short positions in the range of 63,700-64,200 for Bitcoin during the day, with a target of 62,700-61,700, and short positions in the range of 3,180-3,210 for Ethereum, with a target of 3,100-3,050. Currently, the profits have exceeded expectations. It is advisable to take profits steadily, or for the more aggressive, to retain some bottom positions and continue to target 61,000 for Bitcoin and 3,000 for Ethereum. If these levels are broken, look at 60,000 and 2,900 respectively. Subsequent operations are recommended to focus on short positions during the rebound. As the monthly closing approaches, the market is likely to retest the previous low or even break through it.
The strategy is time-sensitive, and specific guidance in real time should be followed privately.
Follow WeChat public account "允彦" for more information!
免责声明:本文章仅代表作者个人观点,不代表本平台的立场和观点。本文章仅供信息分享,不构成对任何人的任何投资建议。用户与作者之间的任何争议,与本平台无关。如网页中刊载的文章或图片涉及侵权,请提供相关的权利证明和身份证明发送邮件到support@aicoin.com,本平台相关工作人员将会进行核查。


