Author: Gwen
Corresponding author: Bjeast, Enzo, Youbi Investment Team
On the abnormal movement of gold, US bonds, interest rate cuts, balance sheet reduction, and the US presidential election.
TL;DR
Since the end of March, gold and the US dollar have decoupled, showing a simultaneous increase. This is mainly due to the recent surge in geopolitical events outside the US, leading to increased global safe-haven sentiment, and both gold and the US dollar have shown safe-haven properties.
Central banks led by China have started selling US bonds and increasing their gold holdings, indicating a trend of partial resistance to US dollar hegemony and uncertainty in demand for long-term US bonds. If other sovereign countries have earlier expectations of interest rate cuts, such as Europe and Switzerland, and inflation remains high, the US dollar will continue to strengthen.
In the short term, due to the expected slowdown in the Fed's balance sheet reduction in the middle of the year and the unexpected increase in the Treasury General Account (TGA) balance in April, there will be some liquidity impact to hedge against the issuance of Treasury bonds. Attention should be paid to the specific amount of Treasury bond issuance and the ratio of short and long-term bonds.
However, in the medium to long term, the US bond crisis has not been resolved. The current US government's fiscal deficit has soared, and the temporary debt ceiling law will end in January next year. The market expects the demand for bond issuance to remain the same as last year. When reverse repurchase agreements approach zero, the TGA account balance becomes a key indicator, and caution should also be maintained regarding bank reserve requirements.
In the two months before the election year, due to the uncertainty of the election and specific policies, historically, risk assets tend to show a volatile decline. The Federal Reserve, in order to maintain its independence, will try to maintain economic growth as much as possible in the election year to keep the market's liquidity abundant.
The US economy has shown strong domestic demand, repeated inflation, and a significant decrease in the expectation of economic recession compared to last year. The market's "precautionary" interest rate cut expectations have collectively shifted to the second half of the year or even later. CME data shows that the market's expectation of interest rate cuts in September and November is as high as 45%, while the expectation of the first interest rate cut in December and January is gradually increasing. Combined with the historical performance of interest rate policies in election years, the interest rate policy in the election month (i.e., September) is usually more cautious. In addition, the sufficient conditions for interest rate cuts are a weak labor market and weak inflation, and caution should be maintained in response to financial market tightening.
Expanding the balance sheet has a more direct impact on market liquidity than interest rate cuts. The Fed is already considering slowing down the reduction of the balance sheet, and it is widely expected that the reduction of the balance sheet will be slowed down in May or June to hedge against liquidity tightening. At the beginning of next year, the reduction of the balance sheet will be completely stopped, followed by an expansionary cycle. At the same time, history has shown that there is a high probability of a shift in operations shortly after the end of the election.
1 Decoupling of Gold and the US Dollar
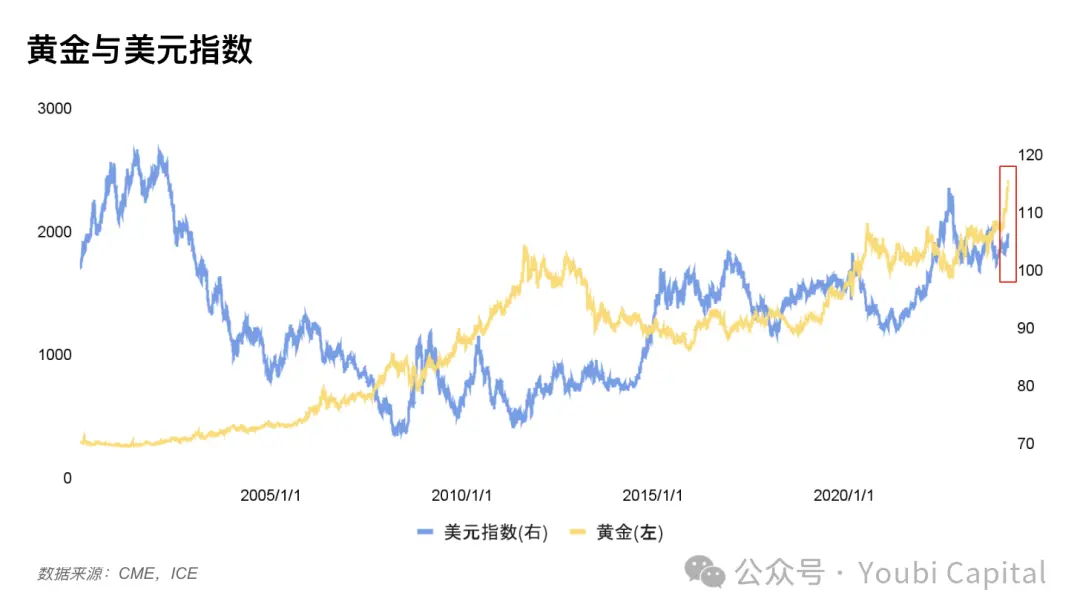
Figure 1: Trend chart of the US dollar and gold prices
In the past, the international gold price trend and the US dollar index were usually negatively correlated, but since the end of March, gold and the US dollar index have shown an abnormal simultaneous upward trend. The negative correlation can be explained by the three properties of gold, namely commodity, currency, and safe-haven properties, which need to be discussed in combination.
Commodity pricing: A strong pricing currency will lower the price of the priced commodity (the same applies to commodities)
Financial properties: Gold is an alternative to the US dollar and a potential substitute when US dollar credit declines. When the US dollar is weak, investing in gold may yield higher returns.
Safe-haven properties: A strong US dollar usually indicates a strong economic foundation, leading to a decrease in demand for safe-haven assets. However, as the world's currency, the US dollar also has safe-haven properties. Specific risks need specific discussions.
1.1 Sharp Rise in Gold Prices
The recent abnormal increase in gold prices has attracted a lot of attention, mainly due to two reasons.
1) Market safe-haven sentiment triggered by geopolitical conflicts. Moscow airstrikes, Israeli airstrikes on the Iranian embassy in Syria (direct trigger), direct Iranian attacks on Israel's mainland, etc., have led to increased demand for gold purchases around the world, which is one of the drivers of the short-term rise in gold prices.
2) Continuous gold purchases by central banks to enhance demand. In order to hedge the risk of US bonds, some central banks have started reducing US bonds and increasing gold holdings, thereby pushing up the price of gold. This also indirectly reflects a crisis of confidence in the US dollar and the possibility of future de-dollarization. For example, the gold reserves of the People's Bank of China increased by 10 tons in January, marking the 15th consecutive month of gold reserve accumulation; the current total gold reserve is 2,245 tons, an increase of nearly 300 tons since the resumption of gold reserve accumulation in October 2022.
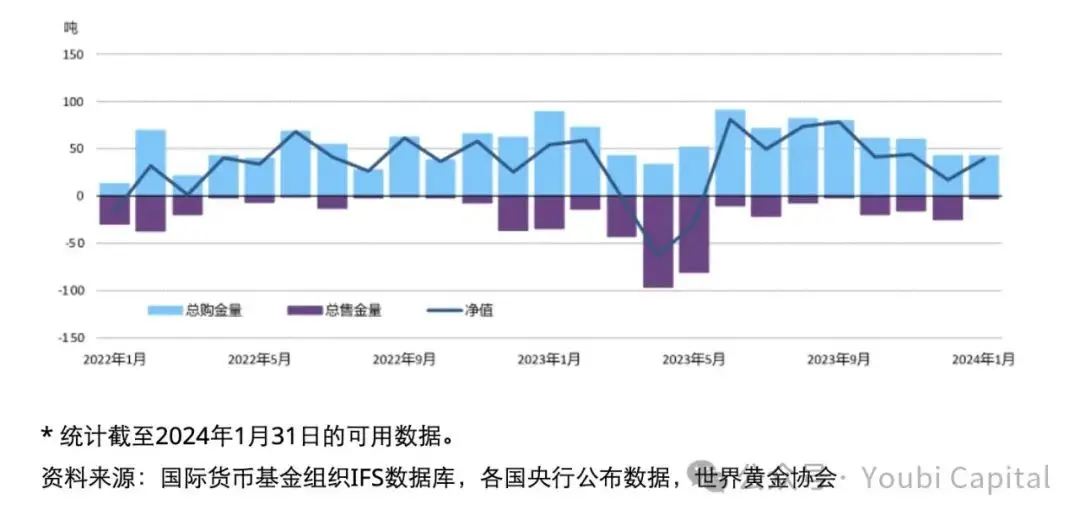
Figure 2: Trend of global central bank gold purchases, https://china.gold.org/gold-focus/2024/03/05/18561
1.2 Rise in the US Dollar Index
1) Strong domestic demand in the US economy has postponed expectations of interest rate cuts. The economic data for Q4 of 2023 in the US showed that the current economy has a certain resilience, and the data for Q1 of 2024 indicated that the US is currently facing a supply shortage and needs to rely on overseas imports. In addition, the fluctuating inflation data has reduced the necessity of interest rate cuts, and maintaining a tight monetary policy has stabilized the demand for the US dollar, prompting its rise.
2) The US dollar is passively rising due to international exchange rates, such as the unexpected early interest rate cut by Switzerland. If other currencies adopt loose monetary policies, the US dollar's exchange rate against other countries will rise due to interest rate differentials, thereby pushing up the US dollar index.
3) As the world's currency, the US dollar absorbs some of the safe-haven demand. When geopolitical crises do not involve the US mainland, the safe-haven properties of the US dollar will partially emerge, and at this time, it will have the same effect as gold.
1.3 Why Both Are Strong
Reason one: Both the US dollar and gold have safe-haven properties. When sudden risk events occur, leading to a geopolitical crisis or worsening economic crisis, excessive market safe-haven sentiment will lead to a situation where both strengthen simultaneously. At the same time, the influence of gold's commodity and financial properties is smaller than its safe-haven properties. For the US dollar, the US maintains a tight monetary policy, while the currencies of other economies are weakening, supporting the strengthening of the US dollar. Similar situations have occurred in history, such as the US intervention failure in 1993, the European sovereign debt crisis in 2009, and instability in the Middle East.
Reason two: Although the US dollar is showing a short-term strengthening trend, the behavior of some central banks reducing US bonds and increasing gold holdings also suggests resistance to US dollar hegemony, with a partial trend of de-dollarization. Caution should be exercised regarding a US dollar credit crisis.
From the perspective of the gold trend, in the short term, the trend of gold mainly depends on whether Iran will retaliate against Israel on a large scale. If the geopolitical situation continues to deteriorate, then gold may continue to surge. From the perspective of the US dollar index trend, currently, some other sovereign currencies have earlier expectations of interest rate cuts, such as the euro and the pound, and the Swiss National Bank has already cut interest rates. Despite this, the US dollar still has room for interest rate differentials and may still have certain support in the future.
2 Liquidity Risk Uncertainty
2.1 Market Liquidity Obstruction
Market liquidity is an important indicator for judging future market trends. The early bull market was also due to the increase in traditional funds' liquidity brought about by the approval of BTC ETFs and the dovish remarks of the Federal Reserve, leading to short-term liquidity increase, and finally, a pullback due to the overall lack of market liquidity.
The financial market often measures market liquidity through the real liquidity indicator = Fed liabilities - TGA - reverse repurchase = financial institution deposits + currency in circulation + other liabilities, for example, in the chart, we can see that the previous cycle of BTC and financial liquidity indicators showed a positive correlation, and even had an overfitting trend. Therefore, in an environment of abundant liquidity, market risk appetite will be enhanced, especially in the cryptocurrency market, where the impact of liquidity will be magnified.
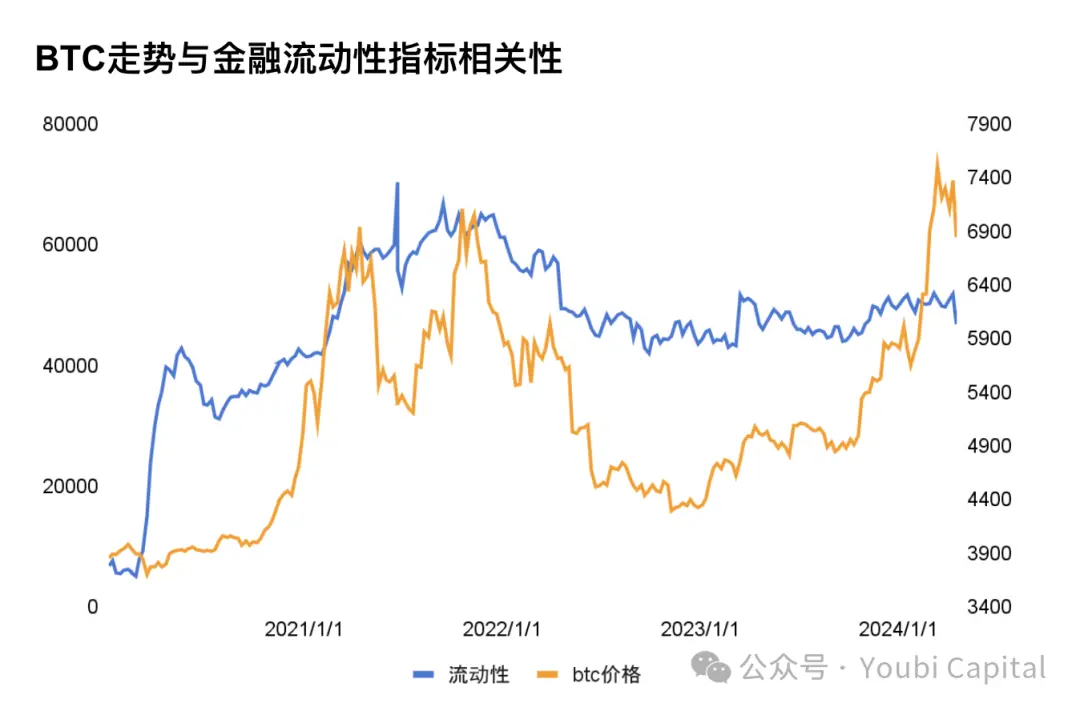
Figure 3: BTC and financial liquidity indicators
2.2 Liquidity Risk
2.2.1 Decline in Reverse Repurchase Agreements
The recent decline in the scale of reverse repurchase agreements is mainly used to offset the increased issuance of US bonds and the liquidity decline caused by the Fed's balance sheet reduction. The liquidity release in March was mainly contributed by the release of reverse repurchase agreements. However, the scale of reverse repurchase agreements continues to decline, and the Fed currently maintains a monthly reduction of $95 billion in the balance sheet. At the same time, to address the arbitrage space caused by low interest rates, the BTFP rate has been adjusted to not lower than the reserve rate since January 25th. After the narrowing of the arbitrage space, the usage of BTFP has declined, and it cannot further increase the size of the Fed's balance sheet. Additionally, in April, facing the tax season, the short-term rise in the TGA account has reduced overall market liquidity. Since 2010, the median TGA account balance has increased by 59.1% month-on-month in April, and it will gradually return to normal over time.
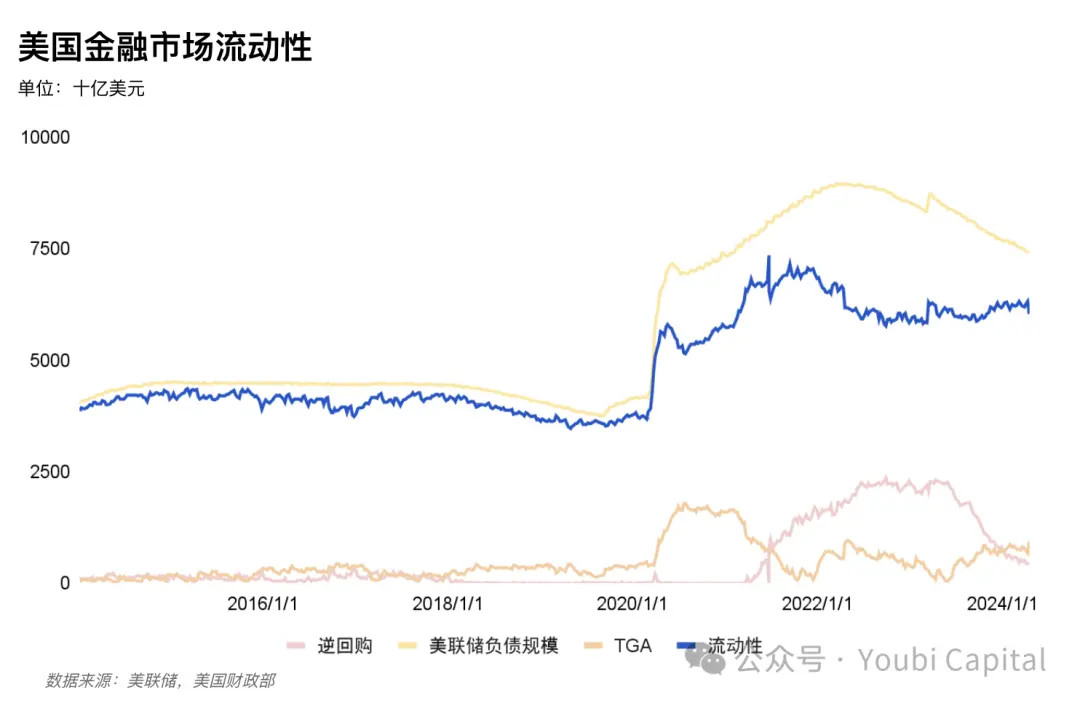
Figure 4: US financial market liquidity
In summary, in the short term, after the end of the tax season in May, the TGA growth exceeded expectations. Institutions predict that the Fed will start to ease the QT progress in the middle of the year, easing the trend of liquidity tightening. However, in the medium to long term, the market lacks the driving force for liquidity growth. The US financial liquidity is continuously declining due to the Fed's balance sheet reduction process and the exhaustion of the reverse repurchase agreement scale, further affecting risk assets. The uncertainty of the Bank of Japan's monetary policy adjustment will increase liquidity risk, bringing certain downward risks to technology stocks, cryptocurrencies, and even commodities and gold.
2.2.2 US Bond Risks
The high volatility of US bonds was an important factor in the "stock-bond-gold" event in March 2020. The recent surge in US bond yields has once again exposed the potential problem of supply and demand imbalance in the US bond market.
2.2.1 Oversupply
In 2023, the deficit rate reached -38%, a year-on-year increase of 10%, indicating the need to continue issuing US bonds this year. The high deficit rate caused by the massive stimulus during the pandemic, combined with the interest rate hike cycle, has led to a fiscal situation with high debt and high deficits. The weighted average interest rate for the total outstanding debt in the 2023 fiscal year was 2.97%, continuously increasing the total interest amount that the US needs to repay. In 2023, new US bonds amounted to 26.4 trillion, and in 2024, it was 5.9 trillion, reaching a total of 34.58 trillion.
In the short term, the refinancing expectations given by the Treasury Department on April 29th show an increasing trend, and it is necessary to track the quarterly refinancing plan officially announced by the Treasury Department. Although institutions represented by Nomura generally predict that due to an unexpected increase in tax revenue for the Treasury Department in April, with the TGA account significantly increasing by $205 billion more than expected, Janet Yellen may lower the refinancing expectations.
In the medium to long term, the market generally expects the US to have a debt issuance scale of 20-25 trillion this year, so there will be an issuance of 14.1-19.1 trillion this year, which is close to the speed of the first quarter of 2024. The law suspending the debt ceiling for US bonds will end on January 1, 2025. In order to prevent a recurrence of the US bond crisis, the Treasury Department has the incentive to issue a sufficient amount of US bonds to ensure short-term government spending and normal operations after the suspension of the debt ceiling. Wall Street expects that regardless of who wins the presidential election in November, the US government will continue to issue a large amount of bonds.
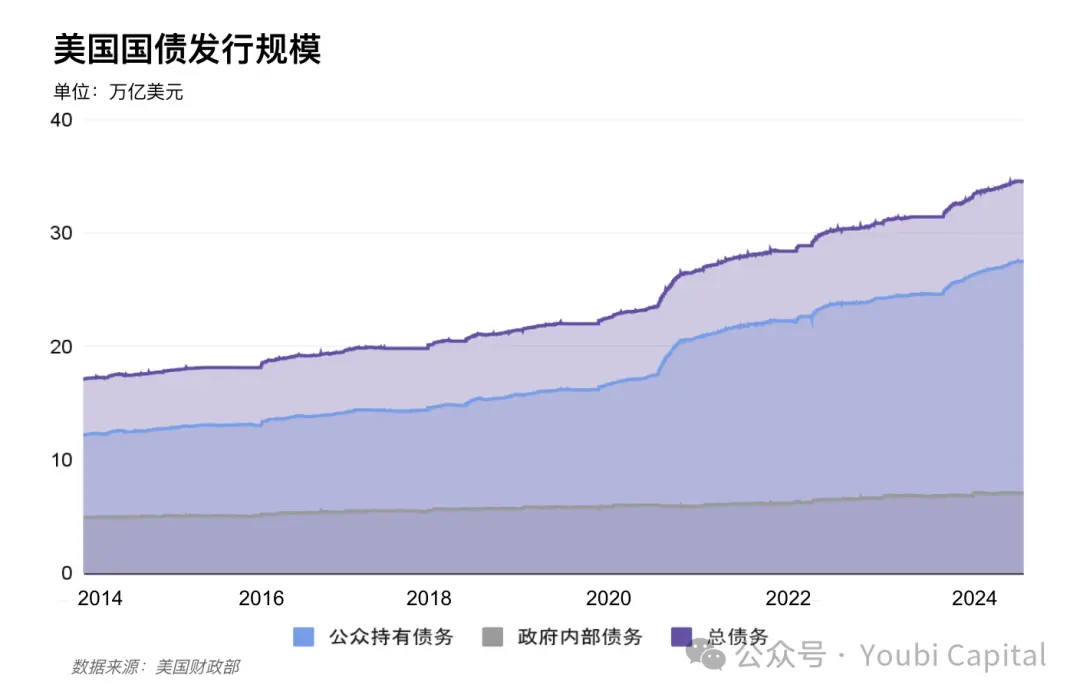
Figure 5: US bond issuance scale
2.2.2 Weak Demand
Foreign investors and the Fed are the largest buyers of US bonds, accounting for half of the market share of tradable US bonds. Although the Fed is currently considering slowing down the reduction of the balance sheet, both have stopped increasing their holdings of US bonds since 2022, shifting the supply pressure to domestic US investors. The amount of investment by the domestic resident sector has significantly expanded. Domestic investors tend to prefer short-term bonds, and their capacity to absorb is limited, with high volatility. The issuance of short-term bills has exceeded the ideal range, with short-term bills accounting for 53.8% of the Treasury Department's debt since the suspension of the debt ceiling in June 2023 (85.9% in November 2023). The Treasury Borrowing Advisory Committee recommends that the proportion of short-term bonds should be maintained at 15-20%.
Major Buyers of Long-Term Bonds>
The Fed's balance sheet reduction process is ongoing, with a total reduction of $1.016 trillion from Q1 2022 to Q4 2023. The process of reducing the balance sheet may slow down in the short term, but it will not suddenly change direction. According to the March FOMC meeting, the FOMC unanimously agreed to halve the monthly reduction of the balance sheet, with no change in the reduction limit for MBS and a downward adjustment for US Treasury bonds. If the Fed slows down the reduction of the balance sheet process as scheduled, it will hedge against some of the demand for long-term bonds.
Japan, China, and the UK are the top three permanent buyers, holding over one-third of the US bonds held by foreign investors. The demand of major foreign investors had rebounded at the end of 2023 but has recently shown a downward trend again, especially with China selling $20 billion in US bonds in the first two months of 2024.
Major economic entities have experienced changes in their local currency policies, and with the current strengthening of the US dollar index, the European Central Bank is expected to cut interest rates in June. The yen exchange rate has significantly depreciated again and has not yet reversed its trend. In October 2023, when the yen fell below the 150 mark, the monetary authorities chose to sell US bonds to maintain the stability of their sovereign currency exchange rate;
The recent fluctuation in US inflation and the actions of some central banks, represented by China, to sell US bonds and increase gold holdings, indicate a trend of de-dollarization and a reduction in asset depreciation risk. Currently, there is no indication that China will reverse this trend and increase its holdings;
The uncertainty of geopolitical crises also affects the demand for US bonds.
Therefore, if the Fed starts to slow down the reduction of the balance sheet in May, the US dollar weakens, or geopolitical tensions ease, there is an opportunity to alleviate the US bond crisis from the demand side for long-term bonds.
Major Buyers of Short-Term Bonds>
The demand from the resident sector for bond purchases is unstable, with individual investors and hedge funds alleviating the current supply and demand imbalance. However, there is a limit to the amount of bonds that domestic individual investors can purchase, and hedge funds are sensitive to interest rates, susceptible to market influences, and may have a significant amount of selling. Therefore, the demand absorption of the resident sector has limitations and instability in the future.
The increased liquidity buffer caused by the larger issuance of short-term bonds comes from money market funds. Money market funds are characterized by flexible access and demand for short-term government bonds with overnight reverse repurchase agreements or within a six-month period, with very little demand for long-term government bonds. At the same time, the floating losses of money market fund assets can easily trigger market runs. Therefore, in most cases, they tend to choose overnight reverse repurchase agreements with more stable interest rates. In the future, when the US bond market experiences significant fluctuations, money market funds also have the possibility of selling US bonds.
Since the suspension of the US debt ceiling in Q2 2023, money market funds have increased their holdings of short-term US bonds by $203 billion. By transferring part of the demand for short-term US bonds through ON RRP, the scale of reverse repurchase agreements has decreased by $271 billion in 2024. Morgan Stanley predicts that the scale of reverse repurchase agreements will drop to zero in August, and the Fed will begin to reduce QT in June. However, it is not ruled out that the Fed will slow down the reduction of the balance sheet process earlier, pushing back the time point for the scale of reverse repurchase agreements to reach zero to Q4.
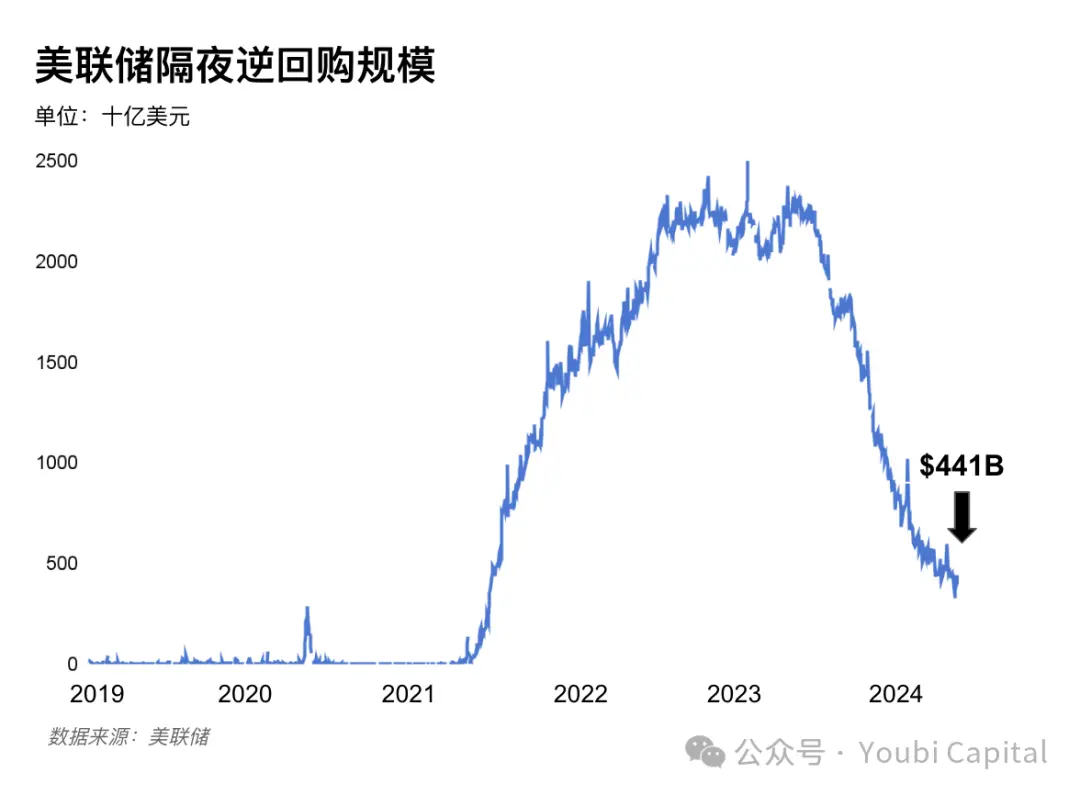
Figure 6: Fed's overnight reverse repurchase agreement scale
In conclusion, both supply and demand sides have many medium to long-term factors that lead to an imbalance. If the Fed plans to slow down the reduction of the balance sheet process in May, the US dollar weakens, or geopolitical tensions ease, there is a chance to alleviate the US bond crisis from the demand side for long-term bonds. However, the trend of declining reverse repurchase agreements will not reverse in the short term, and after the scale of reverse repurchase agreements approaches zero, the trend of the TGA will become a key indicator for releasing liquidity, while caution should also be exercised regarding changes in US bank reserve requirements.
3 Monetary Policy Trends
3.1 Impact of the US Presidential Election on Risk Assets
The US presidential election has the greatest impact on risk assets in the first two months (September-October) as a negative factor and in the last month (December) as a positive factor. In the first two months, due to the uncertainty of the election results, the market usually shows a risk-averse sentiment. This situation is particularly evident in years with low differences in competitive votes, such as in 2000, 2004, 2016, and 2020. After the election is settled, the market tends to rebound as uncertainty diminishes. The impact factors of election years need to be combined with other macro factors for judgment.
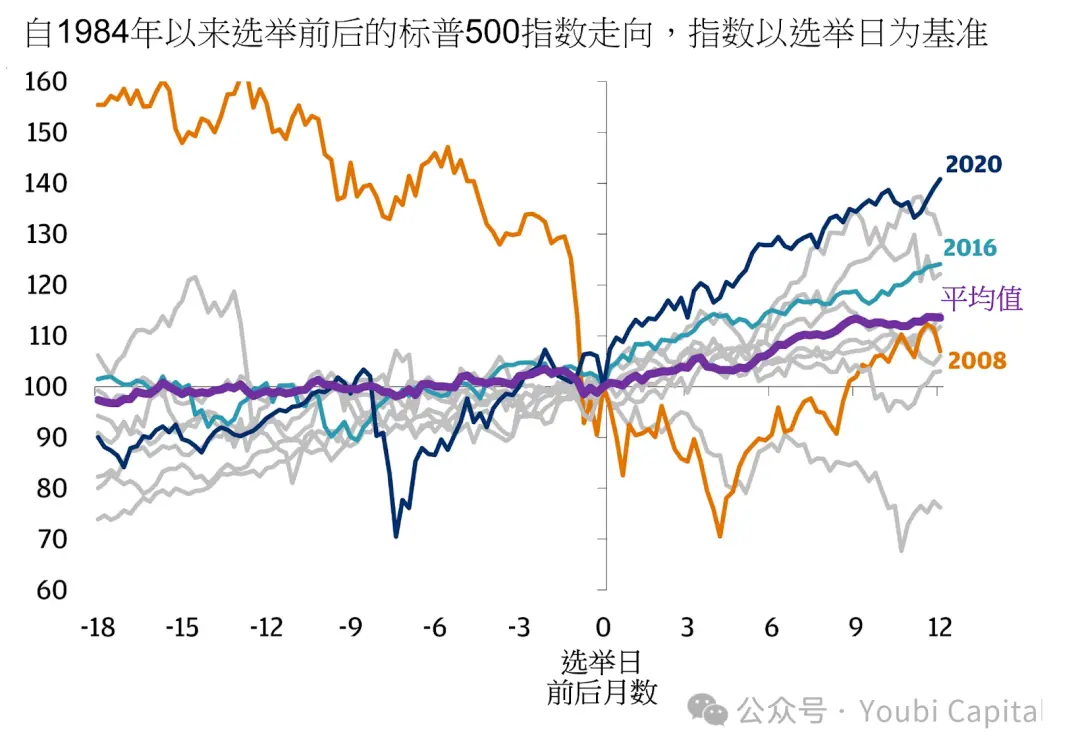
Figure 7: S&P 500 Index Trend Before and After Election Day, from JPMorgan
Analyst Stephen Suttmeier from Bank of America analyzed the average monthly returns of the S&P 500 Index in election years, and the results showed that the strongest month in terms of growth in election years is usually August, with an average increase slightly exceeding 3% and a success rate of 71%. Meanwhile, December is usually the month with the highest profit opportunity, with a success rate of 83%.
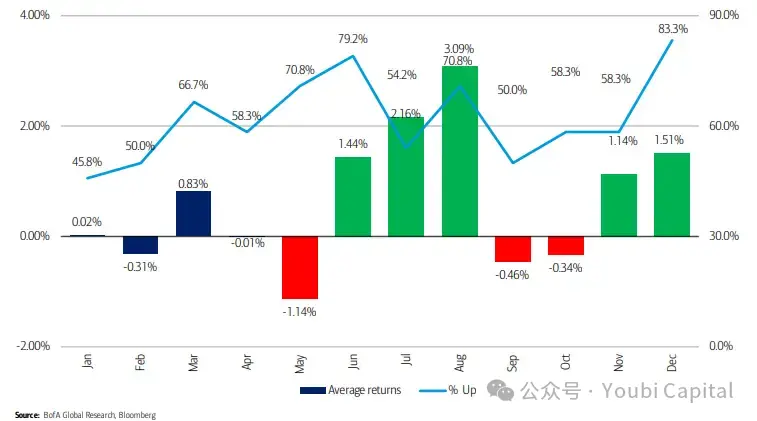
Figure 8: Average Return Rate in Election Years, from Bank of America Analyst Stephen Suttmeier
In addition to the uncertainty brought about by the differences in votes and party disputes, the specific policy differences of the candidates also have an impact on the market. In 2024, Biden and Trump are still the main candidates, and there are significant differences in their economic policies.
If re-elected, Biden will basically maintain the status quo, continue to levy higher corporate taxes to ease the deficit, but this may have a bearish impact on the stock market fundamentals. Additionally, compared to Trump, Biden will maintain greater independence for the Federal Reserve.
Trump advocates comprehensive tax cuts while increasing infrastructure spending. During his previous term, effective corporate income tax rates significantly decreased, while the deficit rate rapidly increased, thereby increasing the pressure on US bonds. At the same time, the coordination between monetary policy and fiscal policy may increase, and inflation risks will persist in the long term, accelerating the depreciation of the US dollar's credit.
3.2 Expectations of Fed Rate Cuts
The normalization of interest rates depends on economic fundamentals (such as growth, employment, and inflation) and financial conditions. Therefore, the market's expectations for Fed rate cuts are mostly "precautionary" rate cuts, judging whether rate cuts are needed based on the strength of the US economy or the degree of recession, although this approach is often easily influenced by the Fed's unpredictable expectations management.
So, does the US economy need precautionary measures? From the current GDP data, the economy is robust, with a low likelihood of recession, delaying the need for precautionary rate cuts. The revised real GDP growth rate for the fourth quarter of 2023 was 3.4% on a seasonally adjusted annualized basis, an increase of 0.2 percentage points from the previous estimate. Real personal consumption expenditure increased by 3.3% on a seasonally adjusted basis, an increase of 0.3 percentage points. Consumption continues to drive economic expansion, even with the pre-revised GDP data showing economic growth (GDP grew by 2.9% in Q4 2022). Although the GDP data for Q1 2024 was revised down to 1.6%, the main reasons for the decline were high imports and reduced inventories, indicating that domestic demand in the US remains robust, leading to a situation of internal economic supply and demand imbalance. Therefore, major financial institutions have generally postponed their expectations for rate cuts, with Goldman Sachs expecting cuts in July, Morgan Stanley also predicting cuts after June, and CICC forecasting a delay in rate cuts until Q4.
According to the latest pricing of CME interest rate futures, traders currently predict a 28.6% probability of a 25 basis point rate cut in July, a 43.8% probability in September, and a 43.6% probability in November. Therefore, the market's expectations for rate cuts in September and November are close, but the expectations for the first rate cut in December and January of the following year are increasing.
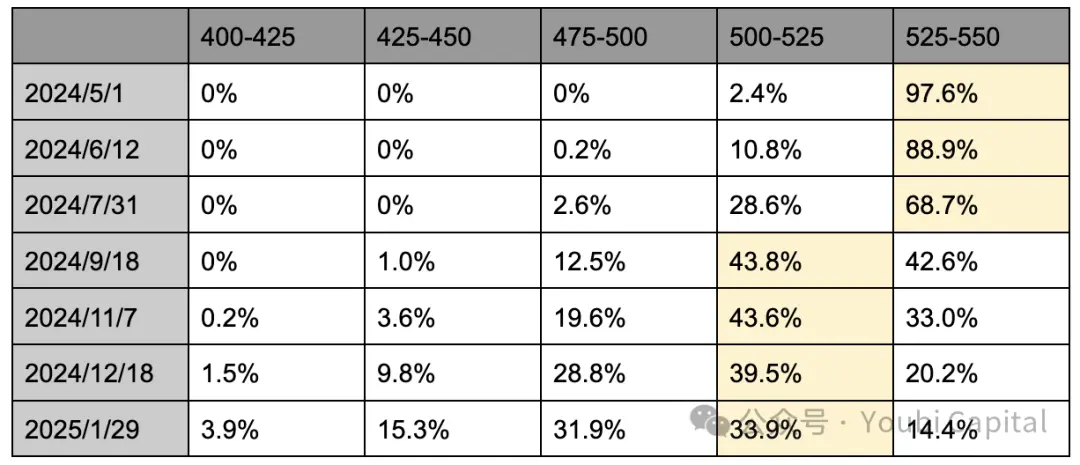
Table 1: Distribution of Rate Cut Expectations on CME, as of April 29, 2024
However, the arrival of rate cuts undoubtedly requires weak non-farm employment and inflation data, that is, an economic slowdown, or the need for financial conditions to tighten again. The uncertainty comes from the November US election. First, the Fed's change in monetary policy before the election has an impact on the election results, so the distribution range of changes in the federal funds rate in election years is smaller than in non-election years, and the decision to cut rates in September will be more cautious. It is also not ruled out that some Fed officials may maintain a "dovish preference" to support rate cuts in the case of resilient economic data. However, historically, research on US elections and monetary policy has shown that the probability of the Fed changing its policy before the election (before November of the election year) is low, while the probability of a short-term change in policy after the election is relatively high, with only 2 instances of a shift from rate hikes to rate cuts within a year, and 4 instances of a federal funds rate or monetary policy shift immediately after the November election month.
In conclusion, the US economy has robust domestic demand, fluctuating inflation, and widespread postponement of rate cut predictions by financial institutions to the second half of this year or even next year. CME data shows that the expectations for rate cuts in September and November are the highest, but the likelihood of rate cuts in December and January of the following year is increasing. However, it is still necessary to be cautious, as the sufficient conditions for rate cuts are economic weakness, so there may still be a tightening of financial markets before the arrival of rate cut policies. At the same time, historically, the interest rate policy and monetary policy (i.e., rate cuts in September) are usually more cautious before the election month, and the probability of a short-term shift after the end of the election month is higher.
3.3 Fed Balance Sheet Reduction Cycle
Is Expanding the Balance Sheet More Effective Than Rate Cuts?
Currently, most of the market's attention is focused on rate cut expectations, but in reality, expanding the balance sheet has a more direct impact on market liquidity than rate cuts. As mentioned earlier, market liquidity indicators = Fed liability size - TGA - reverse repurchase agreement scale. Expanding the balance sheet means the Fed expands its asset-liability balance sheet by purchasing assets such as US Treasury bonds or mortgage-backed securities through liabilities, increasing reserves in the banking system and currency in circulation, directly creating monetary expansion and increasing market liquidity, hence it is also called "printing money". Rate cuts, on the other hand, stimulate investment and consumption by lowering borrowing costs, transferring funds to risk markets to increase liquidity.
When Will the Monetary Policy Change?
The progress of balance sheet normalization depends on the supply and demand for reserves. According to an article published by New York Fed President Williams in 2022, "Scarce, Abundant, or Ample? A Time-Varying Model of the Reserve Demand Curve": "The reserve demand curve is nonlinear, with the adequacy measured by the reserve-to-asset ratio of banks, with 12% to 13% being the critical point for excessive and adequate reserves, and 8% to 10% being the warning line for a transition to scarcity." Financial market performance is often nonlinear, as evidenced by the market, with the reserve ratio approaching 13% in 2018 and then rapidly and nonlinearly falling to 8% after the Fed announced a slowdown in balance sheet reduction, eventually restarting expansion in October 2019 when it had fallen to 9.5%.
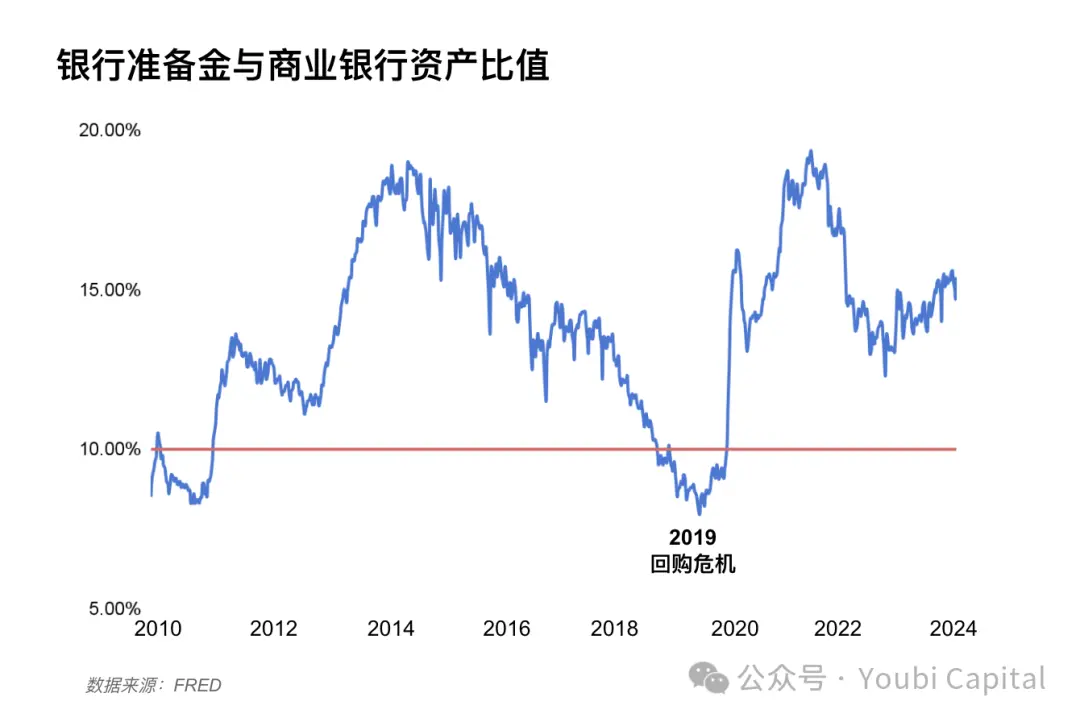
Figure 10: Ratio of Bank Reserves to Total Commercial Bank Assets
Currently, the reserve ratio in the US has reached 15%, still in a state of excessive reserves, and as the liquidity-constrained reverse repurchase agreement scale approaches zero, the reserve ratio will continue to decline. Institutions tend to predict the end of balance sheet reduction in early next year, with Goldman Sachs expecting a reduction in QT to begin in May and end in Q1 2025. Morgan Stanley believes that when the reverse repurchase agreement scale approaches zero, QT will be reduced, and it will be completely ended in early 2025. CICC predicts that the critical point will be reached in Q3, and if the Fed slows down in May, the critical value may be postponed to Q4. At the same time, historically, the Fed tends to make a monetary policy shift shortly after the end of the US election month.
In conclusion, the current signals from the Federal Reserve indicate a consideration to slow down the balance sheet reduction. The market generally predicts that the reduction may slow down in May or June, and the reduction will stop and the Quantitative Tightening (QT) will end early next year, followed by an expansion cycle. The current risk and uncertainty still lie in the increase in US bond supply and the reverse repurchase agreement scale approaching zero, leading to significant fluctuations in the US Treasury market. Especially in an election year, the stability of the economy is extremely important, and the Federal Reserve may stop the balance sheet reduction early and advance the schedule for expansion to avoid a repeat of the "repo crisis" in 2019.
4 Summary
Gold and the US dollar have recently shown a trend of simultaneous increase. In addition to geopolitical factors, attention should be paid to the trend of some central banks selling US bonds and increasing their holdings of gold, indicating a partial de-dollarization.
In the short term, due to the increase in TGA balance and the expectation of the Federal Reserve easing balance sheet reduction, which will partially offset the liquidity tightening caused by the issuance of US bonds, attention should also be paid to the total amount of refinancing in the second quarter and the ratio of short and long-term bonds. In the medium to long term, the imbalance between supply and demand for US bonds has not been resolved. Due to the high deficit rate and the legislation to suspend the debt ceiling next year, there is still a significant demand for US bond issuance in 2024. The reverse repurchase agreement scale will continue to decline, and attention should be paid to the trend of TGA balance and the non-linear decline in bank reserve ratios.
The US economy has robust domestic demand but fluctuating inflation, and the expectation for rate cuts has generally been postponed to the end of the year. The expectation to stop the balance sheet reduction is still temporarily set for early next year. Considering historical trends, monetary policy tends to be cautious before the US election, with a relatively high probability of a shift shortly after the election.
About Us
Founded in 2017, Youbi Capital is a venture capital and incubation institution focused on blockchain technology and Web3 applications, and is an early value discoverer and long-term supporter.
Disclaimer
The content of this article is for reference only and does not constitute any investment advice. Readers should bear all investment risks themselves, and the institution or its affiliated personnel shall not be held responsible for any consequences resulting from the reliance on or use of this article.
Copyright Statement
The content of this article is copyrighted to Youbi Capital and the author. If you need to reprint or quote the content of this article, please indicate that the source is Youbi Capital, and do not make any references, deletions, or modifications that contradict the original intention of this report.
免责声明:本文章仅代表作者个人观点,不代表本平台的立场和观点。本文章仅供信息分享,不构成对任何人的任何投资建议。用户与作者之间的任何争议,与本平台无关。如网页中刊载的文章或图片涉及侵权,请提供相关的权利证明和身份证明发送邮件到support@aicoin.com,本平台相关工作人员将会进行核查。


