Fidelity's analysis of digital assets indicates that multiple on-chain metrics show that the price of ETH has bottomed out and is undervalued.
Author: Biraajmaan Tamuly
Translation: Deep Tide TechFlow
Key Points:
Fidelity's digital assets report indicates that several Ethereum on-chain metrics suggest that ETH's trading price is below its valuation.
The BTC/ETH market cap ratio has returned to mid-2020 levels.
The number of active addresses on Ethereum's Layer 2 networks has reached a new high of 13.6 million.
New data from Fidelity Digital Assets suggests a cautiously optimistic outlook for Ethereum, indicating that its poor performance in the first quarter may present an opportunity. According to their latest Signals Report, Ether (ETH) fell 45% in the first quarter, erasing gains made after the U.S. elections, having peaked at $3,579 in January.
The price of Ether experienced a death cross in March, with the 50-day simple moving average (SMA) falling 21% below the 200-day SMA, reflecting bearish momentum. However, Fidelity notes that the short-term pain may turn favorable for Ether.
The investment firm pointed out that the MVRV Z-Score (a comparison of market value to realized value) dropped to -0.18 on March 9, entering the "undervalued" range. Historically, such levels typically signal a market bottom, indicating that Ether "looks cheaper" compared to its "fair value." The net unrealized profit/loss (NUPL) ratio also fell to 0, indicating a "surrender" state where unrealized profits equal losses, suggesting that holders are in a neutral position.
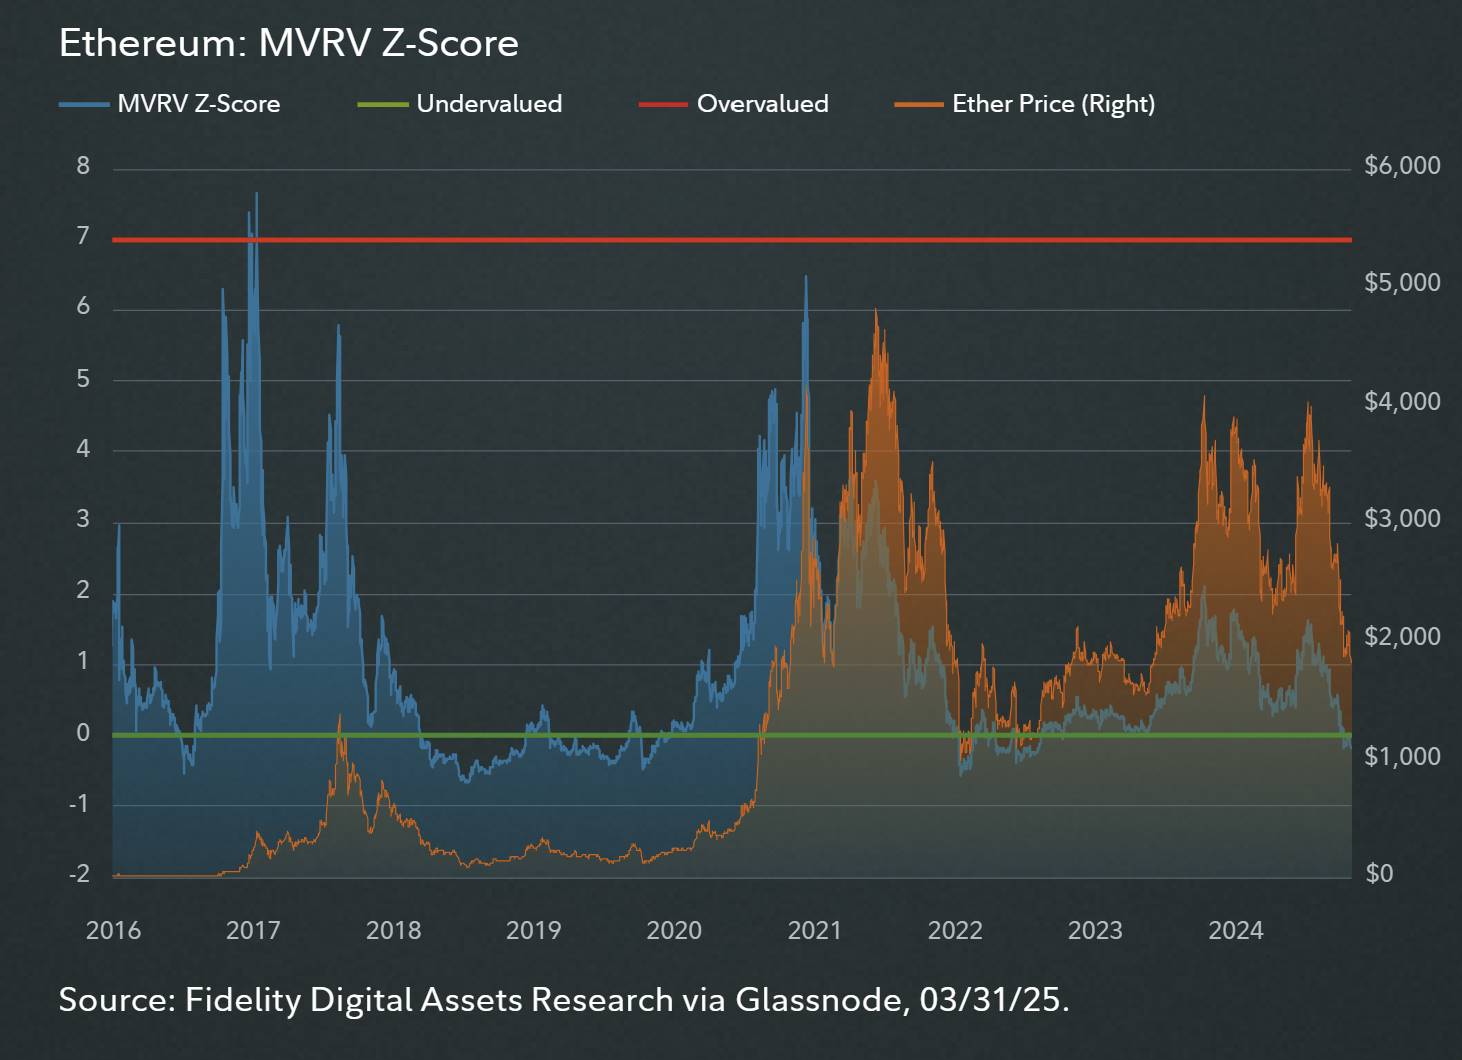
MVRV Z-score of Ethereum
Source: Fidelity Digital Assets Signal report
The actual price of ETH averages $2,020, which is 10% higher than its current value, showing that holders are facing unrealized losses. While this trend is bearish, the firm notes that the actual price has only slightly decreased by 3% compared to the 45% drop, indicating that short-term holders have sold off while long-term holders have remained steadfast, potentially stabilizing the base price.
However, the firm emphasizes that in 2022, despite ETH prices falling below the actual price, it continued to decline further before rebounding.
Fidelity also cited the market cap ratio of Ethereum to Bitcoin at 0.13, which is at mid-2020 levels and has been declining for 30 months.
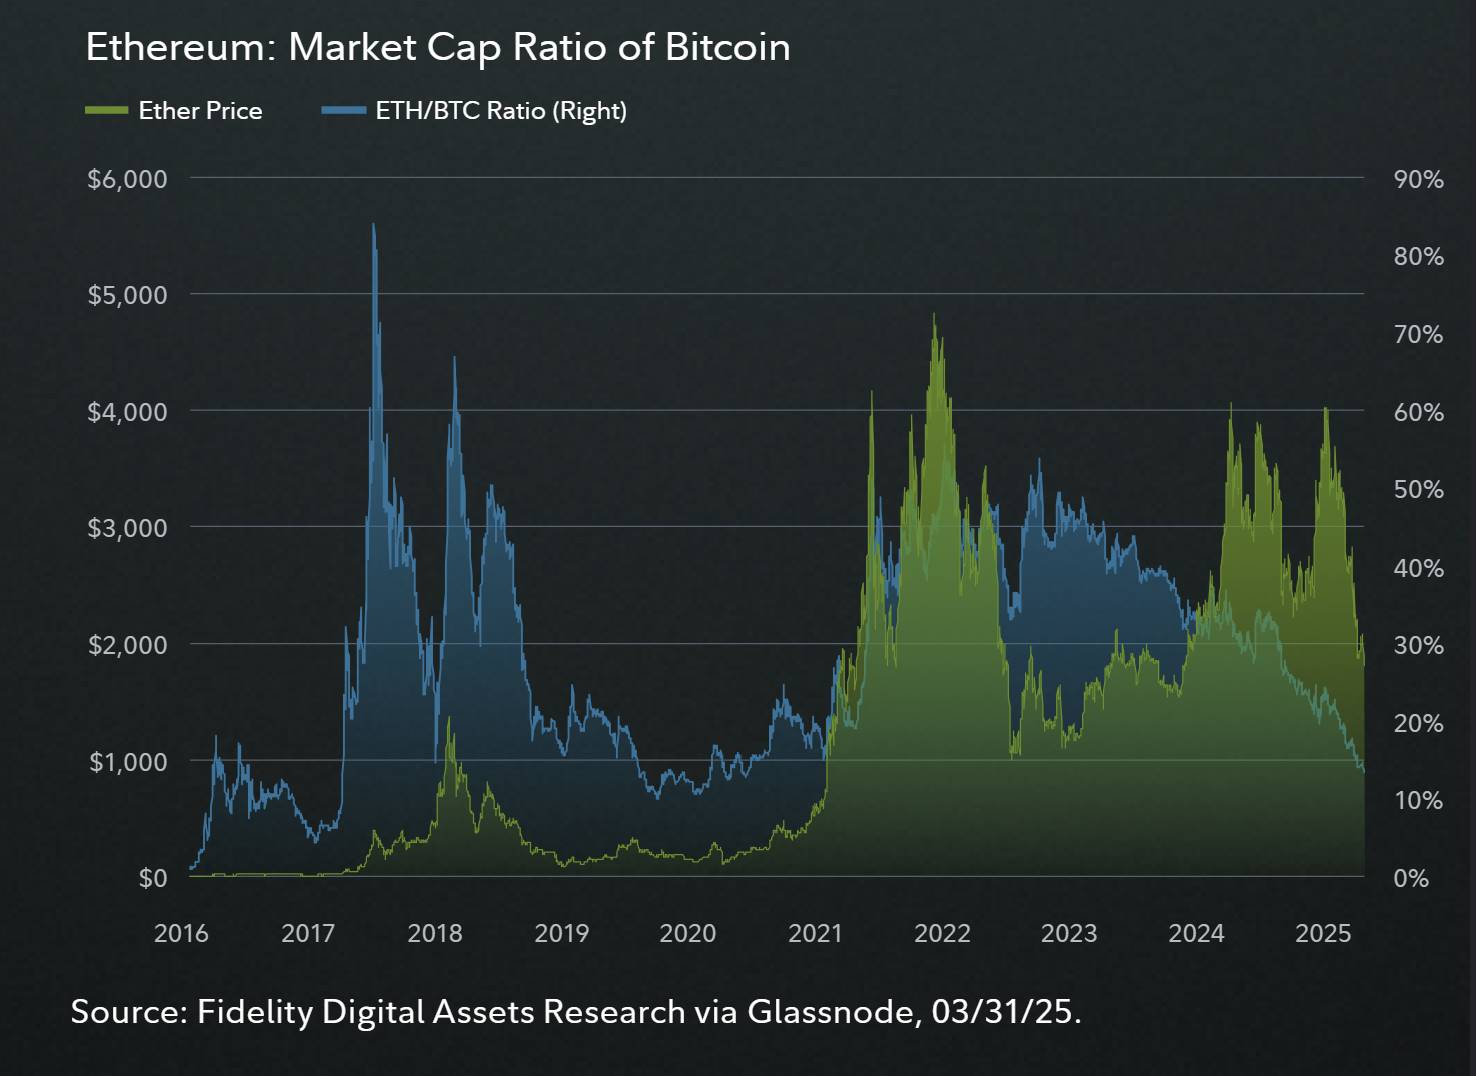
Ethereum/Bitcoin market cap ratio
Source: Fidelity Digital Assets Signals report
Ethereum Ecosystem Participation Reaches New Highs
Data from growthepie.xyz indicates that the number of unique addresses interacting with Layer 1 or Layer 2 networks in the Ethereum ecosystem has reached a historic high of 13.6 million. The proportion of active addresses increased by 74% over the past week, indicating the network's scalability and growing adoption.
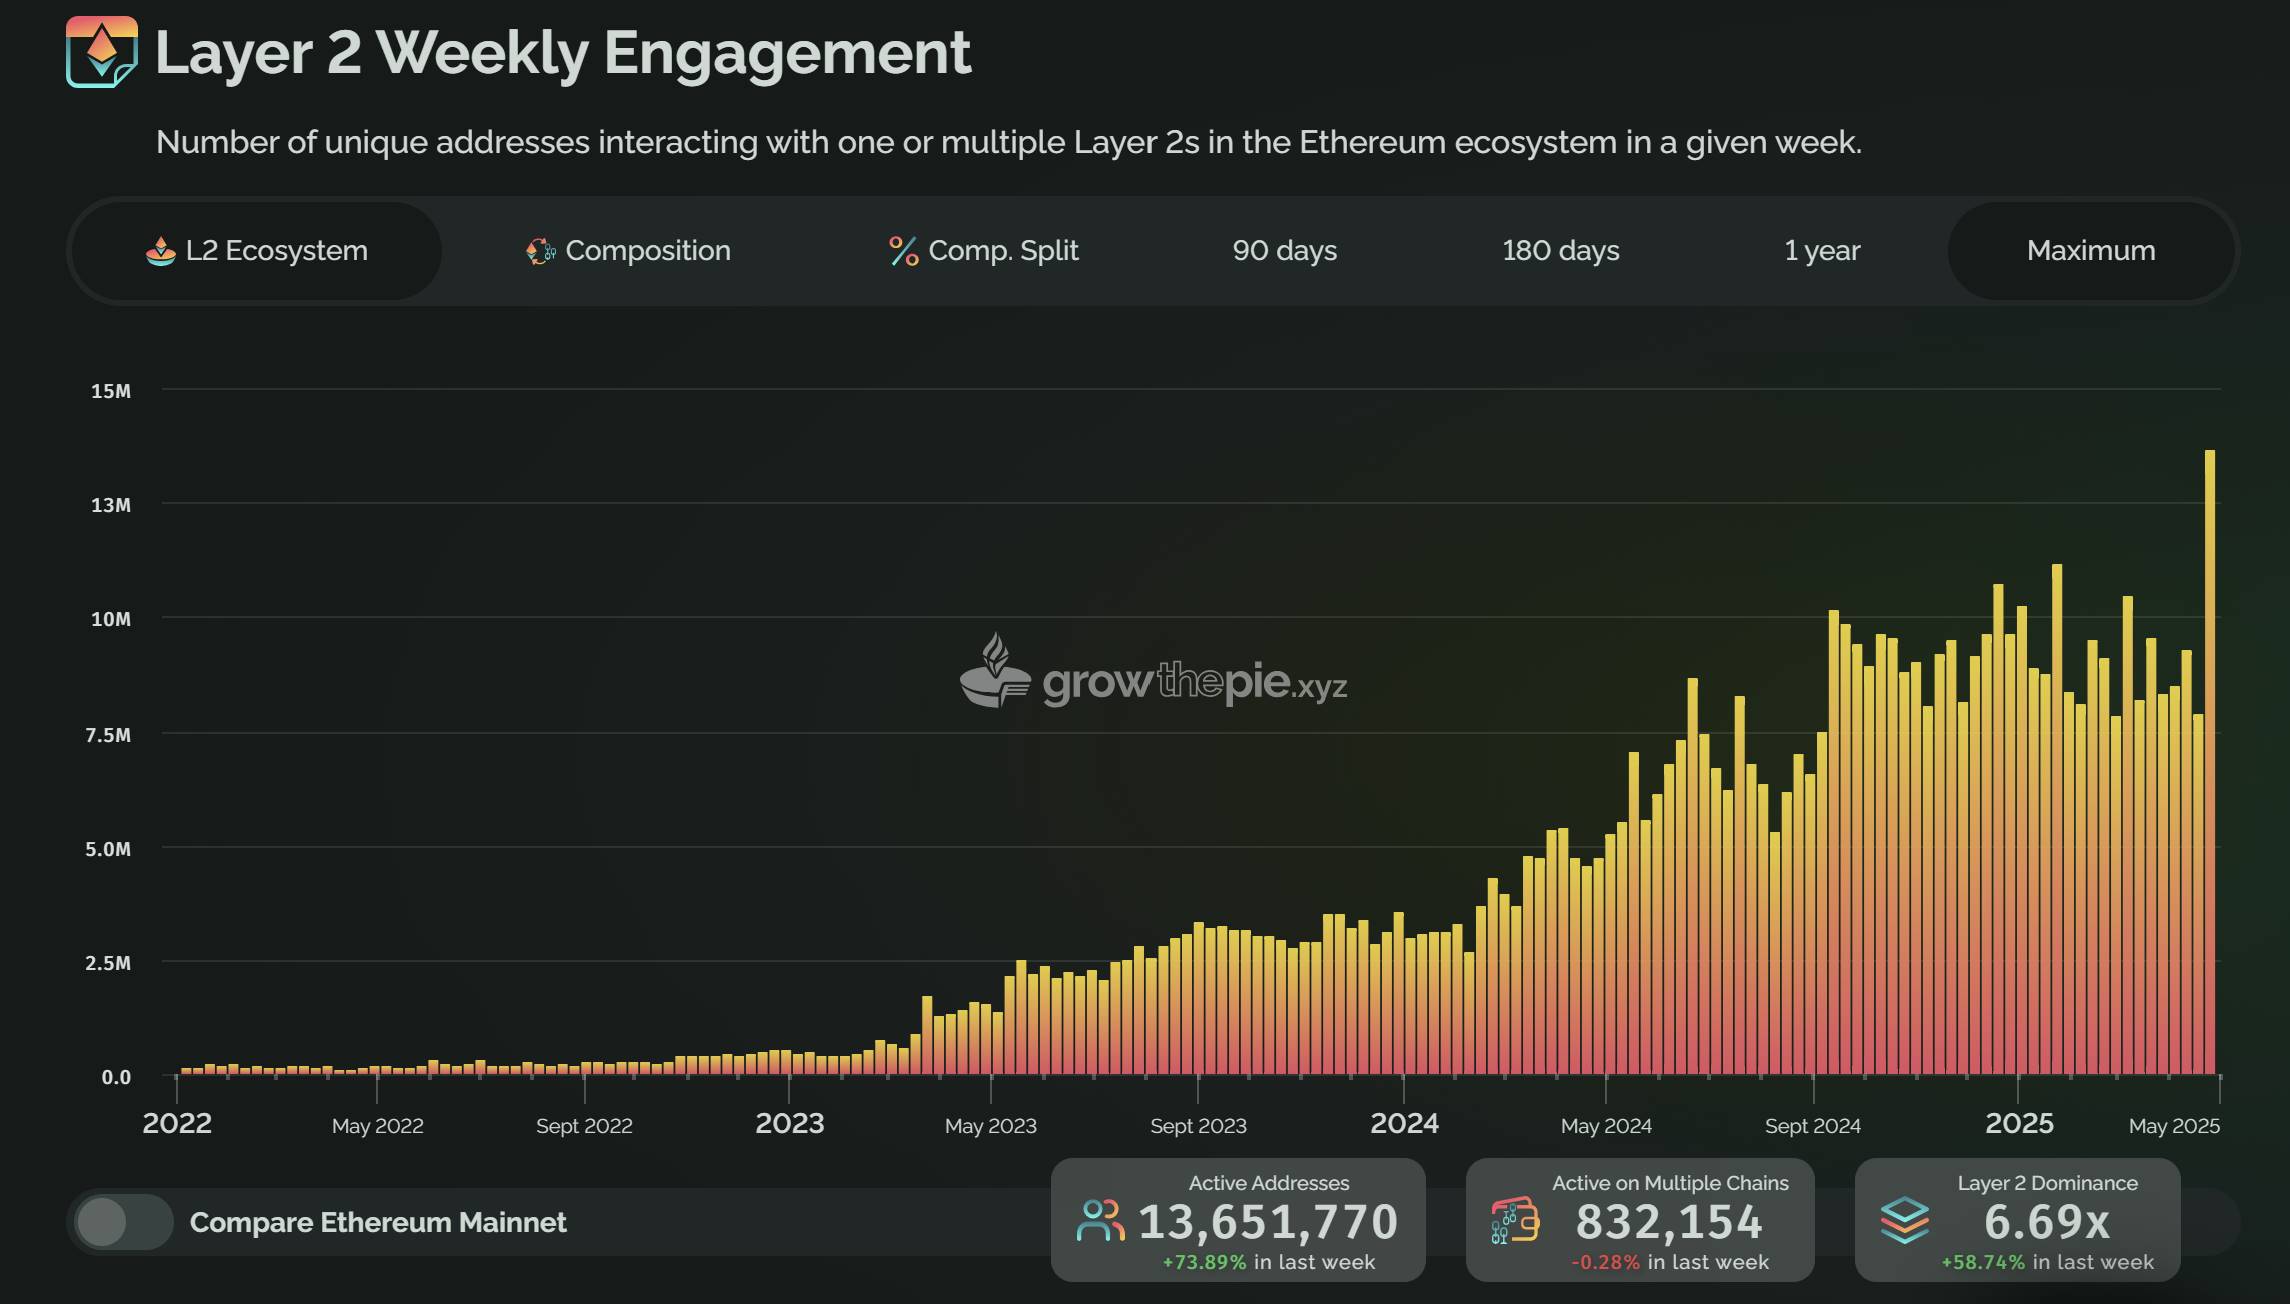
Weekly interactions between Ethereum and Layer 2 networks
Source: growthepie.xyz
Uniswap's new Layer 2 protocol, Unichain, leads with over 5.82 million weekly active addresses, surpassing Base and Arbitrum. The collective increase in active addresses has boosted Ethereum's Layer 2 network dominance by 58.74% over the past seven days.
Anonymous crypto trader CRG pointed out that the ETH price has recovered above the 12-hour Ichimoku cloud indicator for the first time since December 2024. The Ichimoku cloud indicates that when the price is above the cloud and the cloud turns green, it shows an upward trend, indicating bullish sentiment.
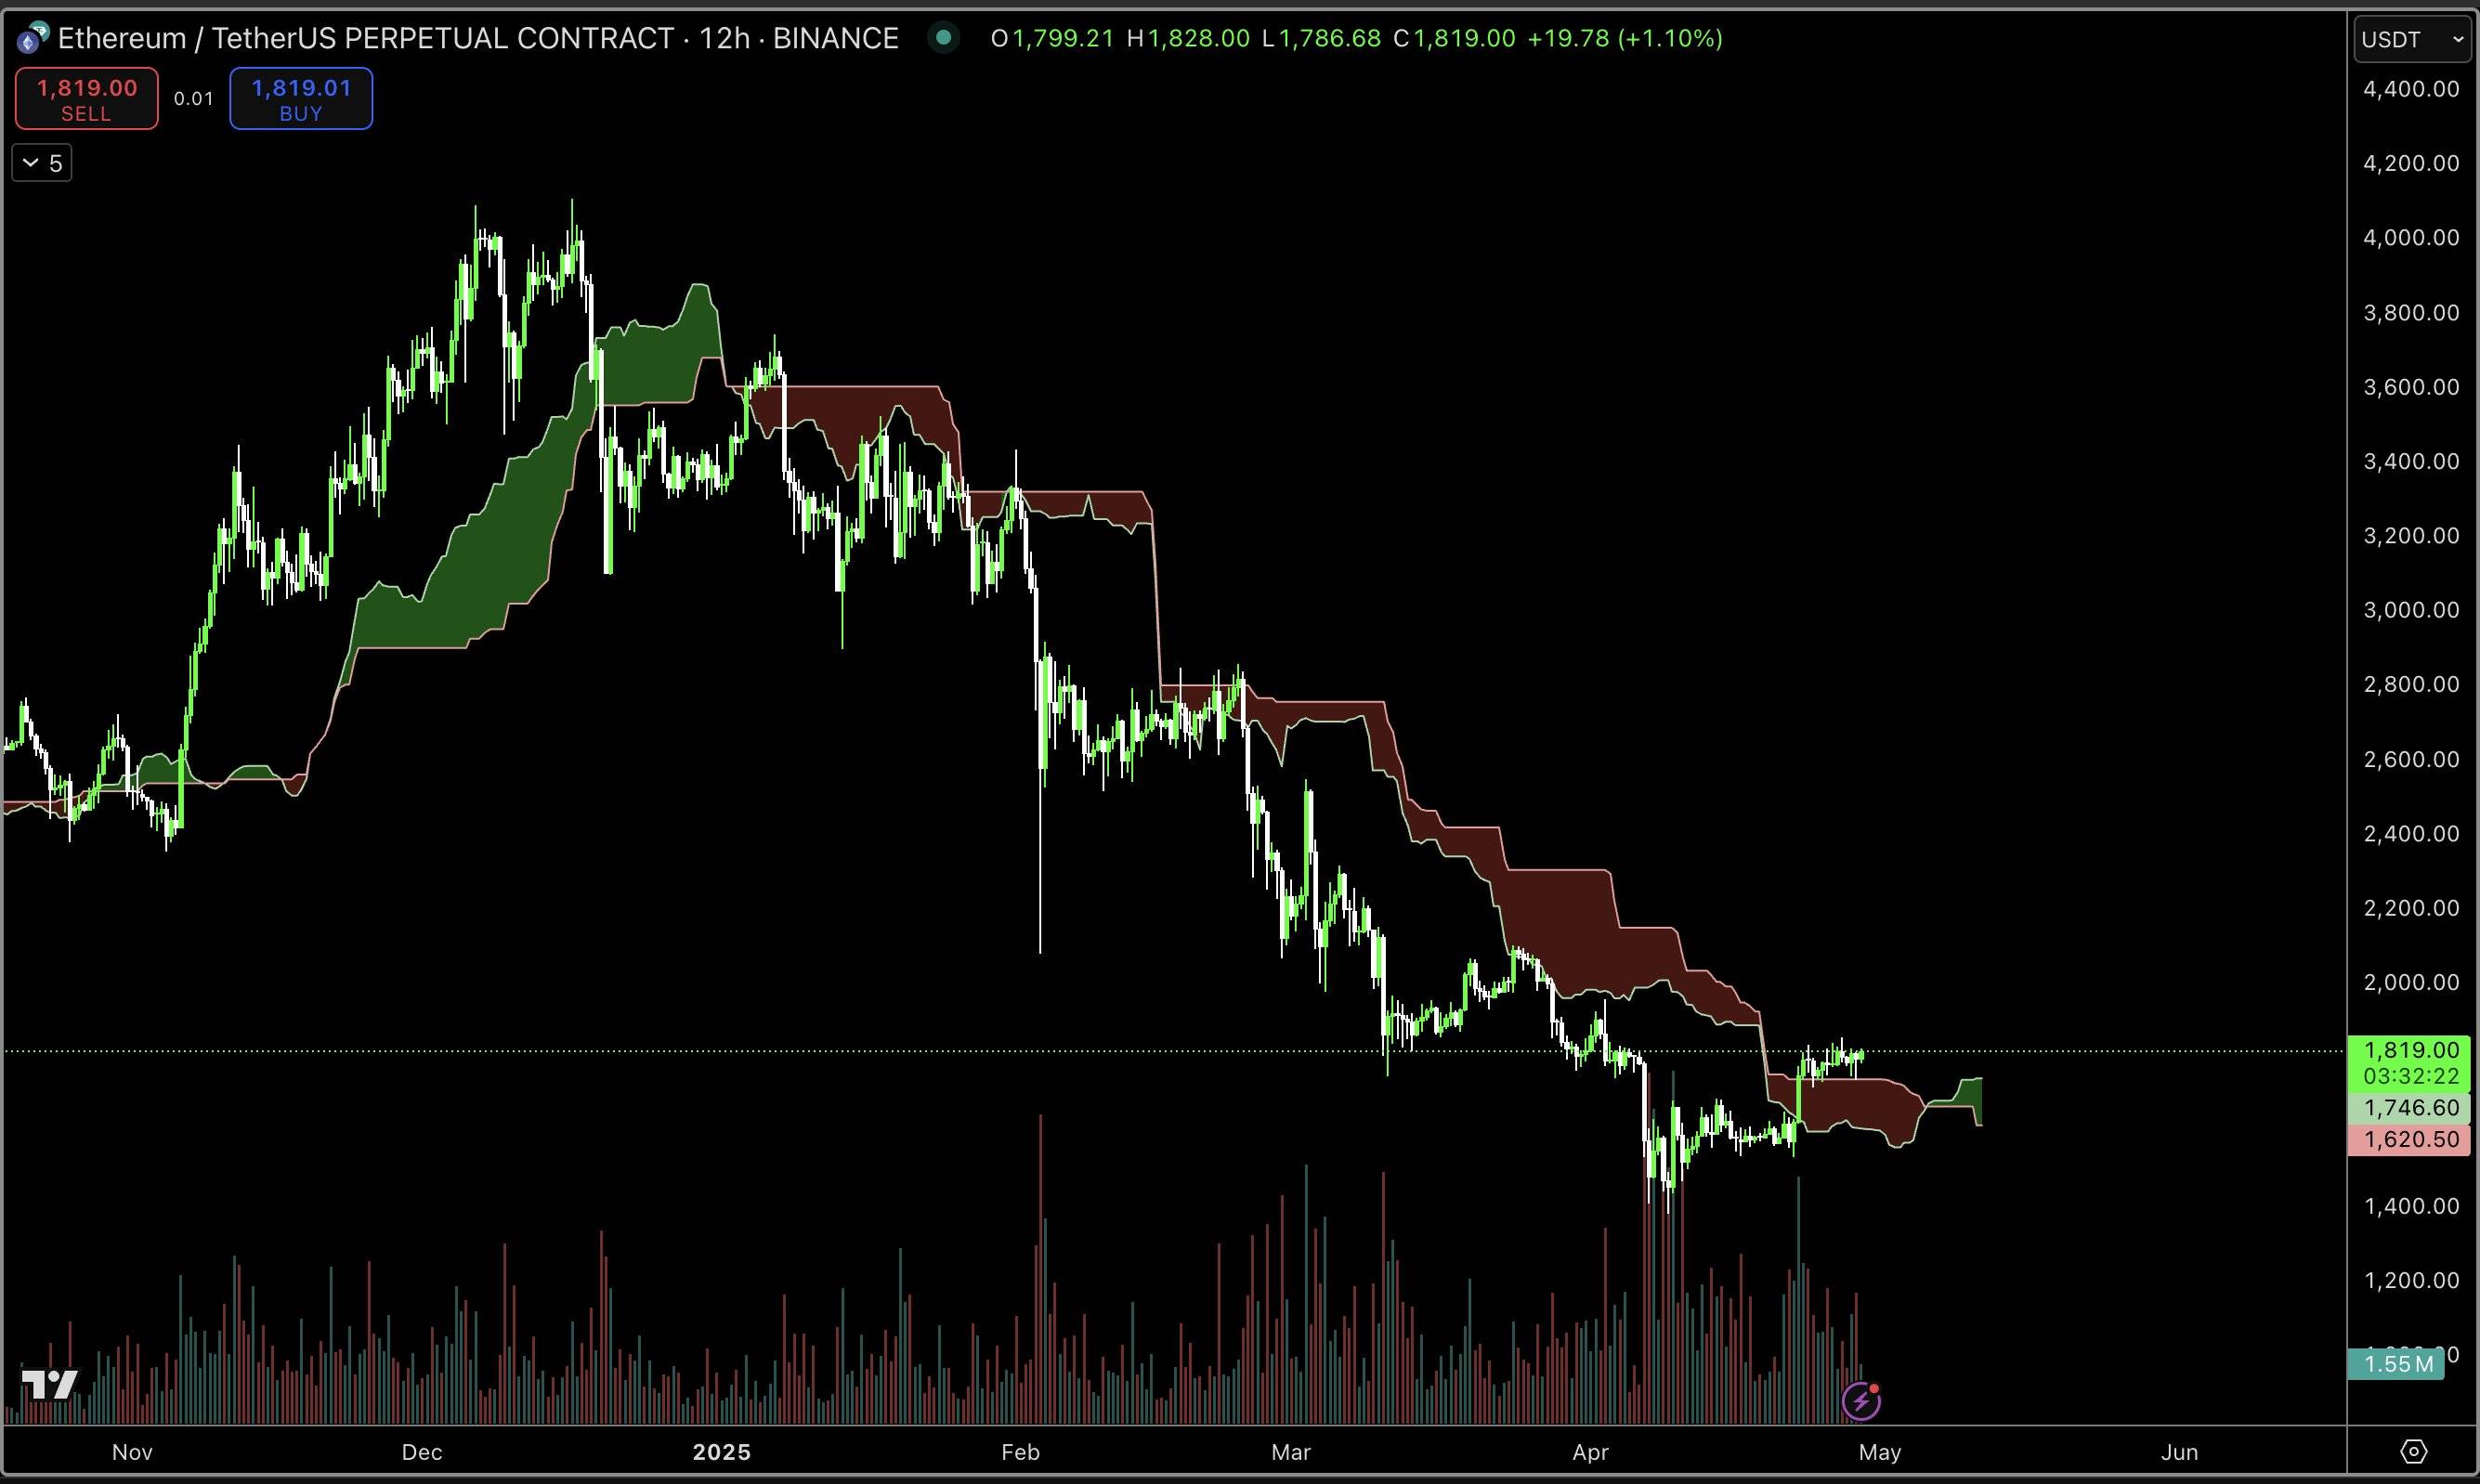
12-hour analysis of Ethereum provided by CRG
Source: X.com
This article does not contain investment advice or recommendations. Every investment and trading activity involves risks, and readers should conduct their own research before making decisions.
免责声明:本文章仅代表作者个人观点,不代表本平台的立场和观点。本文章仅供信息分享,不构成对任何人的任何投资建议。用户与作者之间的任何争议,与本平台无关。如网页中刊载的文章或图片涉及侵权,请提供相关的权利证明和身份证明发送邮件到support@aicoin.com,本平台相关工作人员将会进行核查。


