Q1 The winter of altcoins intensifies, Bitcoin season dominates the market.
Author: CoinMarketCap
Translation: Deep Tide TechFlow
Market Overview
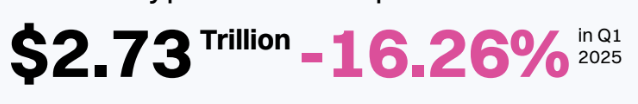
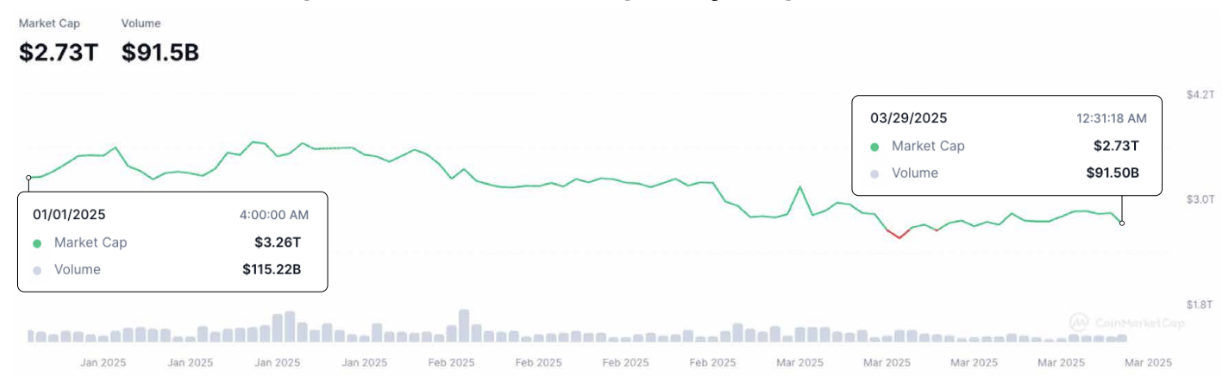
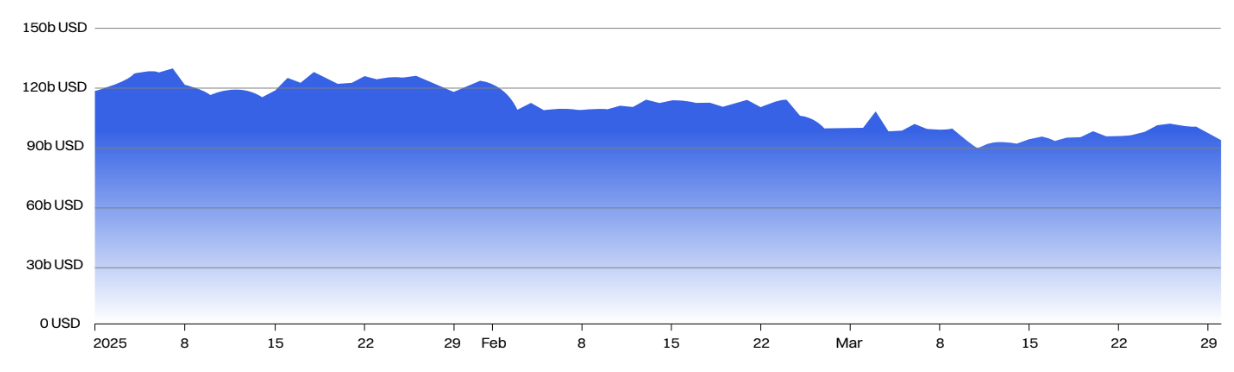
The global cryptocurrency market capitalization decreased by about 16% in the first quarter, totaling approximately $2.7 trillion.
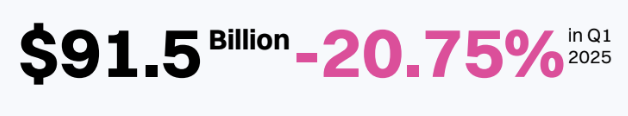
At the same time, the daily trading volume in the crypto market fell by about 20% in the first quarter, totaling around $90 billion.
Total market cap down 16.2%; liquidity weakened
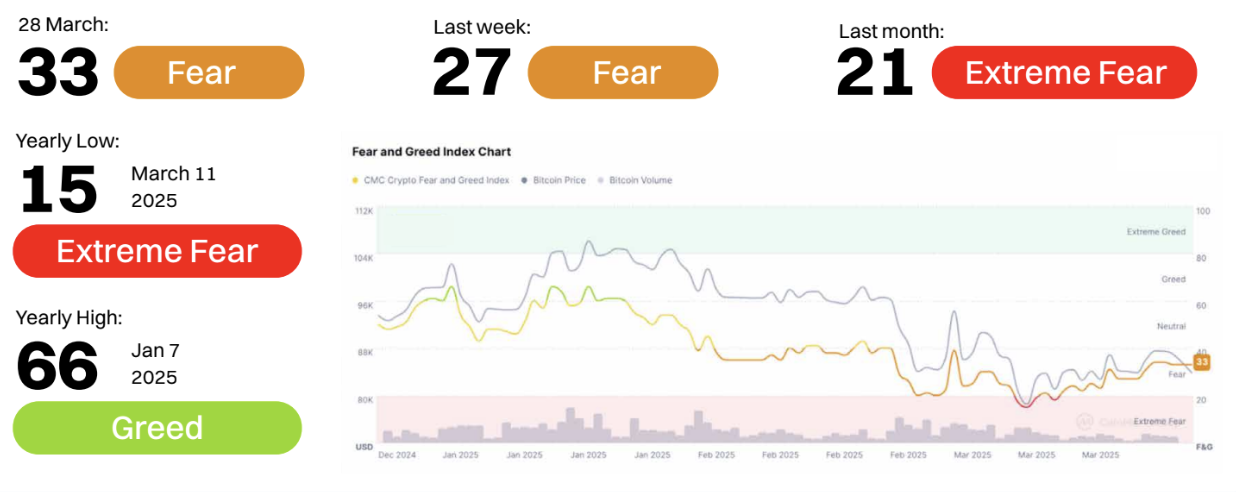
Q1 2025: Fear dominates, panic significant
Sentiment Trends: Q1 2025
Early March: Despite Bitcoin's price climbing to a local high, breaking $84,000, market sentiment sharply declined into the "extreme fear" zone, hitting a low of 15 points.
Mid to late March: Although Bitcoin's price and trading volume showed some resilience, market sentiment barely recovered, lingering between 21–33, still in the "fear" range. Even with ETF inflows and an increase in Bitcoin's market cap share, overall market sentiment throughout the first quarter failed to enter the "neutral" or "greed" zones.
Key Insights:
Divergence between price and sentiment: Despite Bitcoin's price remaining relatively strong in the $78,000–$80,000 range, market sentiment was exceptionally negative, indicating a lack of trader confidence and potential expectations of a price correction.
Volatility and uncertainty dominate: High volatility (BTC volatility at 51.88, ETH volatility at 68.30), tightening liquidity, and declining interest in altcoins may be the main factors suppressing sentiment.
Is "extreme fear" an accumulation zone? Historically, "extreme fear" often signals a buying opportunity. If macro sentiment improves, the low on March 11 may be viewed as such a moment.
Despite Bitcoin's relatively strong performance, Q1 2025 was still dominated by fear sentiment. Throughout the quarter, the Fear and Greed Index remained below 40, with investor confidence still fragile. Unless there are positive catalysts from the macroeconomic or regulatory front, the rotation of funds into risk assets like altcoins may remain limited in Q2.
Q1 2025: The winter of altcoins intensifies, Bitcoin season dominates the market
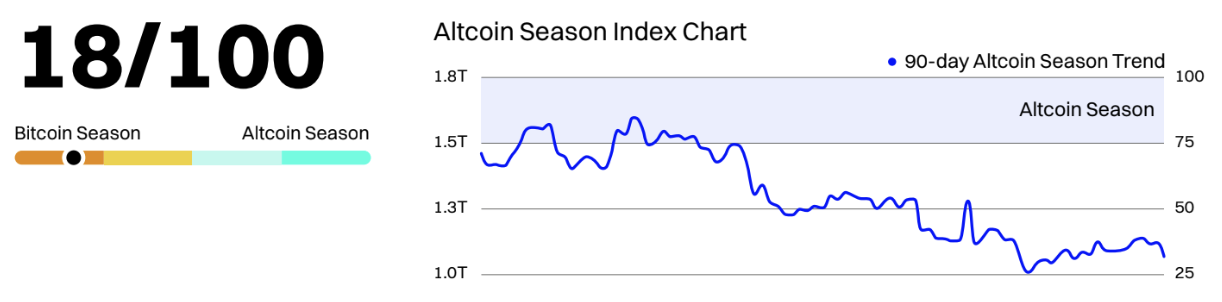
By the end of the first quarter, the CMC Altcoin Season Index was only 18, deeply entrenched in the "Bitcoin season" zone. Throughout March, this index remained below 25, hitting an annual low of 17 on March 12. This trend indicates a significant preference for Bitcoin in the market, while altcoins generally performed poorly amid risk aversion and macro uncertainty.
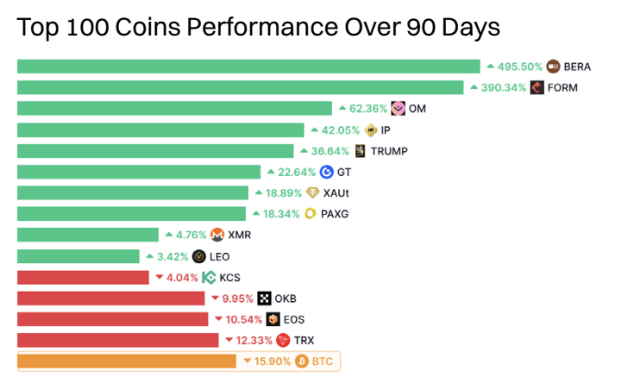
The chart of "Top 100 coins in the last 90 days" further supports this. Only a few altcoins saw strong gains, such as BERA (+745.98%), FORM (+447.06%), and PIP (+89.20%), which are rare exceptions. Most altcoins experienced double-digit declines: major altcoins like SOL (-31.55%), LINK (-34.71%), and TON (-30.09%) reflected the harshness of this cycle. Even traditionally resilient tokens like ETH (-6.02%) and BNB (-14.64%) struggled to maintain their ground.
Q2 2025 Outlook: Early signs of fund rotation?
Although Bitcoin's dominance remains high at 61%, the Altcoin Season Index has slightly rebounded from its March lows, indicating a potential early stage of fund rotation. With many altcoins severely oversold and Bitcoin approaching the psychological resistance level of $85,000, any stagnation or consolidation in Bitcoin could prompt traders to turn to bottom-fishing altcoins.
However, to truly ignite "altcoin season" in Q2, two conditions must be met: 1) Bitcoin's price remains stable (without severe corrections), and 2) macro or regulatory catalysts (such as the approval of Ethereum spot ETFs or successful L2 scaling). Watch for the relative rise of altcoin market cap compared to Bitcoin, as well as the Altcoin Season Index consistently breaking above 25 as leading indicators.
Q1 2025 Review: Bitcoin and Ethereum both decline—but Ethereum suffers more
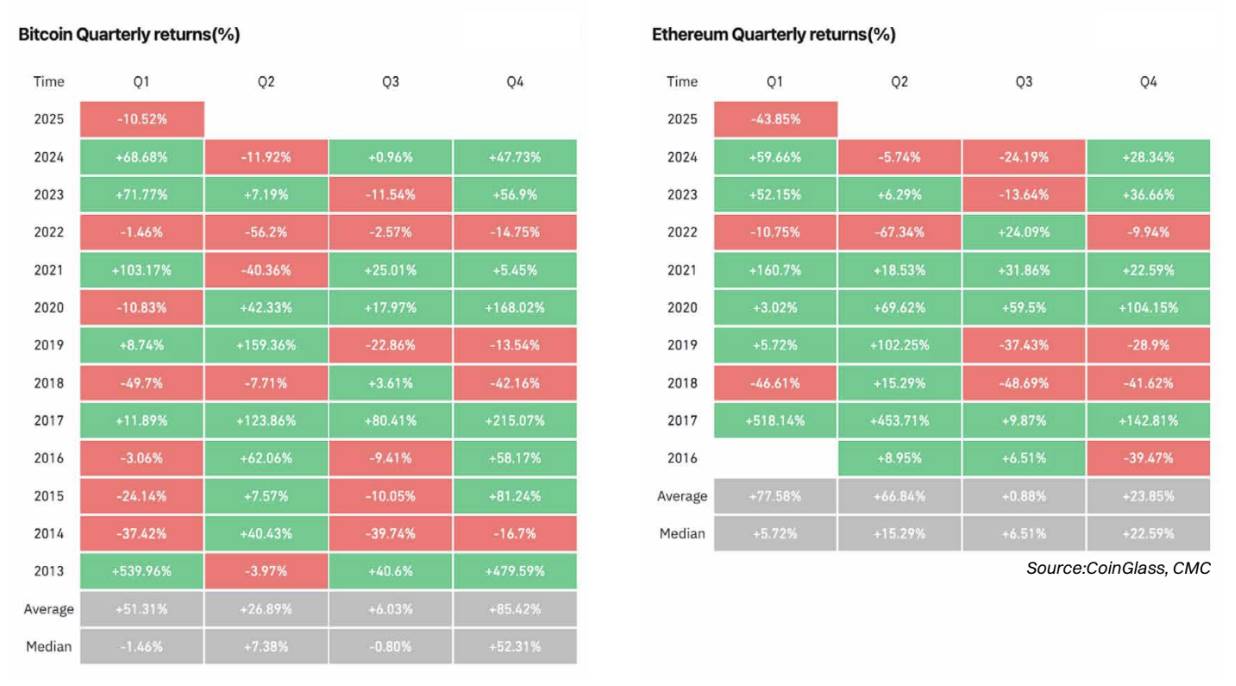
Bitcoin (BTC) fell 10.52% in Q1 2025, breaking its strong first-quarter performance in 2023 (+71.77%) and 2024 (+68.68%). Despite a strong performance in January (+9.29%), a sharp decline in February (-17.39%) erased those gains, and March failed to regain momentum. This pullback indicates an intensification of cautious sentiment in the market, driven by macro uncertainty, ETF saturation, and declining retail activity.
Ethereum (ETH) performed significantly worse, plummeting 43.85% in the first quarter—marking the largest quarterly decline since 2018. This correction followed an overheated rise at the end of 2024 and was influenced by high volatility, the unfortunate Bybit hack incident, and a lack of new growth narratives. This substantial underperformance relative to Bitcoin again reflects the sharp decline in the Altcoin Season Index and demonstrates why market capital has shifted to Bitcoin in search of relative safety.
Q2 2025 Outlook: Bitcoin resilience, Ethereum rebound potential?
Historically, Bitcoin tends to perform moderately in April (with a median return of +5.04%), but May and June are often weaker. If Bitcoin maintains its current support level above $80,000, a breakout may occur in Q2, especially if macro conditions (such as interest rate cuts or stablecoin demand) improve. Watch for ETF fund flows and volatility compression as early signs of bullish breakouts.
After the sell-off in Q1, Ethereum may be preparing for a relief rebound. The median return for Ethereum in Q2 is +15.29%, and its poor performance may attract rotating funds, particularly when narratives around Ethereum spot ETFs or Layer-2 growth return. However, technicals and market sentiment remain weak, so any upward movement will require Bitcoin's stability as a foundation.
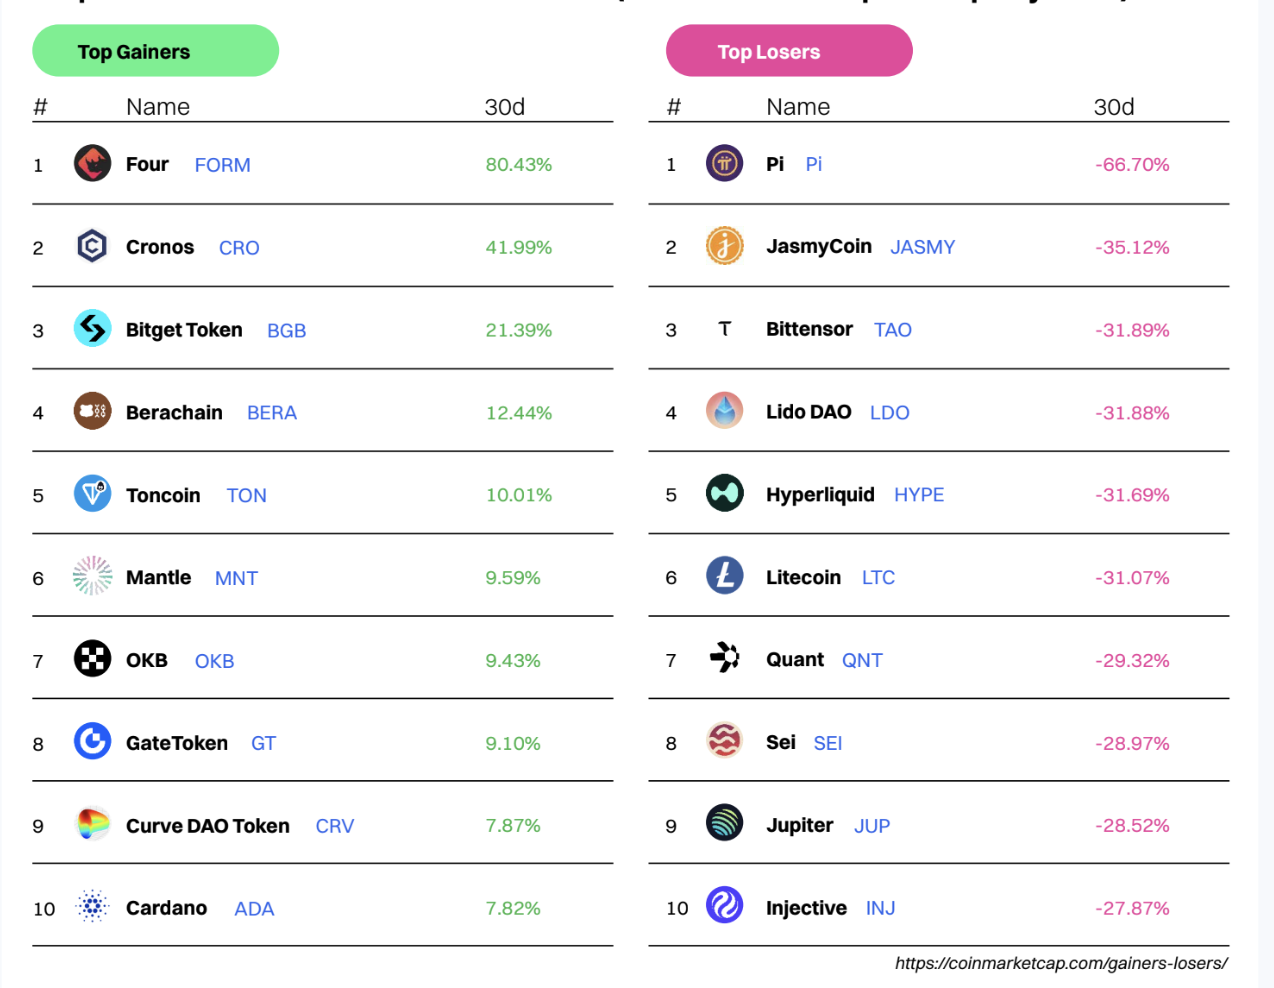
Projects with the largest gains/losses this month (based on CMC's top 100 projects)
Market Sentiment: Revealing CMC's Unique Data
CoinMarketCap is the world's most visited cryptocurrency website and the primary source for crypto data, insights, and community. By observing the general browsing patterns of our millions of users, we can detect emerging trends and changing priorities within the global crypto community.
In this section, we reveal exclusive CMC data covering:
Most popular CMC categories
Top coins in each category
Global CMC user distribution
Most popular coins in various regions
Most Popular CMC Sectors
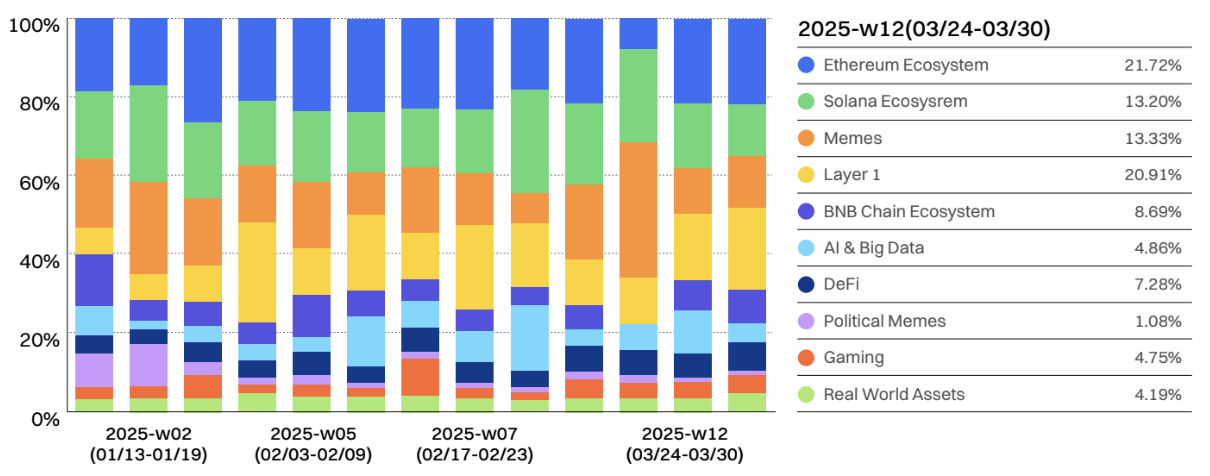
From hype to fundamentals: The focus of the crypto market shifts from Meme coins and AI to DeFi and Layer 1
At the beginning of 2025, there was intense speculative activity (Meme coins, AI, and hype-driven narratives), which then returned to infrastructure (BNB Chain, Solana, and DeFi) by the end of March. This indicates that after experiencing exciting periods, investors tend to return to proven ecosystems in search of sustainable opportunities.
Looking back at Q1 2025, we observed:
- Surge in Meme coins and Layer 1 (mid-January to February)
Market sentiment may have been influenced by high volatility (Bitcoin volatility at 51.88, Ethereum volatility at 68.30), tightening liquidity, and declining interest in altcoins. Historically, extreme fear often indicates accumulation opportunities. If macro sentiment improves, the low on March 11 may become such a moment in retrospect. Bitcoin's price remained relatively strong above $78,000 to $80,000, but market sentiment was extremely negative, indicating a lack of trader confidence and potential expectations of a reversal or correction.
- Peak of AI and Big Data (early February)
In week 5 (February 3 to 9), interest in AI and Big Data rose, possibly driven by a broader AI narrative in technology and crypto. However, this enthusiasm seemed to wane in the following weeks, indicating that AI's dominance in crypto discussions remains intermittent rather than sustained.
- Stability of Solana and Ethereum ecosystems
The Solana ecosystem remained strong, despite fluctuations in its relative share. The Ethereum ecosystem sparked significant discussion due to the Bybit ETH hack incident and ETH's poor performance, attracting a large number of page views.
- Real World Assets (RWA)—still struggling to attract attention
Despite ongoing discussions about Real World Assets (RWA) as a long-term growth area for crypto, its share remains below 5%, indicating that institutional adoption is still developing.
- End of March (Week 12)—returning to fundamentals?
By Week 12 (March 24 to 30), we observed strong growth in the BNB ecosystem (8.69%). Layer 1 (20.91%) solidified its dominance, indicating that the market may be shifting towards more fundamental crypto infrastructure rather than short-term hype cycles. Meme coins (13.33%) remain strong, showing that speculative interest still exists, but AI, gaming, and RWA continue to struggle in attracting significant sustained attention.
Hottest Coins in Each Sector
Top ten most关注ed coins under the trend category
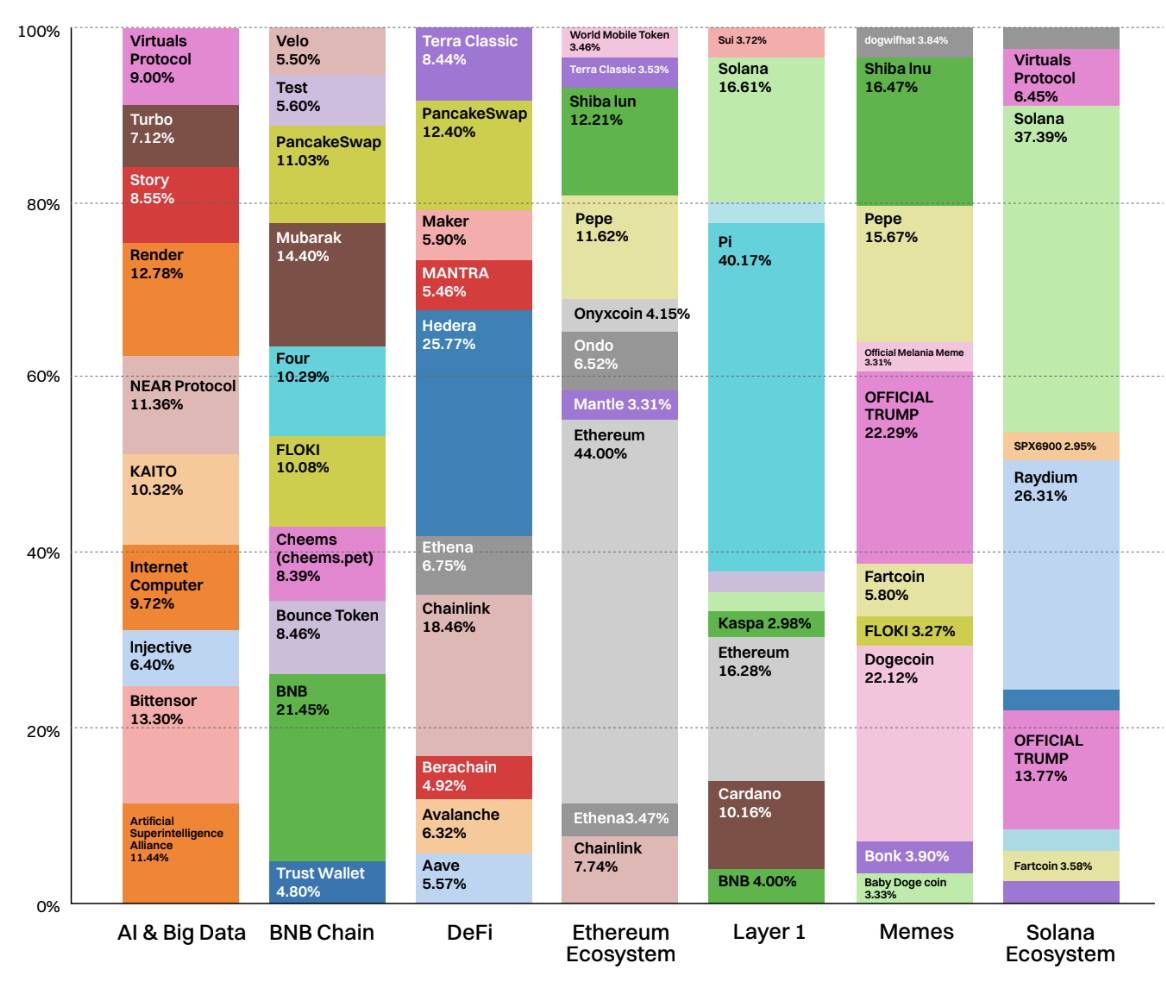
This chart highlights the top ten tokens with the most views in each popular area on CoinMarketCap, providing a snapshot of where user interest is concentrated. A notable trend is the surge in retail interest in the BNB Chain ecosystem, thanks to its diverse DeFi, infrastructure, and meme asset offerings, making it a growth narrative worth watching closely. BNB itself leads in this category, capturing 21.5% of total page views.
Following closely are meme-centric tokens like Mubarak (14.4%), FLOKI (10.1%), Cheems (8.4%), and Test (5.6%), which have enhanced the visibility of the ecosystem, indicating a combination of utility and community-driven hype.
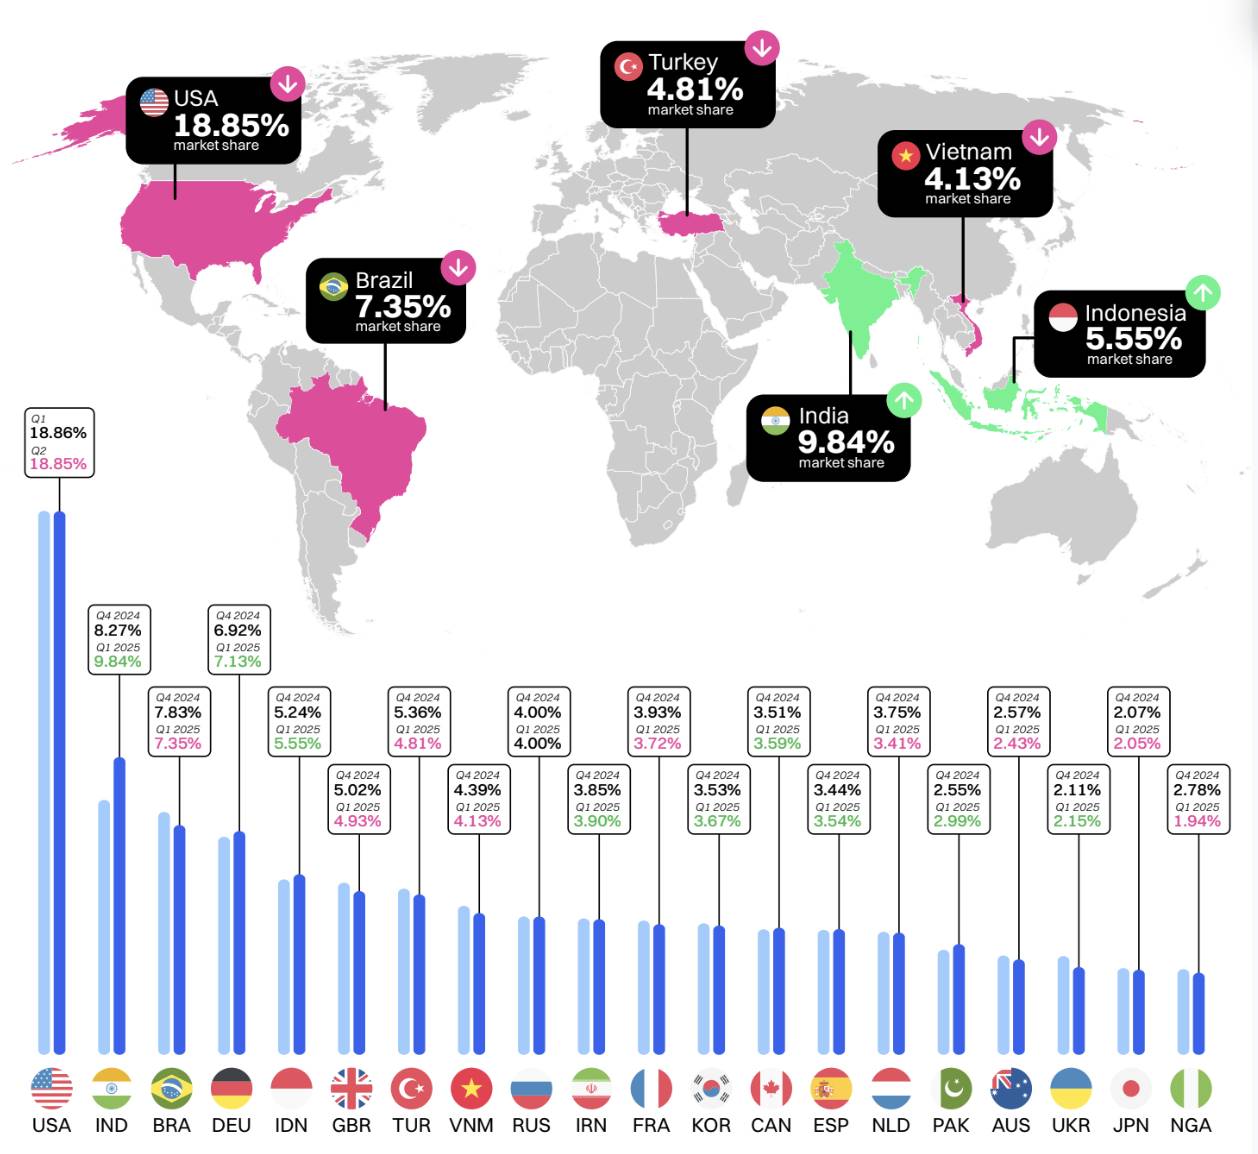
CMC User Distribution Worldwide
Between Q4 2024 and Q1 2025, the global distribution of crypto users remained relatively stable, with the United States maintaining the top position at about 18.8%. However, India has narrowed the gap, rising from 8.27% to 9.84%, driven by trends in AI agents and political memes.
The continued presence of emerging markets like Brazil, Indonesia, Vietnam, and Turkey indicates that cryptocurrency remains an attractive financial alternative in economically volatile countries. Overall, the trends in Q1 show a slight shift towards developing markets, further reinforcing cryptocurrency's role at the forefront of global decentralized finance.
Most Popular Coins by Region
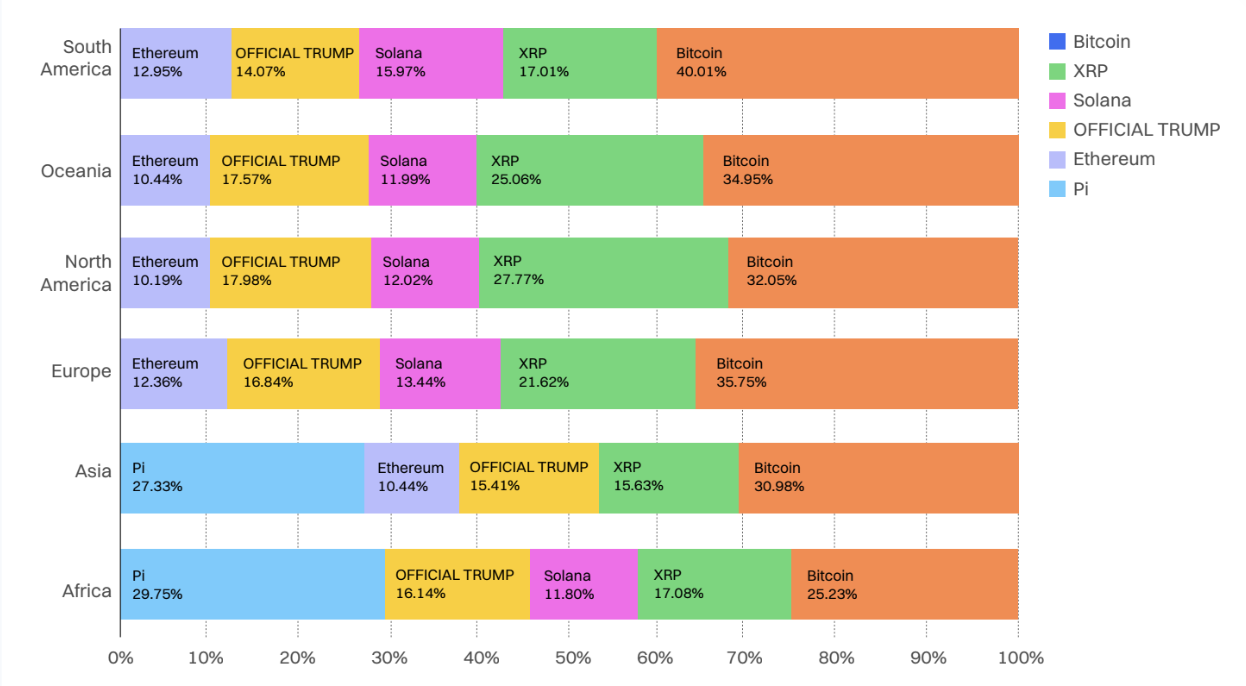
January 2025: Bitcoin leads in most regions, with OFFICIAL TRUMP surging in North America and Asia. XRP, Solana, and Ethereum remain stable, while emerging tokens like Dogecoin gain regional attention.
February 2025: Pi Network's popularity explodes, dominating in Asia (37.7%) and Africa (43%). Bitcoin remains the global leader, especially in the Americas and Oceania. XRP and Solana continue to perform strongly across all regions.
March 2025: OFFICIAL TRUMP makes a comeback in Western markets, particularly in North America and Oceania. Bitcoin maintains its global lead. Pi remains dominant in Asia and Africa, while XRP, Solana, and Ethereum continue to be core focal points.
Current Trends (March 2025): Bitcoin is the most viewed coin globally. Pi dominates in Asia and Africa, while XRP and Solana show strong cross-regional appeal. OFFICIAL TRUMP has a significant trend in the West but may be cooling off.
CMC Community Bullish/Bearish Sentiment Rankings
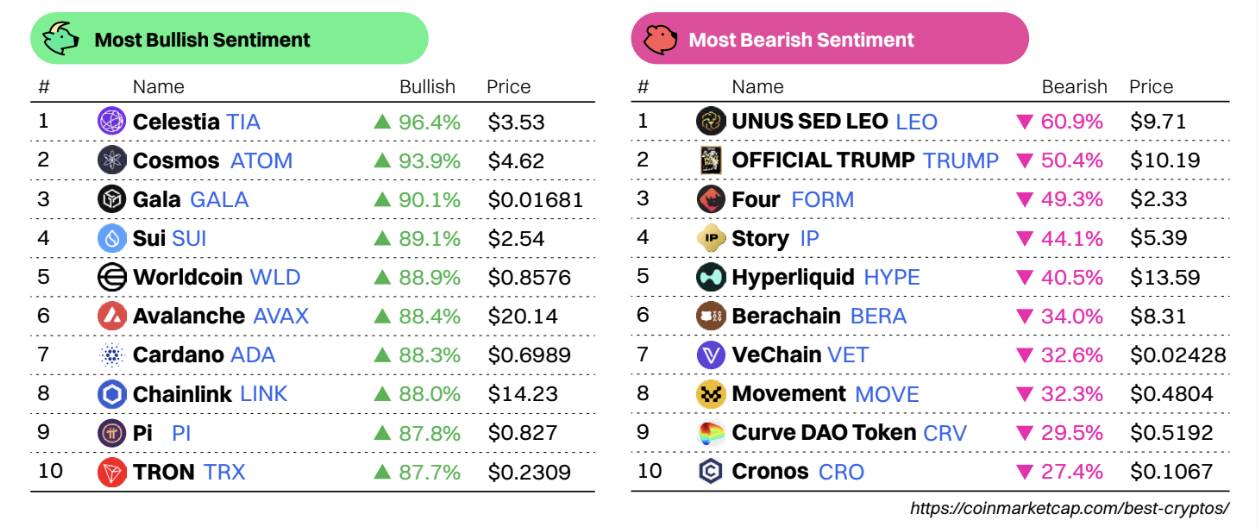
Despite price declines, optimism is still rising
Projects like Celestia (TIA), Cosmos (ATOM), Gala (GALA), and Sui (SUI) show exceptionally strong bullish sentiment (over 89%) within the CMC community, even though many have seen price drops of 5-10%. This indicates that the community views these declines as buying opportunities rather than weakness. Worldcoin (WLD) and Avalanche (AVAX) also stand out due to heightened optimism despite sharp price drops.
Bearish sentiment targets OFFICIAL TRUMP and Curve DAO (CRV)
OFFICIAL TRUMP continues to elicit extreme reactions within the community, ranking second in bearish sentiment (50.4%) and reappearing in the daily bearish trend, suggesting waning interest or disappointment. Meanwhile, CRV has the highest daily bearish trend (-17.2%), reflecting increasing skepticism about the price movements of DeFi blue chips.
Strong overlap between bullish and trending tokens
Tokens like Celestia, Cosmos, Gala, and TRON appear on both the "most bullish" and "daily bullish trend" lists, indicating not only heightened sentiment but also rapid ascension, potentially signaling a price reversal or narrative momentum.
Emerging narratives worth watching
The CMC daily bullish trend page is a useful tool for tracking tokens that are rapidly gaining bullish momentum—watch for these to potentially become the next narrative hotspots. Recent daily trends show astonishing strength in sentiment, hinting at a community revival or renewed interest in tech-intensive projects.
Summary
Despite price declines, sentiment around modular chains (Celestia), Layer 1 (SUI, AVAX), and community-driven projects (Pi, Gala) is warming up. At the same time, former hot tokens like OFFICIAL TRUMP and CRV are facing rising bearish sentiment, indicating that retail focus may be shifting towards fundamentals and long-term investments.
Market Pulse
Layer-1
Ethereum faces the largest losses in Q1 2025
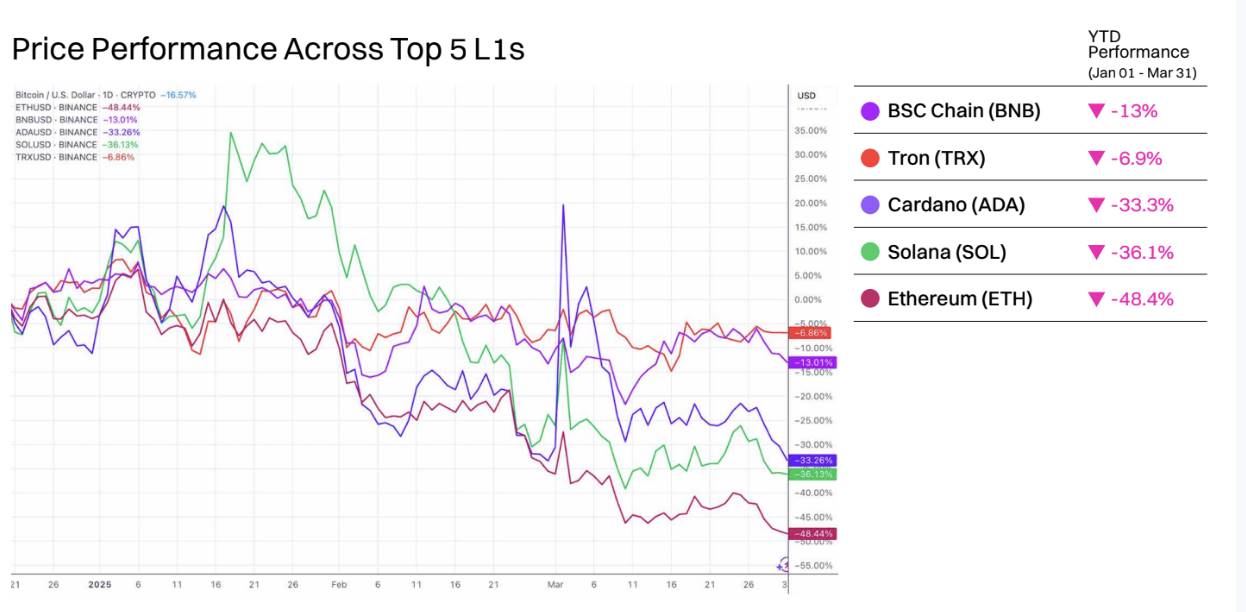
The top five Layer-1s by market cap have all seen declines year-to-date, with Ethereum (ETH) suffering the most severe drop at 48.4%.
BNB performed relatively well, only slightly down by 13%. This may be partly attributed to the recent success of on-chain meme coins, with several high-profile launches in Q1, including Tutorial (TUT) and CZ's Dog (BROCCOLI). The launch of a $100 million liquidity incentive program and the recent Pascal hard fork have boosted confidence in the chain.
Despite a weak market environment, TRX has also shown resilience. The chain has enabled zero-fee stablecoin trading, with its leadership seeking to capture market share from Ethereum. With the growth of on-chain DeFi revenue and plans for a tokenless fee upgrade and zero-fee meme coin trading set for 2025, Tron has largely resisted downward trends.
Cardano failed to maintain momentum after benefiting from excitement over incorporating native ADA assets into the U.S. digital asset reserve, dropping 33.3%. Solana experienced a sharp price decline due to a significant drop in meme coin trading volume and a large number of token unlocks, falling 36.1% year-to-date.
Ethereum faced multiple adverse events in Q1 2025, including the theft of approximately $1.5 billion in ETH and Ethereum-based tokens from the cryptocurrency exchange Bybit on February 21, most of which were laundered into Bitcoin (BTC). Additionally, outflows from popular ETH ETFs accelerated in Q1, with several weeks of sustained net outflows observed. In total, at least $240 million in ETH was withdrawn from ETH ETFs in Q1. The long-awaited Pectra update for Ethereum was also delayed due to preparation issues, now scheduled for deployment on the mainnet on April 30, 2025.
Daily Active Addresses of Major Layer-1s
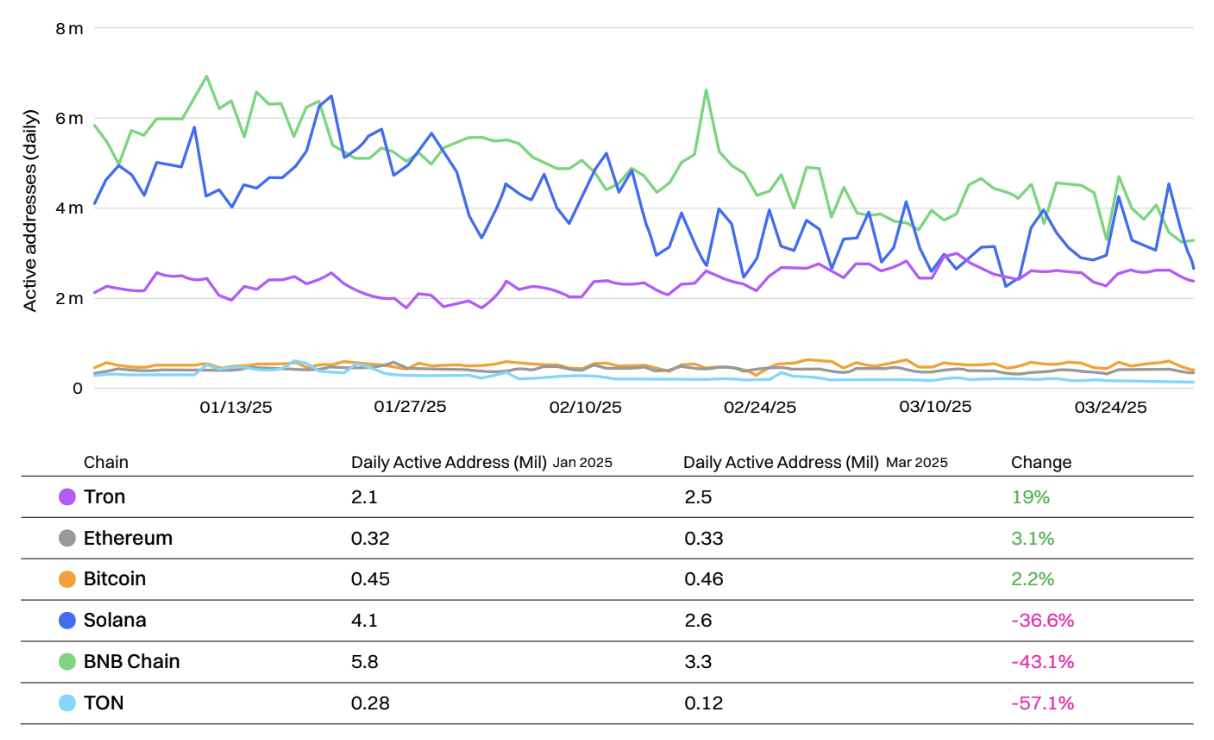
Many smaller Layer-1s saw a decline in on-chain activity in Q1 2025, which had started strong at the beginning of the year but began to slide from February.
In terms of absolute active daily addresses, the BNB chain performed strongly at the beginning of the year and led its competitors but was gradually overtaken by Solana—surpassing it by the end of March. The reduction in meme coin speculative activity on Solana and a brief outage in February may have contributed to this decline. The upcoming Firedancer upgrade is still highly anticipated by users.
The BNB chain experienced a brief surge in on-chain activity in February, particularly around the release of the BNB Chain 2025 technical roadmap and the Pascal upgrade.
Bitcoin, TRON, and Ethereum successfully resisted downward trends, increasing active addresses year-to-date. Tron leads in this regard, with a 19% increase year-to-date, followed by Ethereum at 3.1%, and Bitcoin at 2.2%, despite all three assets experiencing value declines during the same period.
TON's on-chain active addresses dropped by over 50%, from 280,000 to 120,000, as most Telegram mini-apps lost users, and interest around farming projects also waned. The once most popular mini-app on the platform, Hamster Kombat, has lost nearly two-thirds of its active users year-to-date.
However, it is important to note that one address does not necessarily equate to one user. Blockchains with lower fees often have more on-chain bot activity and more addresses controlled by smart contracts, which may inflate the numbers.
Daily Transaction Activity of the Top Five Layer-1s
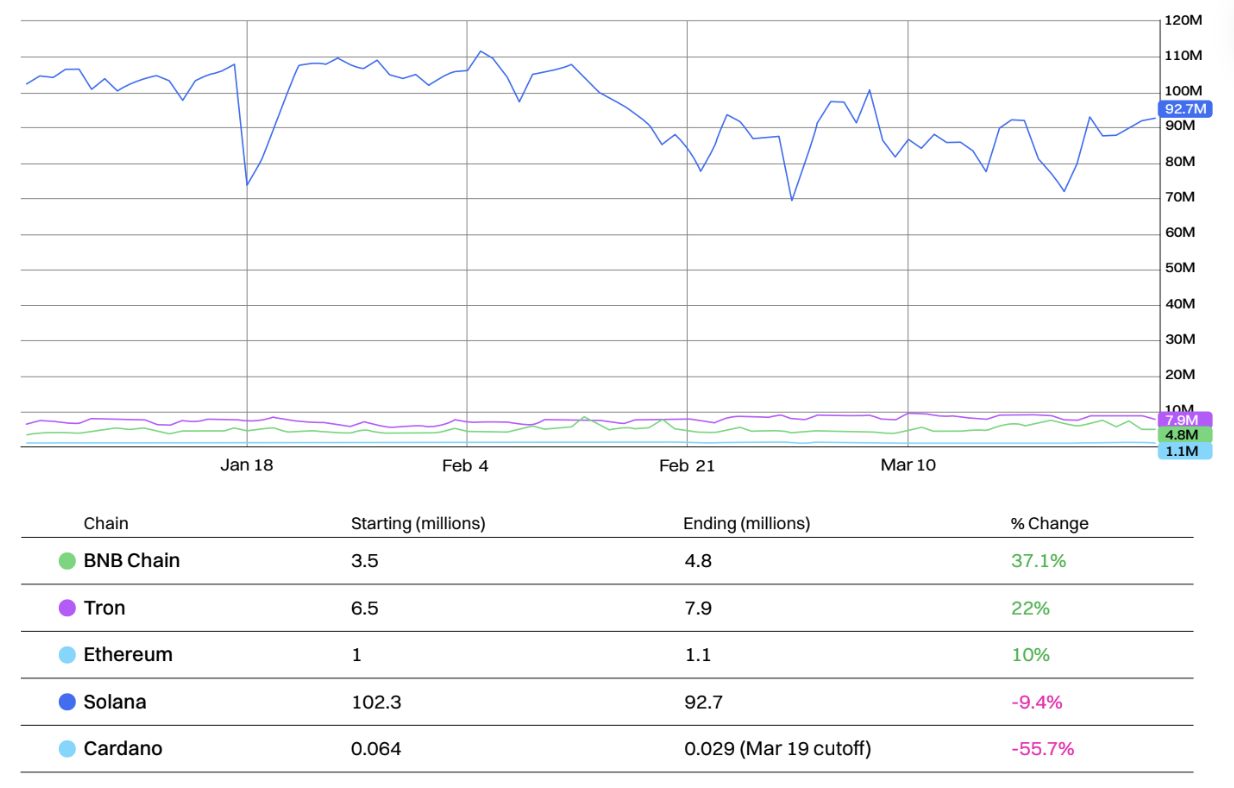
Solana continues to lead all other major Layer-1s in transaction volume, with a significant advantage. However, about 80% of the transactions are attributed to on-chain voting activities, with another large portion due to arbitrage bot activities.
Nonetheless, Solana's daily transaction count has decreased by 9.4% year-to-date.
In Q1, the BNB chain saw the largest increase in daily transaction count, growing by 37.1%, thanks to increased meme coin trading activity. Tron followed closely with a 22% increase, related to the recent uptick in stablecoin activity.
Cardano experienced the largest decline at 55.7%. Cardano now has the largest transaction count to market cap ratio among any major Layer-1, at 0.00000118.
Notably, Ethereum's transaction count grew by 10%, as DeFi activity continued to drive on-chain engagement.
Layer-2
All major Layer-2s saw a decline in TVL in Q1
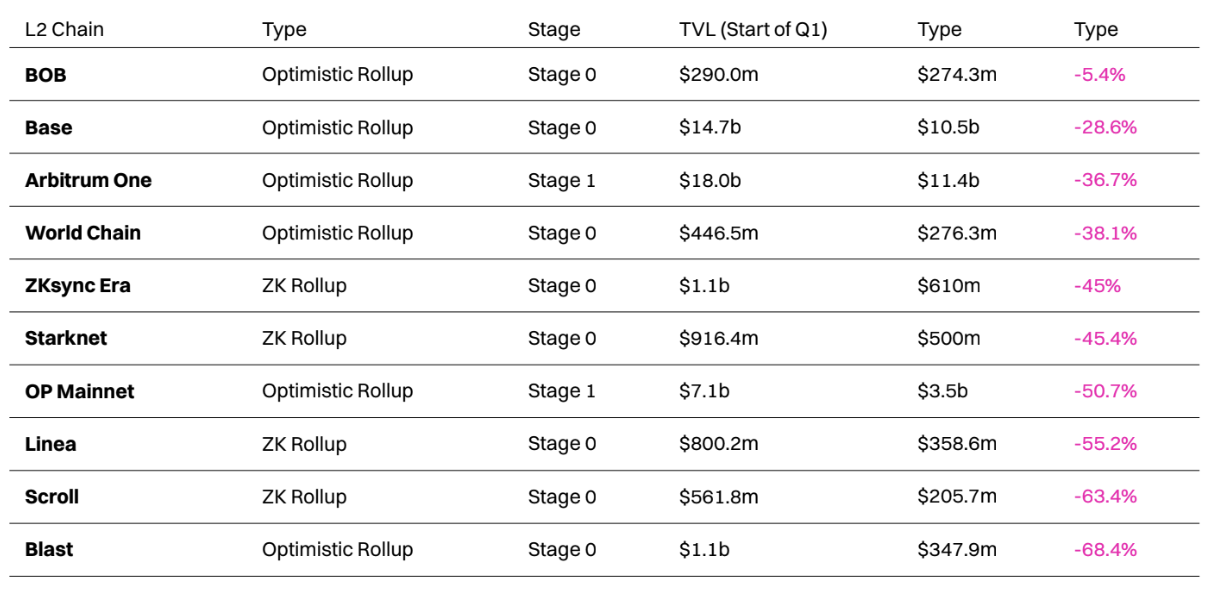
In the first quarter, the top ten Layer-2s ranked by TVL (Total Value Locked) all experienced declines, with BOB performing well with only a 5.4% loss in TVL. This is partly attributed to the success of the on-chain decentralized money market Euler.
Blast saw the most significant decline in TVL, dropping from $1.1 billion to just $348 million, a decrease of 68.4%. This may be due to sell-offs after airdrops and user attrition. At the same time, the platform faces greater pressure in the competition for ETH and stablecoin yields, accelerating its decline.
Despite a 36.7% drop, Arbitrum still maintains its position as the largest Layer-2, slightly ahead of Base (ranked second), which performed relatively well in Q1 with a 28.6% decrease in TVL. Arbitrum's decline occurred after the BoLD upgrade in February, which brought the platform closer to Stage 2 L2 status, while Base's integration of Coinbase Wrapped BTC (cbBTC) helped attract a new audience.
Optimism's TVL decreased by more than half but still holds the position of the third-largest Layer-2. This is despite the addition of several new Layer-2s to the Superchain, including Ink and Unichain.
World Chain surpassed Scroll to become the eighth-largest Layer-2, mainly due to Scroll's TVL plummeting by 63.4%. This decline followed the end of Scroll's "Session One" airdrop program, leading to waning interest in the Layer-2.
In Q1, many Layer-2s aimed to achieve Stage 1+ status by integrating complete and fully functional proof systems.
Comparison of the Top Five Layer-2s by TVL with Ethereum's Daily Active Addresses (Year-to-Date)
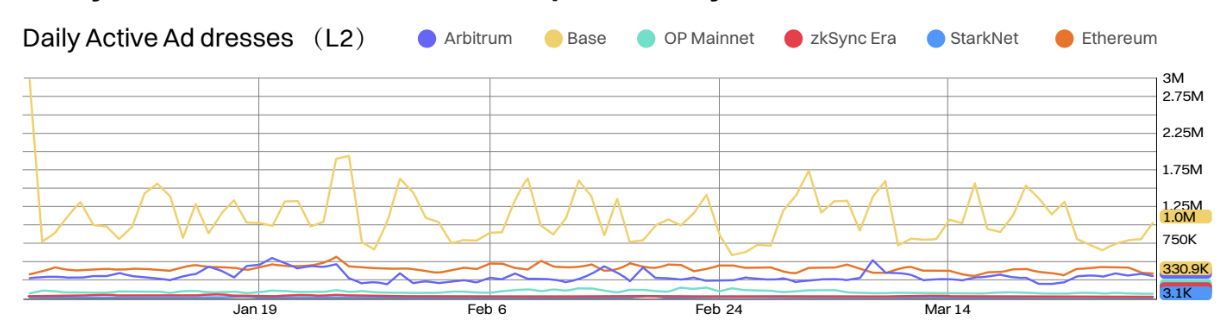
Base currently leads significantly in daily active addresses, being the only Layer-2 to maintain an undisputed lead in Q1 2025.
Base is the only Layer-2 that consistently exceeds Ethereum in the number of active addresses. Several new upgrades are in development, including Flashblocks and Appchains, which may further solidify its position as the most popular Layer-2.
Jesse Pollak, the head of Base, also hinted at the potential introduction of a tokenized version of Coinbase stock (SCOIN) on the Layer-2 network.
Arbitrum is the only other Layer-2 that temporarily surpassed Ethereum Layer-1 in the number of daily active addresses, with activity significantly increasing in early March—just after Robinhood listed the asset.
Base experienced the largest decline in active addresses, dropping two-thirds to reach 1 million daily active addresses, while zkSync Era's active addresses decreased by 29.6%.
Comparison of the Top Five Layer-2s by TVL with Ethereum's Daily Transaction Volume (Year-to-Date)
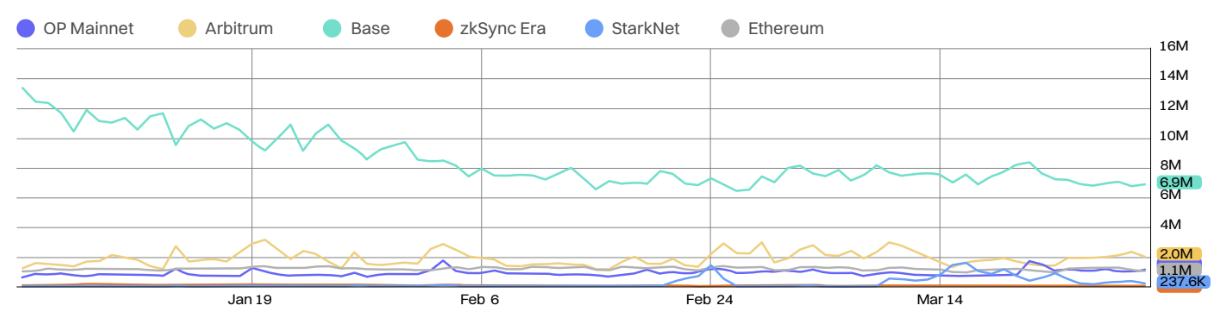
Base, Arbitrum, and Optimism are now consistently processing more daily transaction volumes than Ethereum Layer-1.
Base's daily transaction volume decreased from 13.4 million to 6.9 million in Q1, a decline of 48.5%. In comparison, zkSync Era and Starknet saw declines of 30.4% and 26.2%, respectively.
Despite claims that they are encroaching on Ethereum's base layer, most major Layer-2s have seen declines in daily transaction volume year-to-date.
Base maintains a clear lead in competition, with daily transaction volume stabilizing since mid-February.
Arbitrum successfully expanded its influence, increasing daily transaction volume from 1.3 million to 2 million, achieving a 54% increase in activity and narrowing the gap with Base. Optimism performed even better, with transaction volume growing by 65%.
Decentralized Finance (DeFi)
DeFi TVL (Year-to-Date)
Q3 DeFi TVL Market Share:
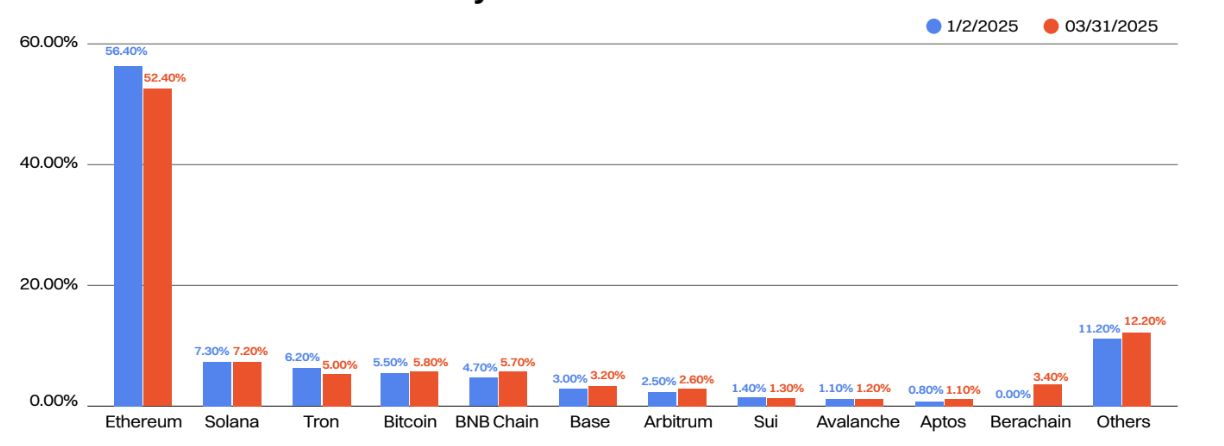
In Q3, Ethereum's DeFi TVL market share decreased by 4%, while smaller platforms like BNB Chain and Berachain captured market share.
Despite an increase in stablecoin trading volume, Tron's market share fell from 6.2% to 5%, making it the chain with the largest market share decline. In contrast, the newly launched Berachain captured 3.4% of the market share within two months of its February launch, thanks to its strong airdrop strategy and yield opportunities.
Bitcoin's TVL saw significant growth, reaching a market share of 5.8%, primarily driven by BTC liquid staking solutions like Lombard.
Comparison of the Top Five Layer-2s by TVL with Ethereum's Daily Active Addresses (Year-to-Date)
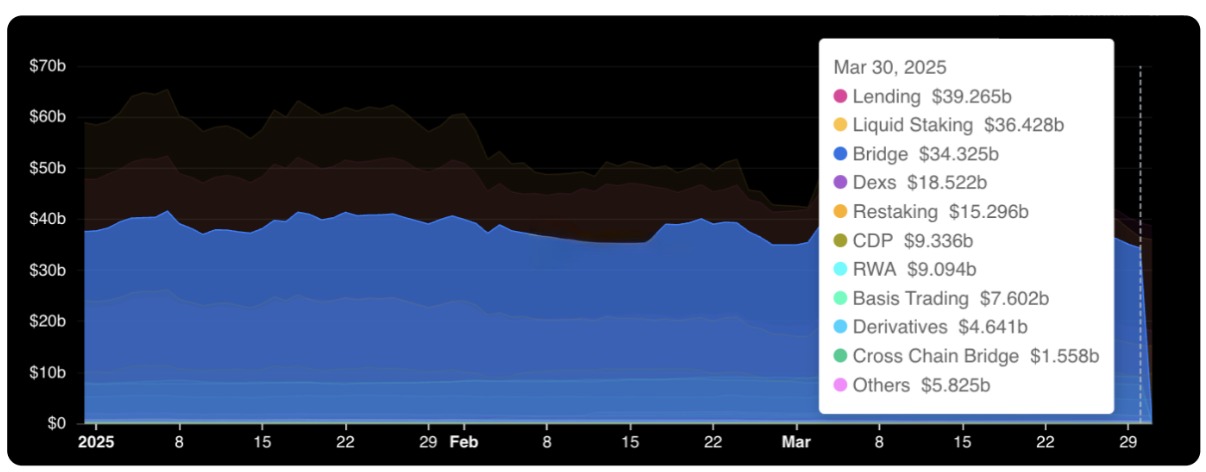
Lending is now the largest sector by TVL, with over $38.9 billion locked in on-chain lending platforms like Aave and Compound. The once-leading liquid staking solutions now follow closely behind, with a TVL of $36 billion, primarily dominated by major players like Lido, Jito, and Rocketpool.
Most sectors have seen absolute TVL declines year-to-date, with the physical assets (RWA) sector being a notable exception, experiencing growth in TVL due to the success of BlackRock's BUIDL products and Ethena's USDtb.
Top Ten DeFi Applications by TVL
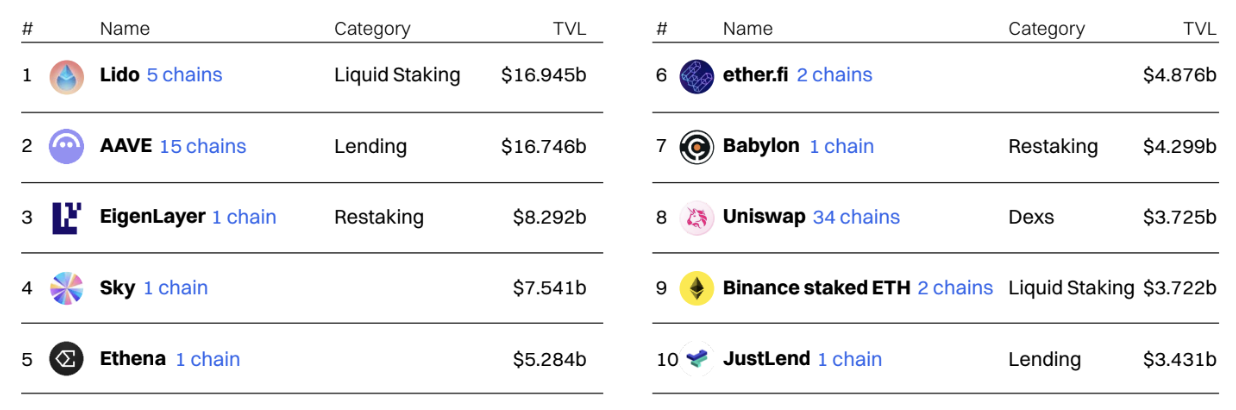
Lido, the Ethereum liquid staking protocol, maintains its position as the largest protocol but has been surpassed multiple times by AAVE in Q1.
Lido experienced several positive developments in Q1, including the approval of the new licensed SSV network module and further integration of its liquid staking tokens (stETH and wstETH) in DeFi.
Aave also saw positive developments, including the introduction of a liquid mode to enhance capital efficiency and expansion to the Celo network.
Cross-Chain
DeFi TVL (Year-to-Date)
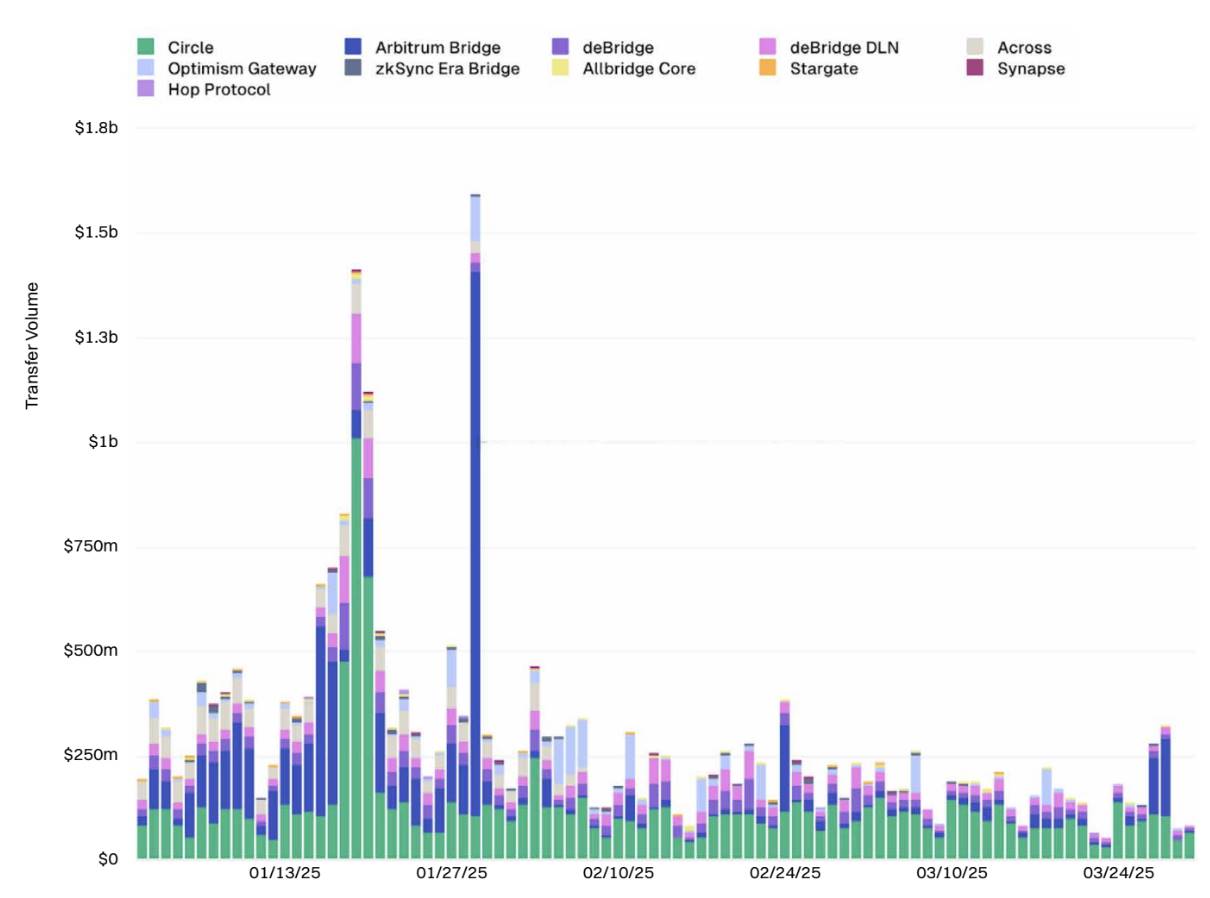
The cross-chain bridge space remains highly competitive, primarily dominated by three major players—Circle's CCIP, Arbitrum Bridge, and deBridge.
Cross-chain bridge transaction volume saw a significant decline between the beginning and end of Q1, with daily transaction volume dropping by over 60% during this period.
Some of the most important cross-chain bridge developments this year include the launch of Circle's CCTP V2, which introduced pegging mechanisms and faster USDC settlements, as well as integration with Stargate.
Real World Assets (RWA)
Stablecoin Market Cap Grows 8.6%: Counter-Cyclical Expansion and Compliance Challenges
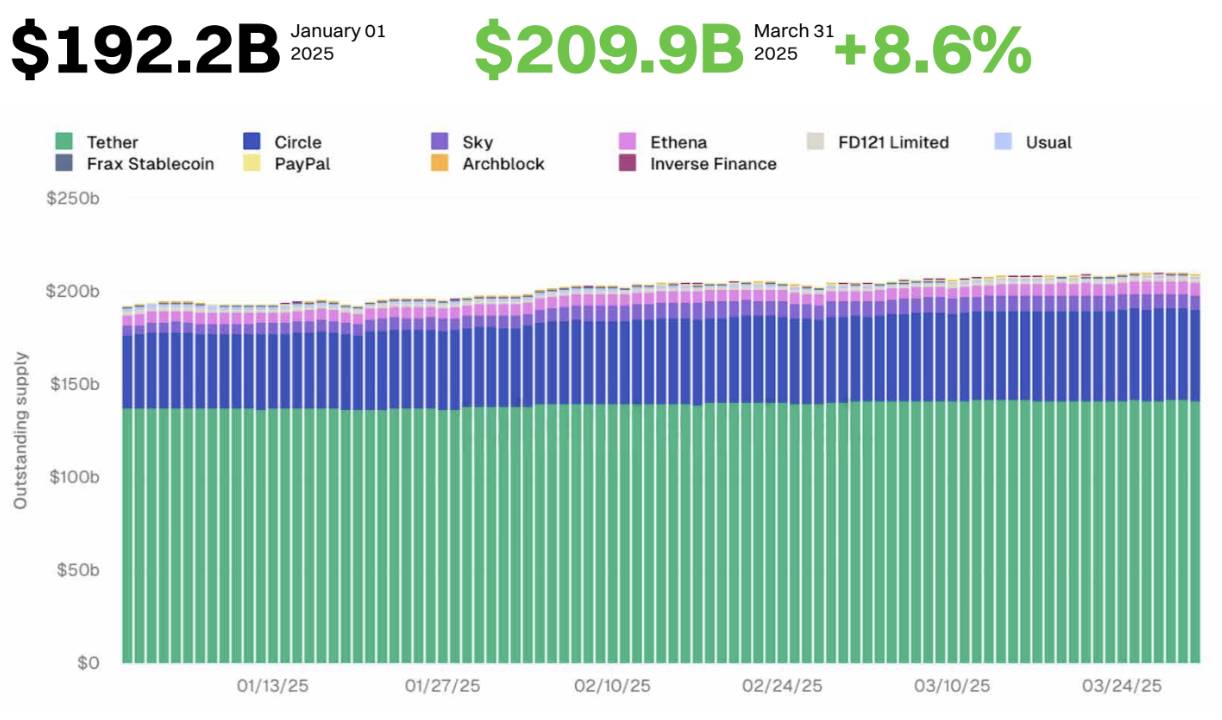
Despite market turbulence, the stablecoin industry has continued to expand in 2025, with a market cap growth of 8.6%.
Currently, the total market cap of the top ten stablecoin issuers has reached $209.9 billion, occasionally surpassing $210 billion.
Tether remains the largest stablecoin issuer in 2025, but its market share has decreased from 72.4% to 67.3%. Meanwhile, Circle's USDC market share has expanded from 19.8% to 23.4%.
In 2025, several cryptocurrency exchanges delisted Tether (USDT) to comply with the EU's Markets in Crypto-Assets (MiCA) regulations. In contrast, USDC has received regulatory approval, including licensing under the EU's MiCA framework.
Ethena also expanded its stablecoin market share in Q1 2025, thanks to the success of USDtb—a stablecoin launched in December 2024, primarily supported by BlackRock's BUIDL fund and reinforced through strategic partnerships and the launch of a Telegram-based payment application.
In terms of quarterly changes, Usual's USDO supply saw the largest decline, reducing by 46.7%. Paypal's PyUSD, on the other hand, experienced the most significant growth, with supply more than doubling over the past three months.
Stablecoins continue to drive much on-chain activity, with users utilizing them for cross-border settlements, earning DeFi yields, and trading on decentralized exchanges.
Adjusted Stablecoin Transfer Volume Hits All-Time High: Strong Market Demand Growth
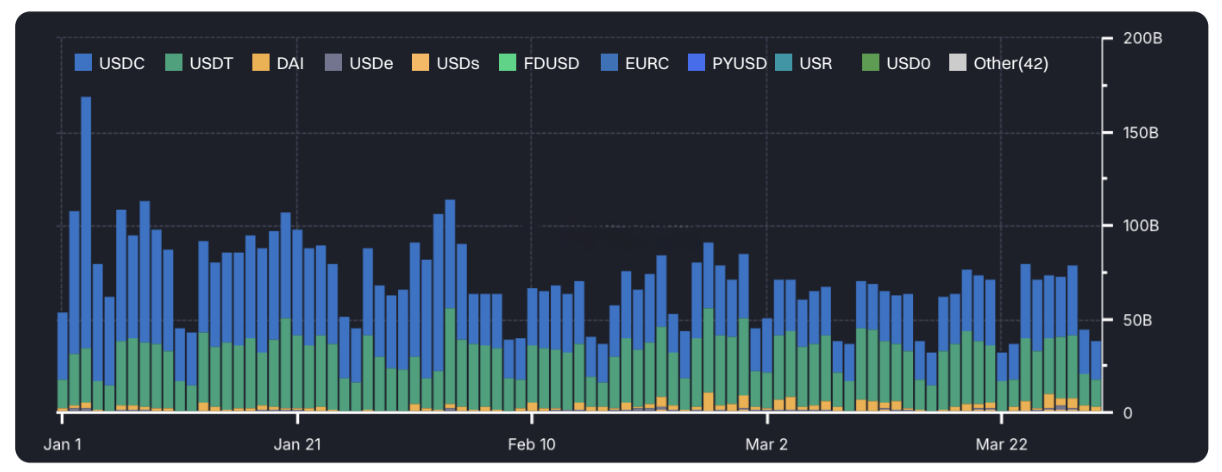
Stablecoin transfer volume continued to grow in Q1 2025, reaching an all-time high in January.
According to Artemis data, USDT and USDC remain the most frequently transferred dollar stablecoins, excluding ME activities and internal transfers within centralized exchanges.
Daily stablecoin transfer volume now regularly exceeds $72 billion, more than doubling compared to last year.
Ethereum remains the most popular chain for issuing stablecoins, holding a 55.8% market share, which has remained relatively stable year-to-date.
Meanwhile, Solana's stablecoin supply has grown by 140% year-to-date, with market share increasing from 2.7% to 5.5%, primarily due to the expansion of USDC on that chain.
Despite a significant reduction in USDD token supply, Tron's stablecoin supply still reached a historic high of $66.2 billion.
BlackRock's BUIDL Fund Further Leads
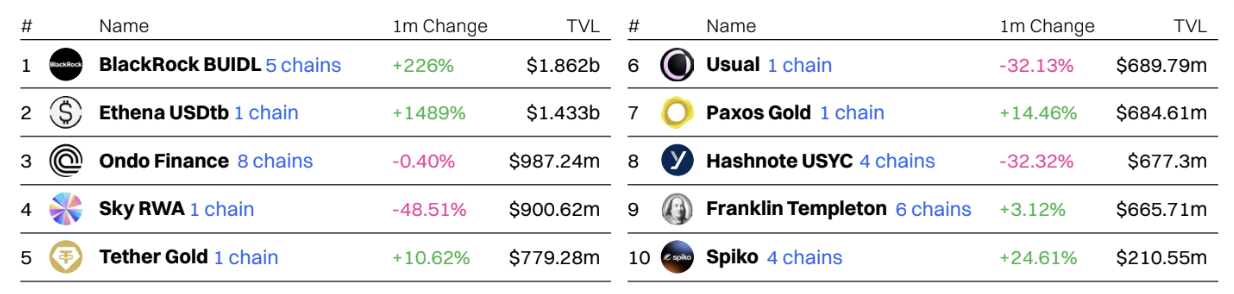
BlackRock's dollar institutional digital liquidity fund (BUIDL) is now the largest RWA protocol, with its TVL exceeding $1.8 billion at the end of the first quarter.
The second largest is Ethena's USDtb—a dollar stablecoin also supported by BlackRock's BUIDL.
Several on-chain treasury issuers also saw their TVL increase in the first quarter, including Ondo Finance and Sky RWA. Ondo's USDY token and Sky RWA's USDS stablecoin are both backed by U.S. Treasury bonds, with supply reaching an all-time high in the first quarter.
The expansion of these platforms demonstrates the growing market demand for low-risk yield instruments, including yield stablecoins.
AI Agents
Virtuals Protocol Weekly Revenue Plummets 97.5%
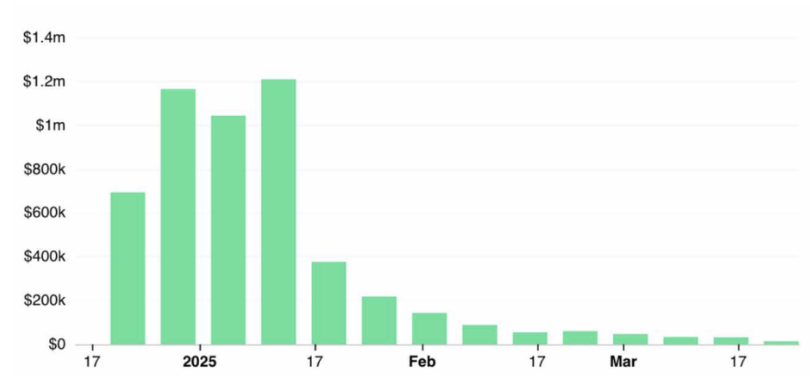
Despite a strong start in 2025, Virtuals Protocol gradually saw its on-chain weekly revenue collapse in the first quarter, dropping from a peak of $1.2 million in January to less than $30,000 per week for most of March.
Its expansion to Solana in February did not improve revenue, indicating a significant decrease in interest in on-chain AI agents.
Currently, Virtuals Protocol's 7-day revenue is approximately $22,100, having fallen out of the top 100 revenue-generating protocols.
Top AI Agent Market Capitalization Plummets
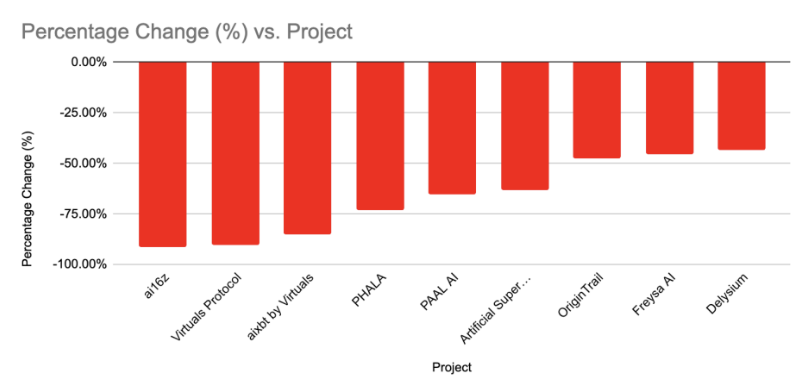
The market capitalization of top AI agent tokens has sharply declined year-to-date, with pure AI agent platforms/tokens suffering the most significant losses.
Among the top ten AI agent tokens by market capitalization, ai16z and Virtuals Protocol have lost over 90% of their value in less than three months.
On average, AI agent tokens have lost more than 67% of their value year-to-date, while the CoinMarketCap 100 index has seen a decline of 18.6%.
Meme Coins
Meme Coins Remain One of the Best Performers of the Year: Shining Among Mid to Large Market Caps
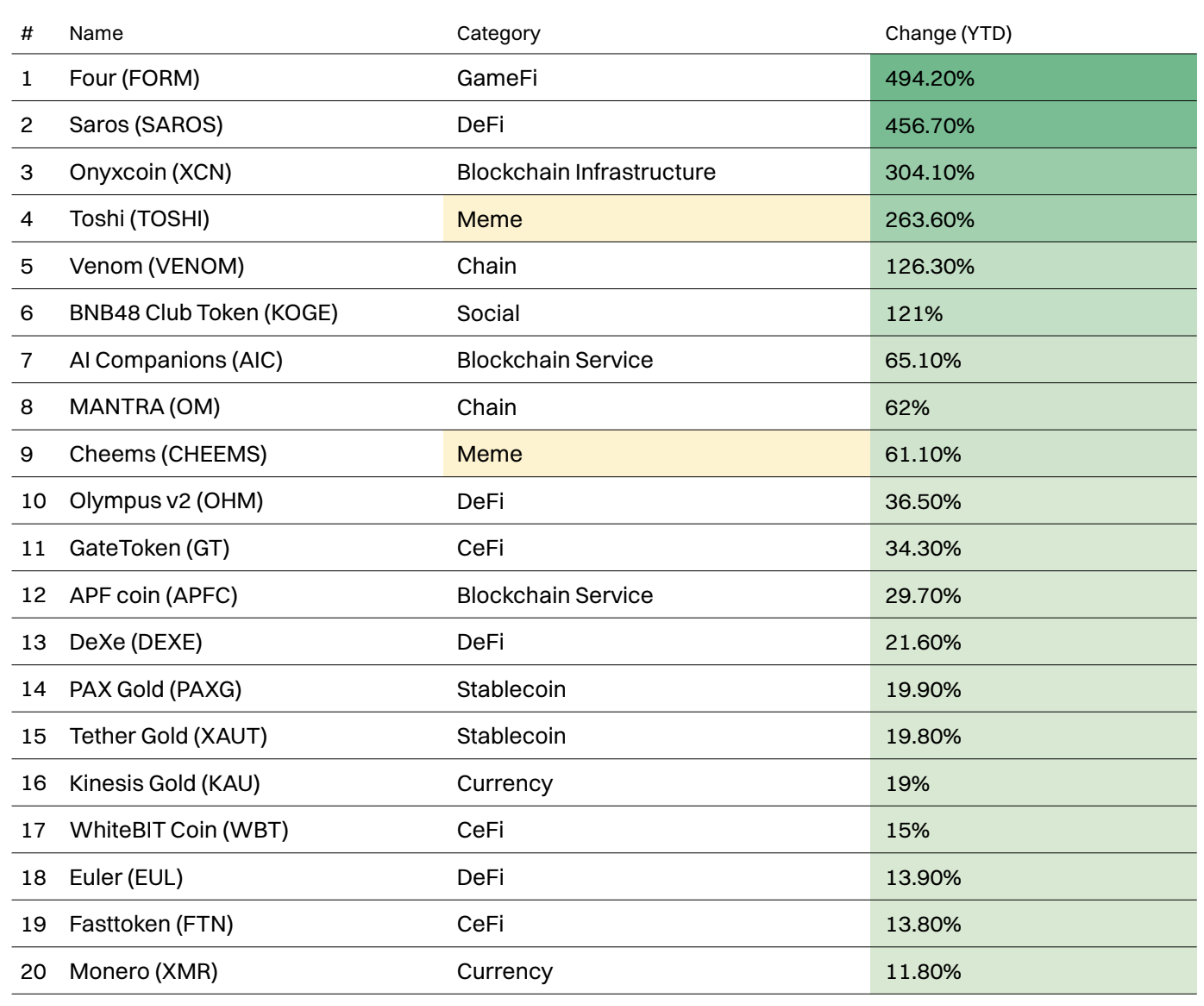
Last year, meme coins dominated the list of best-performing tokens by percentage growth. This year, they remain among the best performers in the mid to large market cap category, although their frequency has decreased.
Among projects with a market cap exceeding $100 million, only two meme coins made it into the top 20 best performers.
Among them, Toshi (TOSHI) is the best-performing large-cap meme coin this year, with a growth of 263.6%.
Worst Performing Meme Coins of the Year
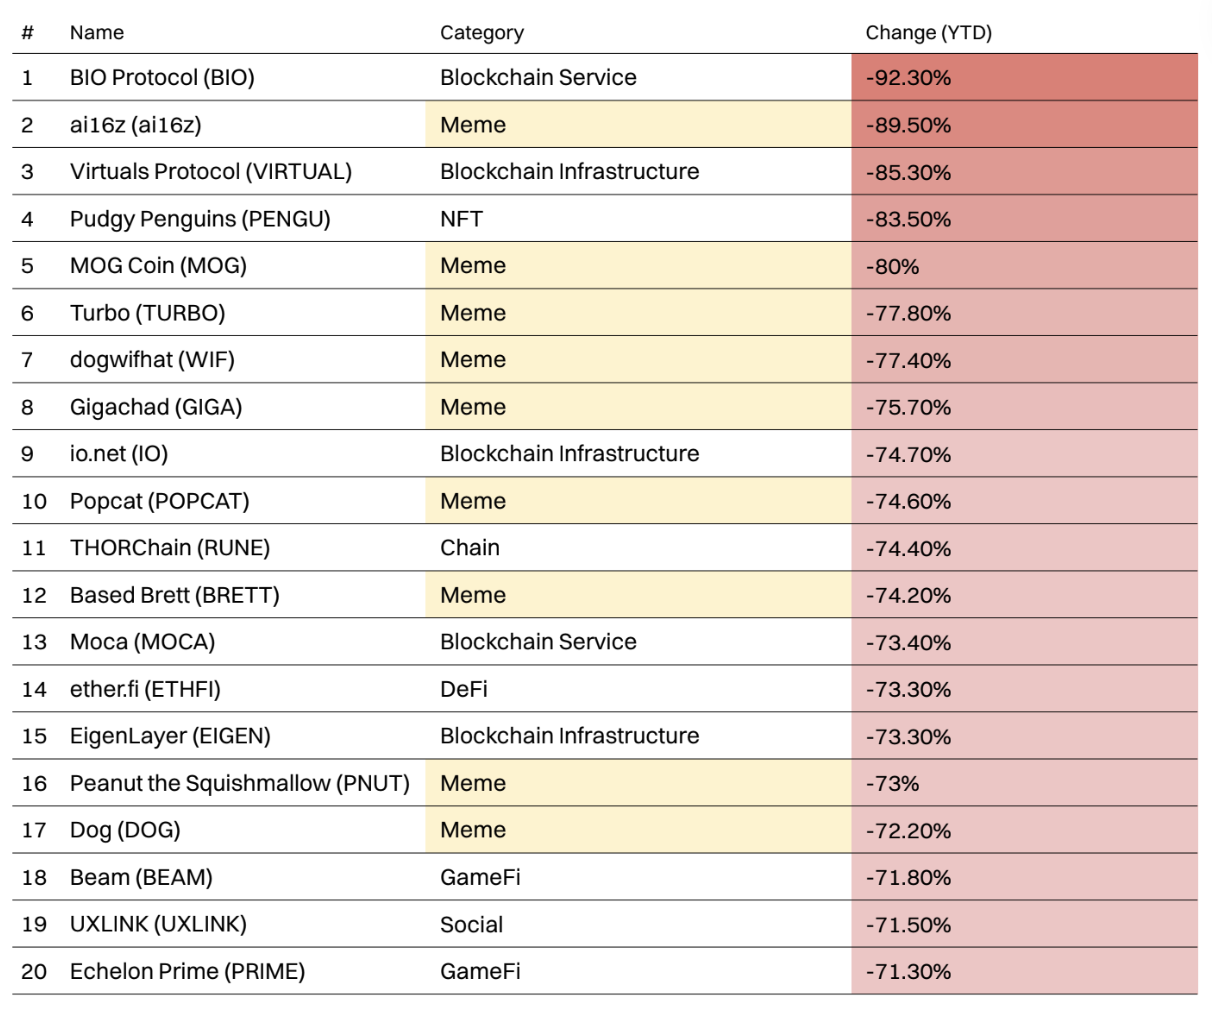
The first quarter was a tough period for the vast majority of cryptocurrencies, with 55 of the top 100 cryptocurrencies experiencing declines year-to-date, with the most affected losing over 25% of their value.
Despite the launch of several high-profile meme coins in January, including Official Trump (TRUMP) and Melania Meme (MELANIA), which attracted close attention from audiences and participants.
Meme coins dominated the list of worst performers, occupying 9 of the top 20 losers.
ai16z (Al16Z) is the worst-performing meme coin this year, having lost 89.5% of its value over the past three months.
Pump.fun Momentum Weakens, Still a Top Earner
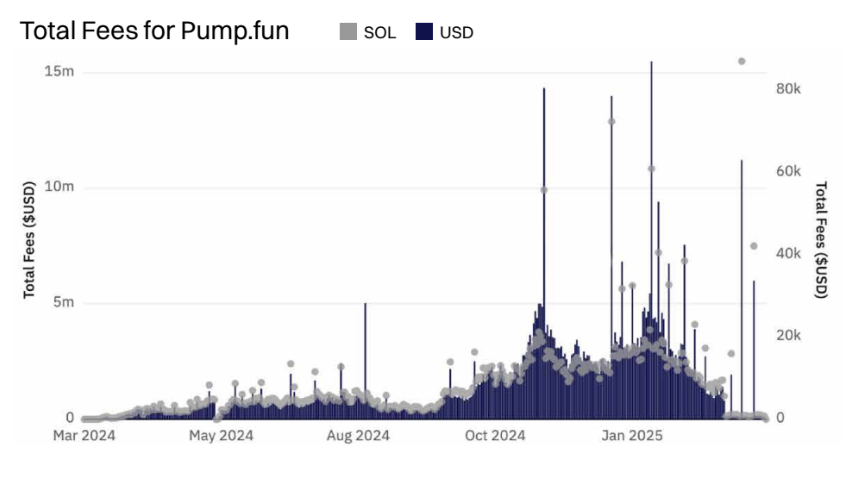
As enthusiasm for meme coins wanes, Pump.fun's revenue has significantly declined. The platform performed strongly at the beginning of the year, typically collecting over $3 million in fees daily, but by the end of March 2025, this figure gradually fell to less than $100,000 per day.
Despite a revenue decrease of about 98%, Pump.fun remains one of the most profitable decentralized applications, ranking in the top ten by weekly revenue.
Pump.fun Launch Volume Remains High, Graduation Rate Declines
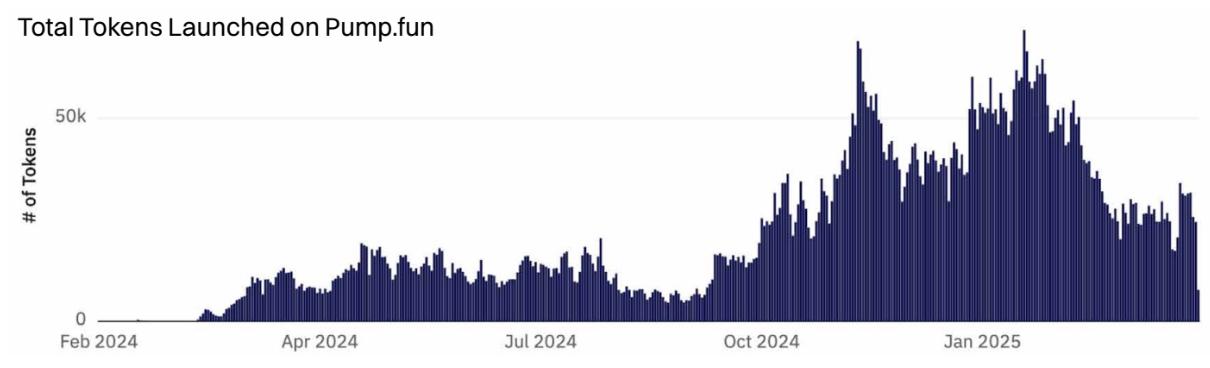
Pump.fun reached an all-time high on January 23, 2025, issuing over 71,700 tokens. Since then, the new issuance has decreased, averaging 26,400 tokens issued daily during March.
Although the issuance remains high, the proportion meeting graduation standards has significantly declined, dropping from 1.1% year-to-date to 0.64%.
The success of Pump.fun has also spawned numerous clone projects, including Raydium's LaunchLab, which offers flexible bonding curves, and the clone PumpTires built for the Pulsechain ecosystem, but none have managed to replicate Pump.fun's success.
Despite several major updates to the platform, including the launch of the PumpSwap decentralized exchange (DEX) and plans to enable creator revenue sharing, interest continues to decline.
免责声明:本文章仅代表作者个人观点,不代表本平台的立场和观点。本文章仅供信息分享,不构成对任何人的任何投资建议。用户与作者之间的任何争议,与本平台无关。如网页中刊载的文章或图片涉及侵权,请提供相关的权利证明和身份证明发送邮件到support@aicoin.com,本平台相关工作人员将会进行核查。


