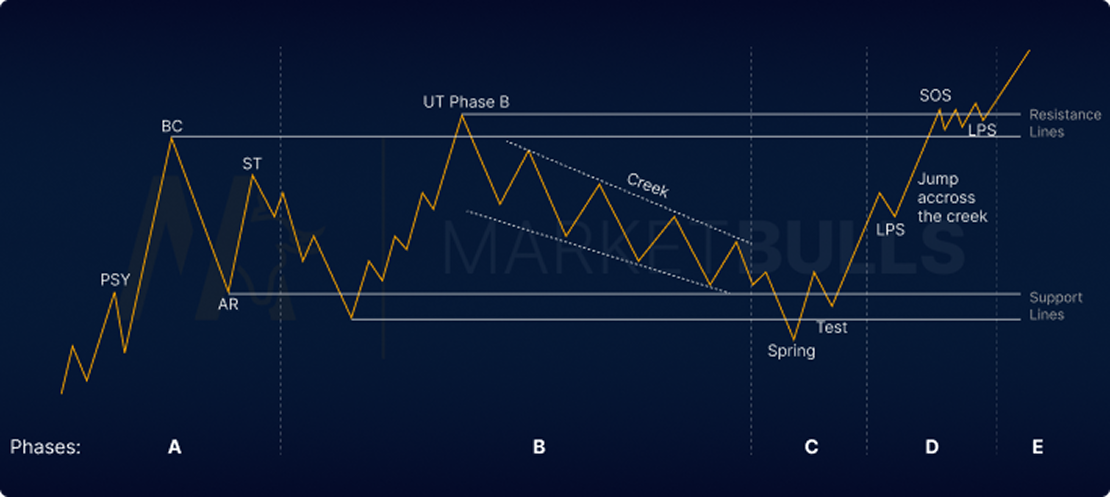
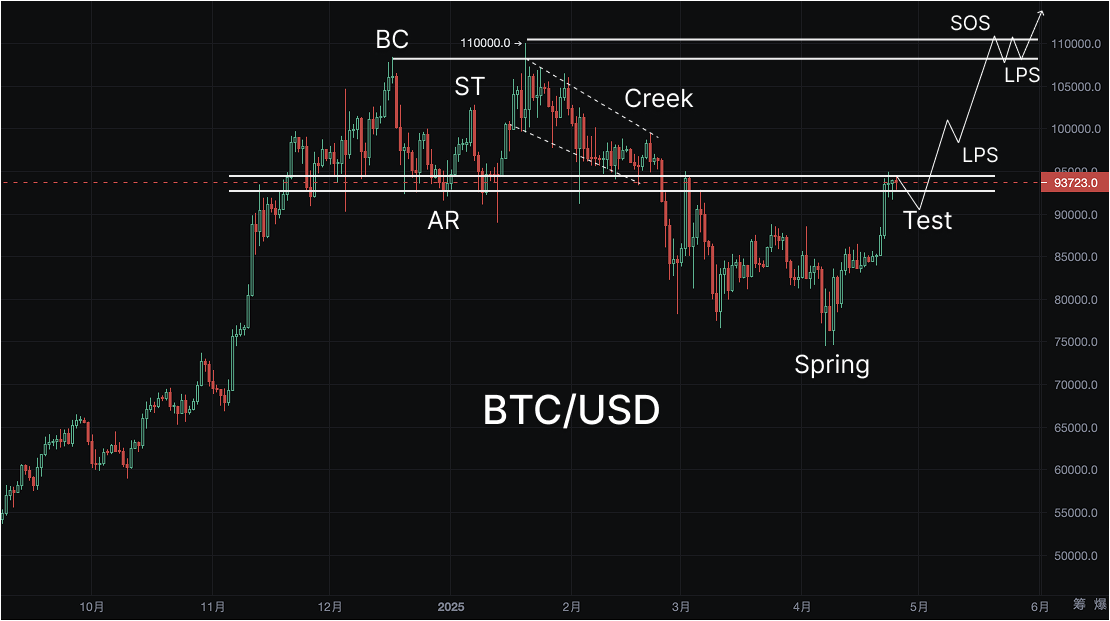
When we analyze Bitcoin's price movement from the perspective of Wyckoff's theory, we find that Bitcoin's movement almost perfectly aligns with the Wyckoff pattern.
In simple terms, the Wyckoff theory helps investors understand market behavior and trends by observing changes in market price and trading volume. It divides the market into several phases: the accumulation phase (where the market consolidates at low levels and smart money begins to buy), the markup phase (where the market starts to rise and sentiment becomes optimistic), the distribution phase (where prices reach a peak, funds begin to withdraw, and the market enters a consolidation), and the markdown phase (where prices fall and market sentiment turns pessimistic). The core of Wyckoff's theory is the supply and demand relationship—when demand exceeds supply, prices rise; conversely, they fall. By analyzing these phases, investors can identify market turning points, seize buying and selling opportunities, and thus improve their investment success rate.

Wyckoff divides market price movements into different phases and illustrates them according to market cycles. Its structure includes:
- BC (Background Accumulation)
- AR (Automatic Rally)
- ST (Short-term Target)
- Creek (Transition Zone)
- Spring (Spring Phase)
- Test (Testing Phase)
- SOS (Sign of Strength)
- LPS (Last Point of Support)

Based on the Bitcoin price movement in the chart and in conjunction with Wyckoff's theory, we can analyze the current price structure as follows. Wyckoff's analytical method mainly focuses on the different phases of the market, including the accumulation phase, markup phase, distribution phase, and markdown phase, each of which forms specific price behaviors and trading volume characteristics.
Wyckoff's Phase Analysis
Accumulation Phase (BC)
From November 2024 to early 2025, Bitcoin's price broke through $100,000 and entered a consolidation phase, which may correspond to Wyckoff's accumulation phase (Accumulation), namely BC (Background Accumulation). During this period, the market exhibited relative sluggishness and consolidation, with investors primarily absorbing Bitcoin in the bottom region to accumulate enough buying power for future price breakthroughs.
During this time, the market's trading volume was low, and price movements were minimal, but investor sentiment gradually recovered, and the market began to accumulate funds, laying the foundation for subsequent price increases.
Automatic Rally (AR) and Transition Zone (Creek)
As the price broke through the previous consolidation range, Bitcoin began to experience an automatic rally (AR) and gradually entered the transition zone (Creek). At this point, the market saw a short-term price rebound, breaking through the previous resistance level (around $90,000) and entering a higher price range.
During this phase, Bitcoin oscillated between $90,000 and $105,000, with the market testing the effectiveness of the new support level after the breakout.
Spring Phase (Spring)
In April 2025, Bitcoin's price began to reverse, breaking through the range of $75,000 to $90,000, quickly rising and approaching $93,000. This surge aligns with the Spring phase in Wyckoff's theory, which is typically a market reversal point, indicating that previous resistance has been broken and paving the way for subsequent increases.
During this phase, Bitcoin's price exhibited strong upward momentum, with increasing market demand, leading to a rapid price rise.
Testing Phase (Test)
Currently, Bitcoin is in the Test phase, where the market is testing the effectiveness of the previous breakout area. As the price approaches $93,000, this becomes a key technical testing point. If Bitcoin can effectively break through and stabilize above this level, the market's upward trend will be confirmed, entering the subsequent strong upward phase. If the price fails to break through this range, it may retrace and retest the $90,000 support level, with the market continuing to consolidate.
Sign of Strength (SOS) and Last Point of Support (LPS)
If Bitcoin can break through the resistance level of $93,000 and maintain stability in this area, the market will enter the Sign of Strength (SOS) phase, showing stronger upward momentum. During this phase, market sentiment will further improve, with funds flowing into Bitcoin at an accelerated pace, and prices may rise towards $100,000 or even $110,000.
Comprehensive Analysis and Forecast
When Bitcoin's price broke through $86,000 and reached $93,000, the market was in a strong upward state, consistent with Wyckoff's Spring phase. Currently, Bitcoin is testing the support area after the breakout ($93,000 to $94,000 range).
In the short term, Bitcoin may oscillate around $93,000, and investors should pay attention to whether it can break through this range and stabilize above it. If it breaks through and maintains upward momentum, the target price may point towards $95,000 or even $100,000.
If the price retraces and falls below $90,000, the market may experience a pullback, returning to the support range of $85,000 to $87,000, and may subsequently re-enter a consolidation phase.
This article represents the author's personal views and does not reflect the stance or views of this platform. This article is for informational sharing only and does not constitute any investment advice to anyone.
Join our community to discuss this event
Official Telegram community: t.me/aicoincn
Chat room: Wealth Group
免责声明:本文章仅代表作者个人观点,不代表本平台的立场和观点。本文章仅供信息分享,不构成对任何人的任何投资建议。用户与作者之间的任何争议,与本平台无关。如网页中刊载的文章或图片涉及侵权,请提供相关的权利证明和身份证明发送邮件到support@aicoin.com,本平台相关工作人员将会进行核查。


