Original Title: "On-Chain Light in the Macro Fog: When Risk Aversion Meets Whale Frenzy, Is the True Value of Crypto Assets Being Reassessed? | WTR4.21"
Original Source: WTR Research Institute
Weekly Review
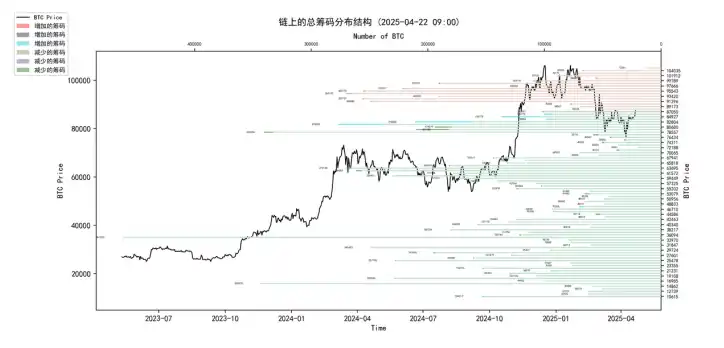
From April 14 to April 21 this week, the highest price of the ice sugar orange was around $88,465, and the lowest was close to $83,111, with a fluctuation range of about 6.44%. Observing the chip distribution chart, there is a large amount of chip trading around $80,000, which will provide certain support or pressure.
• Analysis:
60000-68000 approximately 1.59 million coins;
76000-89000 approximately 1.83 million coins;
90000-100000 approximately 1.96 million coins;
• The probability of not breaking below $70,000 to $75,000 in the short term is 80%;
• Among them, the probability of not breaking above $90,000 to $95,000 in the short term is 70%.
Important News
Economic News
The US dollar index is weak, continuously breaking below the 100, 99, and 98 thresholds.
Gold prices surged by 3% to $3,430 per ounce, with a cumulative increase of about 30% this year, setting 55 historical highs in the past 12 months.
Trump continues to pressure Powell: publicly criticizing Powell multiple times, calling him "too late" and "the main loser," believing that interest rates should have been lowered long ago, blaming Powell's slowness, and calling for "preemptive rate cuts." He attributes the decline in US stocks and recession risks to Powell's failure to cut rates.
Concerns about the independence of the Federal Reserve: Analysts believe that news of Trump replacing Powell is one of the triggers for recent market volatility, with the core concern being the market's worry about the loss of the Federal Reserve's independence.
Political pressure impact: An economics professor believes that while Trump may find it difficult to fire Powell, his public pressure will influence Federal Reserve decisions, making them aware that failing to cut rates during an economic recession will lead to public blame.
Expectations for rate cuts are heating up: The market is generally focused on and betting that the Federal Reserve may shift to an easing policy in June or during the summer. CME FedWatch shows a probability of about 75% for a rate cut in June. Citibank maintains an expectation of a 125 basis point rate cut by 2025, anticipating the next rate cut in June.
Rate cuts become the core narrative: The market expects to enter the "rate cut main line" in June, serving as the narrative driving force for the next phase of market trends.
European Central Bank and Digital Euro:
◦ The European Central Bank (ECB) reports predict that the digital euro will replace some cash, changing the way currency is used and affecting bank deposits.
◦ The ECB emphasizes that the introduction of the digital euro is to respond to the rise of dollar stablecoins and other cryptocurrencies, and to curb the expansion of "debanking" solutions.
Crypto Ecosystem News
BTC's correlation with gold has strengthened: On Monday, BTC briefly exhibited risk-averse properties alongside gold, but later fell under the drag of US stocks. Recent analysis suggests that BTC is influenced by the rise in gold, with a risk-averse narrative aligning with the weakness of the dollar and uncertainty in US Treasury bonds.
BTC price once exceeded $87,000, believed to be related to the decline of the dollar, the rise in gold, and concerns about the independence of the Federal Reserve.
CryptoQuant analysts believe that the current situation is more likely a correction rather than the start of a bear market, as the previous rise was moderate and overheating was limited, with downward risks being controllable.
Altcoin market: Coinmarketcap data shows that while the altcoin season index has rebounded from its low, it remains far below the average of the previous months, indicating a slight market recovery. Matrixport believes that a large-scale rise in altcoins requires catalysts such as dovish signals from the Federal Reserve, growth in stablecoins, or an increase in macro liquidity.
The South Korean BTC premium (kimchi premium) has rebounded to about 2%, seen by some analysts as an early signal of strong demand and potential price rebound.
Expectations of bottoming out and narrative transition: The market is focused on whether BTC and altcoins have bottomed out and is looking forward to transitioning to the next narrative phase centered on "the Federal Reserve's rate cut in June."
Last week, the cumulative net inflow of US BTC spot ETFs was only $13.7 million, while ETH spot ETFs saw a net outflow of $32.3 million, indicating weakened inflow momentum.
Institutional and whale dynamics:
◦ Japanese listed company Metaplanet increased its holdings by 330 BTC, bringing its total holdings to 4,855 BTC.
◦ Strategy (formerly MicroStrategy) spent about $556 million to increase its holdings by 6,556 BTC within a week, with an average price of about $84,785. Saylor stated that over 13,000 institutions and 814,000 retail investors hold MSTR.
◦ Glassnode data shows that the number of "whale" addresses holding over 1,000 BTC increased from the end of February to April 15 (2037 -> 2107), approaching last year's end level; while the number of small addresses holding less than 10 BTC continues to decrease.
- Regulatory and policy dynamics:
◦ Progress in state-level legislation in the US:
▪ Texas will hold a hearing on the "BTC Strategic Reserve and Investment Act."
▪ Arizona's "Strategic Digital Asset Reserve Act" (SB 1373) has passed the House committee and requires subsequent voting and approval.
◦ Federal perspective: Senator Cynthia Lummis proposed that if the US government purchases BTC using gold certificates valued at 1974 levels, it could halve national debt within 20 years without needing new tax funding.
◦ Regulatory risk reduction: Matrixport analysis suggests that regulatory risks for BTC in the US have significantly decreased, which is one reason for its better performance during this adjustment period compared to previous ones.
- Development of the digital euro: The European Central Bank is actively promoting the digital euro project to address challenges from cryptocurrencies and stablecoins.
Long-term Insights: Used to observe our long-term situation; bull market/bear market/structural changes/neutral state
Mid-term Exploration: Used to analyze what stage we are currently in, how long this stage will last, and what situations we will face
Short-term Observation: Used to analyze short-term market conditions; as well as the likelihood of certain directions and events occurring under certain premises
Long-term Insights
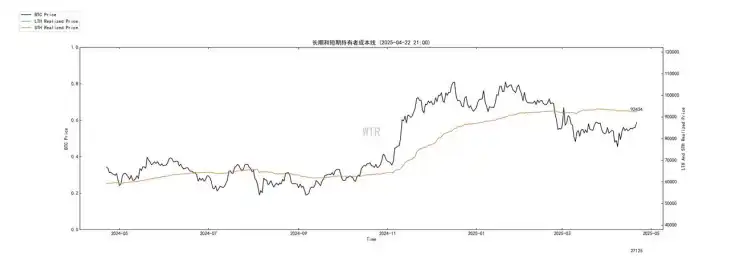
• The price point of $92.4k is critical. For a large number of short-term holders (STH) who bought at recent highs, this is their average cost line.
• The anchoring effect will play a significant role here: when the price rebounds close to $92.4k, this group of trapped STH will have a strong impulse to "sell once they break even" to avoid further losses. This will create a real visible supply pressure wall. The short-term direction of the market largely depends on whether it can effectively absorb and break through this barrier formed by the STH's liquidation.
• If unable to break through: If the price repeatedly attempts to hit $92.4k and fails, or encounters significant selling pressure and falls back, it will strengthen the market's pessimistic sentiment. STH may lose patience, triggering larger-scale selling (capitulation selling), and the price may further dip to seek lower support. This may also cause whales that are accumulating to slow down, waiting for better prices.
• If successfully breaking through: If there is sufficient buying power (such as sustained ETF inflows or whales further accumulating) to absorb the liquidation at $92.4k and effectively push the price above it, this will be an extremely important positive signal. It not only relieves the pressure on STH but may also trigger short covering and FOMO from off-market funds, accelerating the price increase.
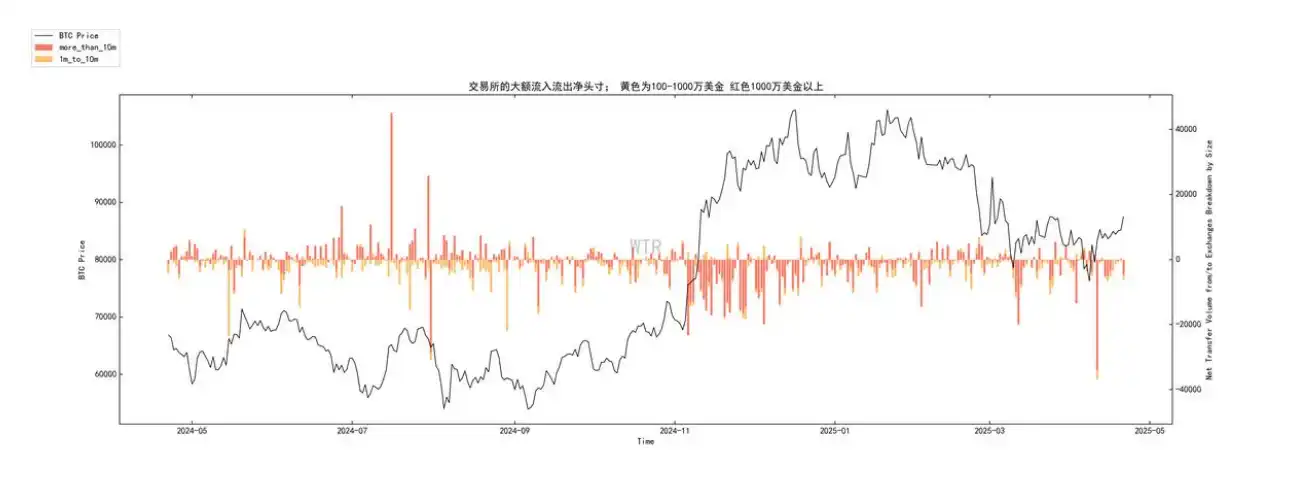
• Previously, "massive outflows" represented whales aggressively accumulating and locking in chips at low prices. Now, the "relatively reduced" outflow may mean:
a. Has the most panic/most valuable phase passed? Whales may believe that the phase of easily acquiring cheap chips has passed, and their initial accumulation targets may have been partially achieved.
b. Tactical pause? They may be waiting for clearer market signals (such as macro news landing, price direction confirmation) before proceeding with the next large-scale operation.
c. Change in accumulation method? It may shift from centralized trading platform withdrawals to more discreet OTC trades or other methods. The marginal reduction in whale outflows means that the strongest active buying force in the market may have weakened in the short term. This could make it more difficult to break through the $92.4k pressure wall or prolong the market's consolidation time in the current area. This is not necessarily a bearish signal (as it is still net outflow), but it suggests that the possibility of relying on whales for a "violent pull-up" in the short term is decreasing.
• If outflows continue to decrease or even turn into net inflows: this will be a strong warning signal, indicating a reversal in whales' accumulation intentions, and the market may face real selling pressure, severely weakening the previously constructed bullish logic.
• If outflows remain at a "relatively reduced" level: the market may enter a phase dominated by other factors (such as ETF flows, retail sentiment, news) with lower volatility, but directional clarity may also be more ambiguous, requiring more time to build a bottom or wait for catalysts.
• If outflows expand again: it confirms that whales are only making a brief adjustment, and their accumulation intentions remain strong, which will greatly benefit the market in breaking through key obstacles.
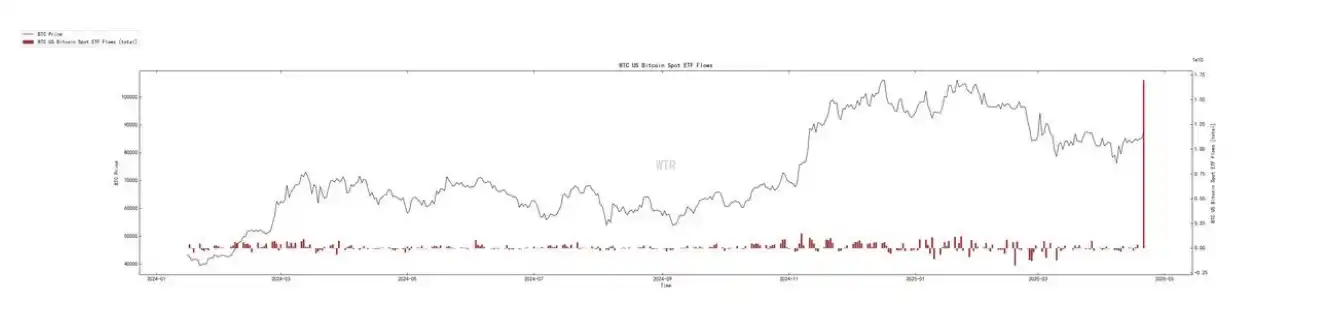
This "extraordinarily large" single-day inflow occurred against a backdrop of strong macro risk aversion and price correction, and its driving force is likely the "risk aversion/bottom-fishing" allocation demand from traditional capital, viewing BTC as an alternative asset similar to gold. Its significance lies in proving that the ETF channel can still attract substantial funds under specific conditions, and this portion of capital may be highly sensitive to price.
• The key is sustainability: Is this pulse a "one-day wonder" or the beginning of a new trend? This directly relates to whether the market can obtain sustained external liquidity.
• If inflows continue: it will provide strong incremental buying power for the market, greatly enhancing the ability to break through the $92.4k pressure wall, and may attract more following capital.
• If inflows quickly dry up: it indicates that this is just a short-term stress response, and the market still needs to rely on internal forces (whales, LTH confidence) to digest selling pressure, making it more difficult to break through $92.4k.
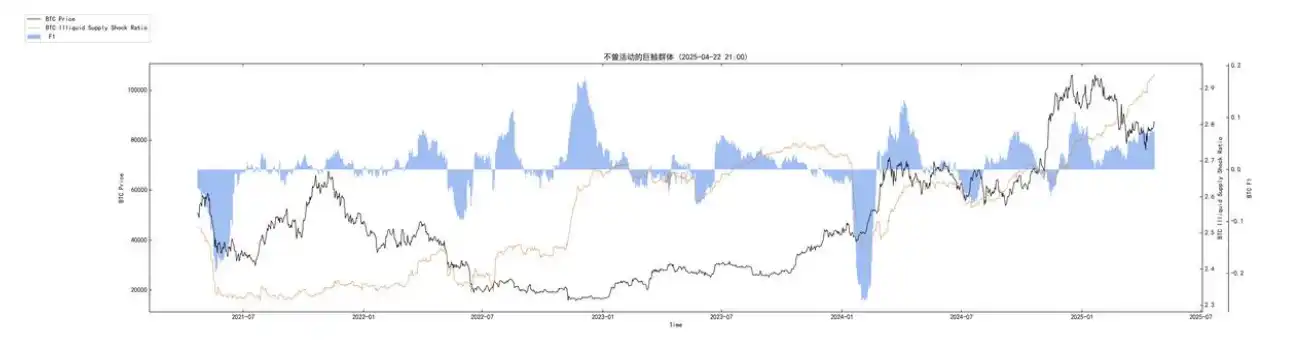
This is the most solid and structurally significant positive signal. It is independent of short-term price fluctuations and sentiment, reflecting a deep and sustained supply locking trend in the market. This ongoing tightening on the supply side is a core bullish factor for the medium to long term, continuously raising the supply threshold that future price increases need to overcome. It acts like a "slow variable," consistently providing support to the market, increasing the difficulty of deep pullbacks, and laying the groundwork for future supply squeeze trends. This can partially offset the pressure from short-term holders (STH) and the uncertainty brought by changes in whale behavior in the short term.
Future Outlook:
The current market is at a critical juncture where the pressure from STH ($92.4k anchoring effect) is fiercely contending with strong underlying accumulation (whale outflows + ISSR rapid growth + ETF pulse inflows).
Macroeconomic news (strong expectations for interest rate cuts but undecided, geopolitical risks, Trump's rhetoric, etc.) adds significant uncertainty and volatility to this confrontation.
• Evolution of the core shield:
Previously, it may have been a comprehensive tug-of-war between bulls and bears; now it resembles the "willingness of trapped STH to break free" vs. "the determination of whales/long-term holders/new ETF funds to accumulate."
• Reaction Pathways:
a. Short-term focus ($92.4k battle): The reduced outflow from whales may make the short-term breakthrough of $92.4k more reliant on the sustainability of ETF inflows and the patience of the ISSR accumulation effect. If ETF inflows cannot be sustained and whales do not re-engage, relying solely on ISSR (non-liquid whales) as a slow variable may struggle to quickly break through $92.4k, leading the market to repeatedly tug-of-war in this area, consuming STH patience.
b. If $92.4k remains unbroken for a long time: It may trigger deeper despair selling from STH, at which point it will be necessary to observe whether whales will increase outflows again (buying on dips) and whether ISSR (non-liquid whales) can continue to grow rapidly to absorb this supply. If whales do not step in or the growth rate of non-liquid whales slows, the market may enter a deeper adjustment.
c. If $92.4k is effectively broken: It will greatly improve market sentiment and may trigger a positive feedback loop: STH pressure relieved -> off-market funds enter due to confirmed breakout -> may stimulate continued ETF inflows -> price increase further reinforces the "hoarding" logic of ISSR -> whales may continue to increase holdings or lock in profits.
d. Macroeconomic "unique factors": Any clear signals regarding Federal Reserve policy (early rate cuts/delayed rate cuts/changes in intensity) could instantly break the existing balance and become a key catalyst determining short-term direction.
Mid-term Exploration
• Network sentiment positivity
• Structural analysis models at various price levels
• ETH trading platform circulation ratio
• Derivative unilateral status
• Long-term and short-term holding supply
(Network sentiment positivity in the chart below)
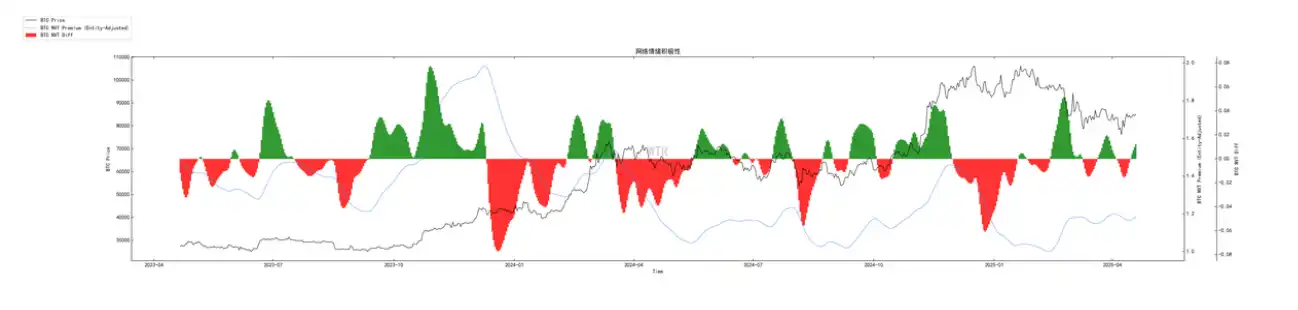
Network sentiment shows signs of recovery, indicating that market sentiment may be slowly repairing. Based on recent conditions, if the repair continues, a better right-side structure may emerge.
(Structural analysis model at various price levels in the chart below)
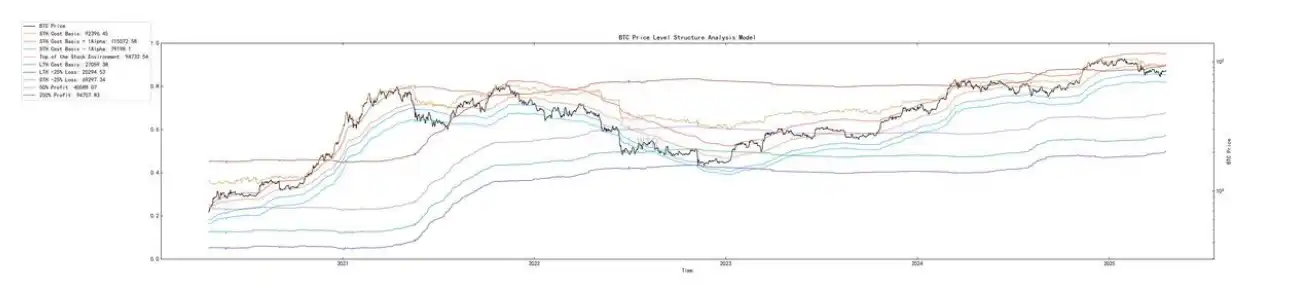
The current upper limit of stock at this price level is around $95,000, and as the market gradually approaches this price level, it may face significant profit overflow pressure. Meanwhile, the short-term cost line is currently around $92,000, which may be a closer upper price level compared to the stock upper limit.
(ETH trading platform circulation ratio in the chart below)
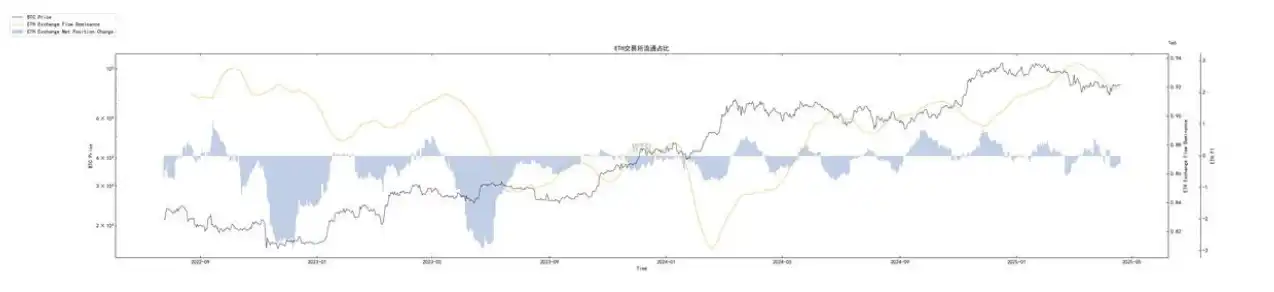
Currently, the BTC proportion in the internal circulation frequency of trading platforms is higher. Typically, this state indicates that the market is focusing attention on BTC, and the relatively good circulation efficiency is also increasing the smoothness of handovers. Similarly, from another perspective, under the trend of continuous accumulation of BTC, the concentration of liquidity in BTC in the market can also reflect a certain risk-averse tendency.
(Derivative unilateral status in the chart below)
This data is produced by WTR based on the liquidation status of BTC.
Blue indicates a strong bearish phase, and orange indicates a strong bullish phase. Currently, it is within a strong bullish range.
(Long-term and short-term holding supply in the chart below)
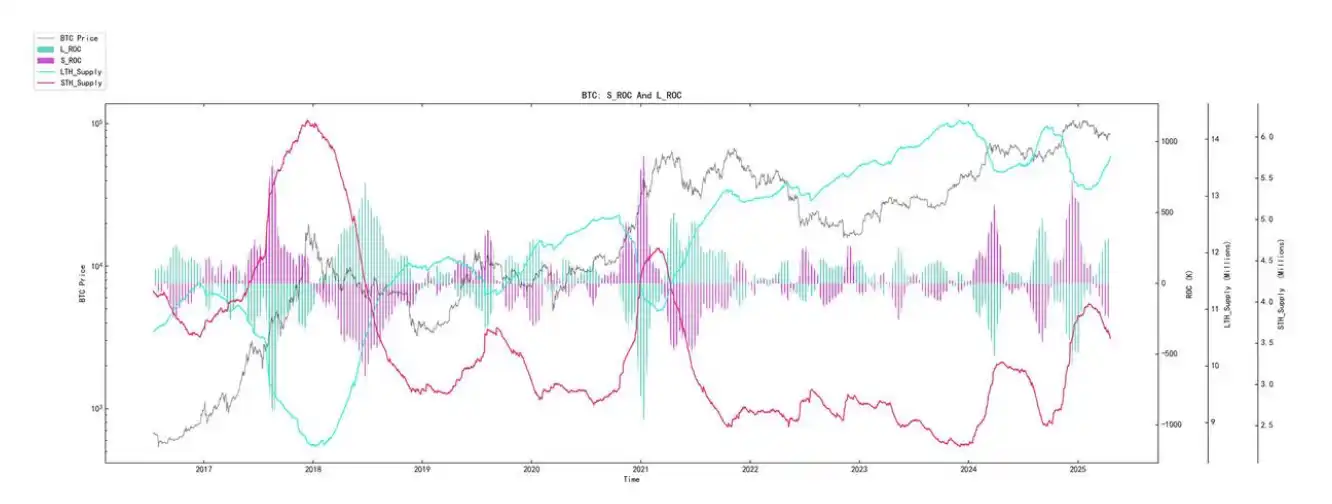
From the market perspective, the volume of short-term chips is still low, and the market is still in a state of increasing long-term chips. This may indicate that the current speculative atmosphere is gradually dissipating, with relatively long-cycle holding chips increasing.
Short-term Observation
• Derivative risk coefficient
• Options intention transaction ratio
• Derivative transaction volume
• Options implied volatility
• Profit and loss transfer volume
• New addresses and active addresses
• Ice Sugar Orange trading platform net position
• Yita trading platform net position
• High-weight selling pressure
• Global purchasing power status
• Stablecoin trading platform net position
• Off-chain trading platform data
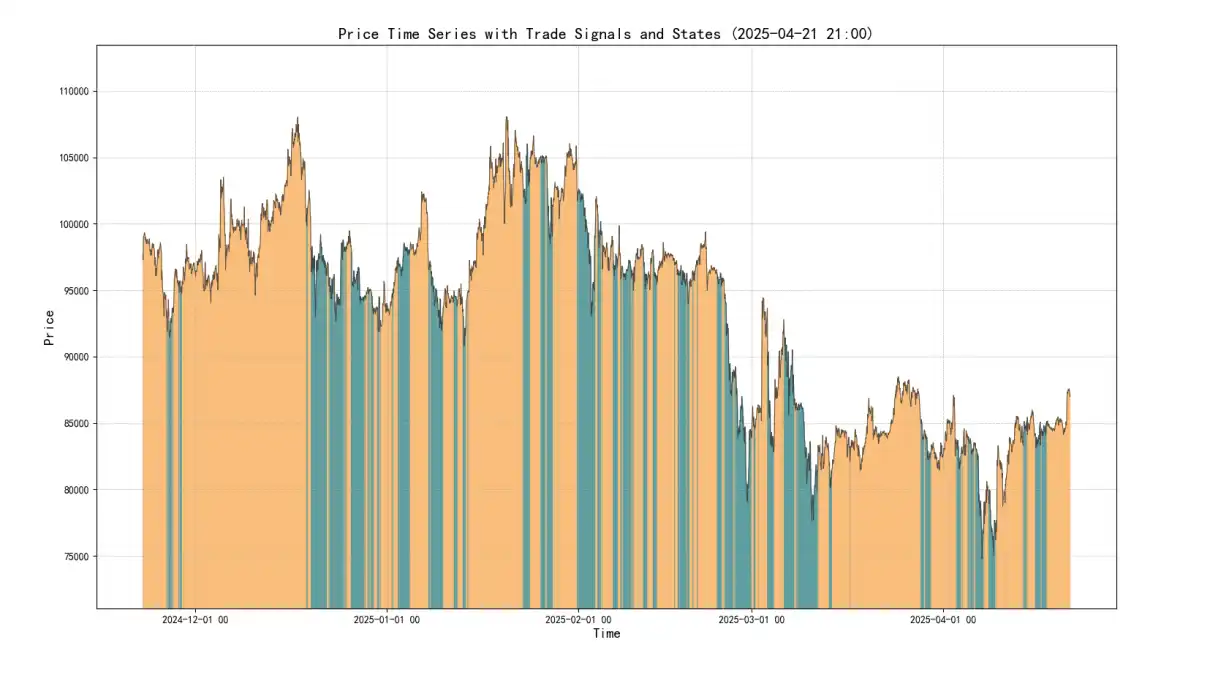
Derivative Rating: The risk coefficient is in the red zone, indicating increased derivative risk.
(Derivative risk coefficient in the chart below)
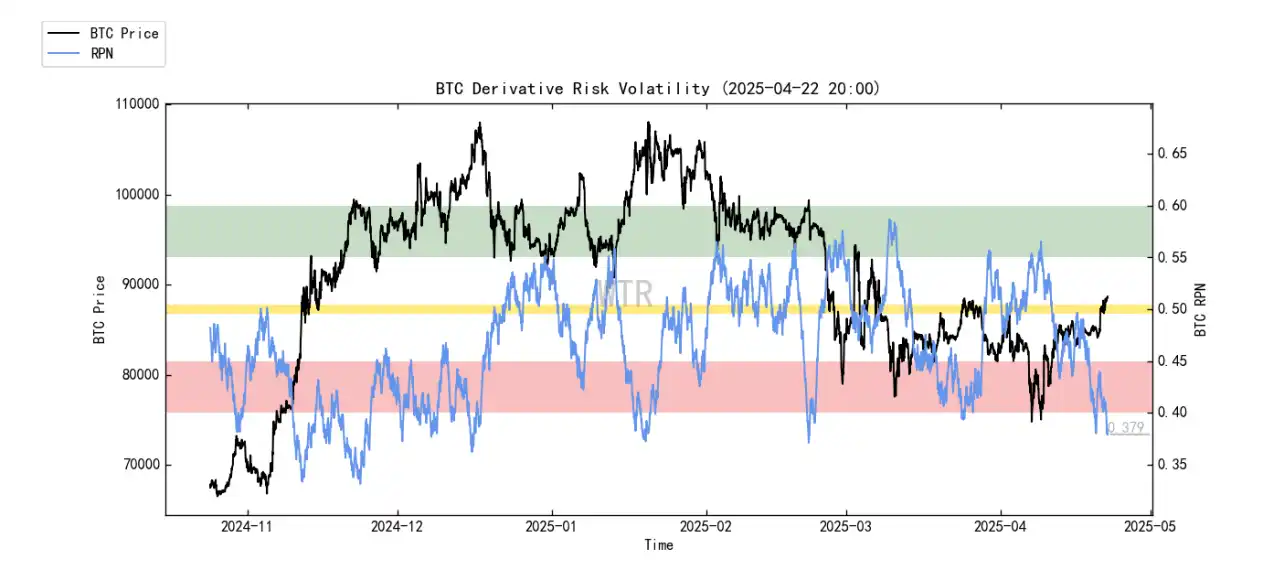
BTC price has slightly rebounded, and the market has not fully squeezed the risk coefficient, which is already in the red zone. For the current market environment, there may be continued short squeezes this week, even if the magnitude may be relatively low.
(Options intention transaction ratio in the chart below)
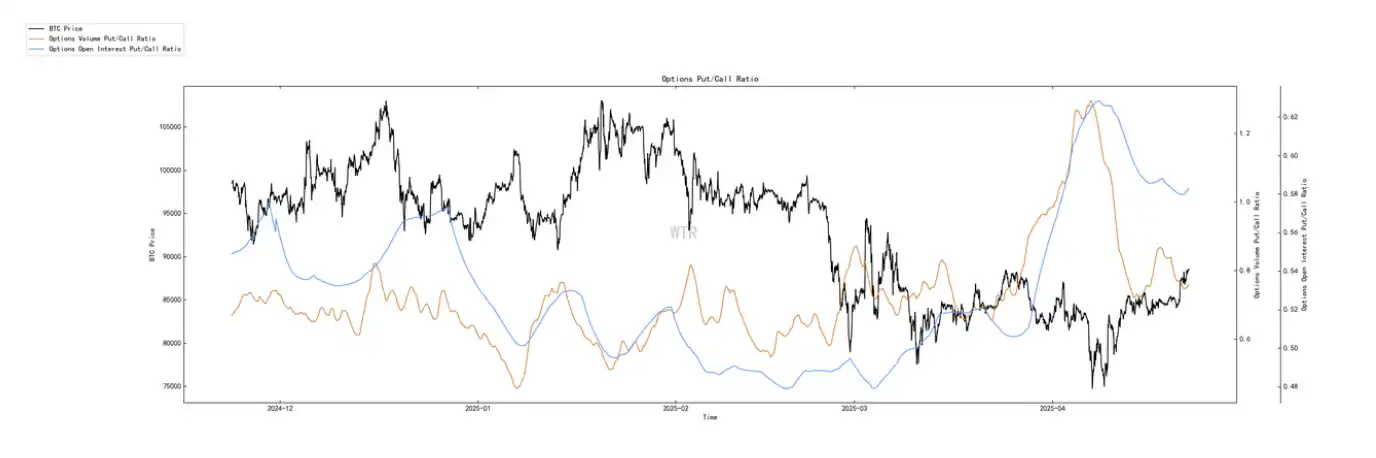
The ratio and volume of put options have both decreased, with the current put options ratio at a medium-high level.
(Derivative transaction volume in the chart below)
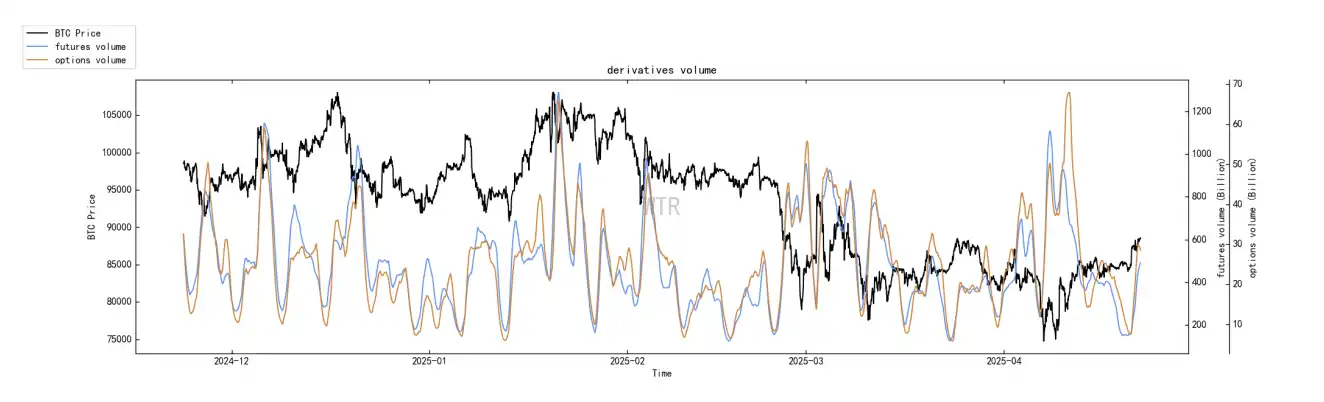
Derivative transaction volume is at a medium-low level.
(Options implied volatility in the chart below)
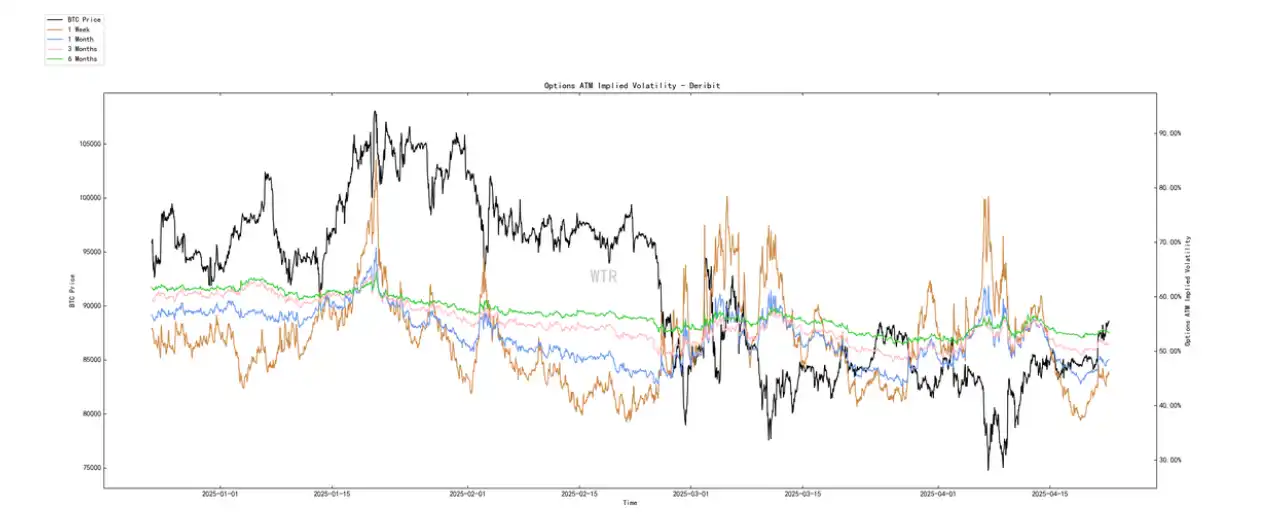
Options implied volatility has not changed significantly in the short term. Sentiment state rating: Neutral
(Profit and loss transfer volume in the chart below)
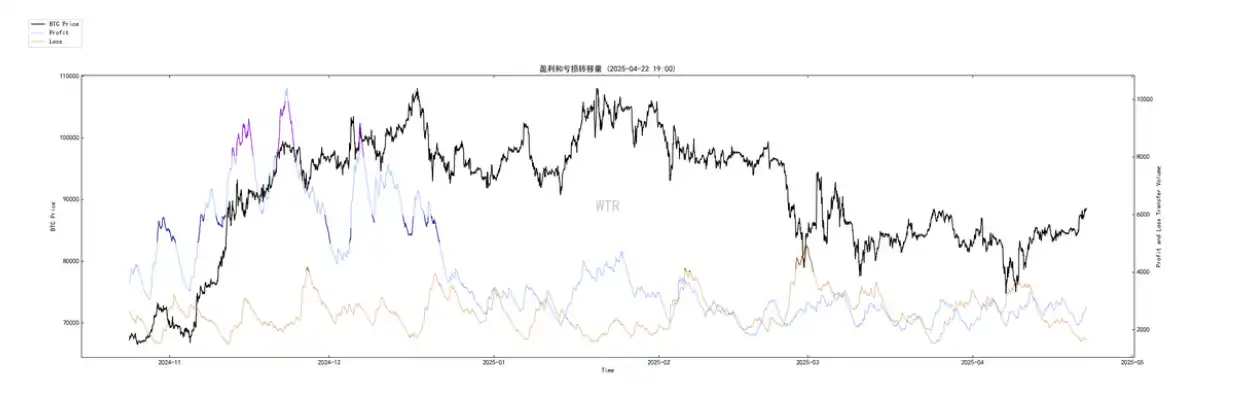
Market positive sentiment (blue line) and panic sentiment (orange line) remain at low levels, indicating that even if there is a rebound in the future, the short-term space may be limited.
(New addresses and active addresses in the chart below)
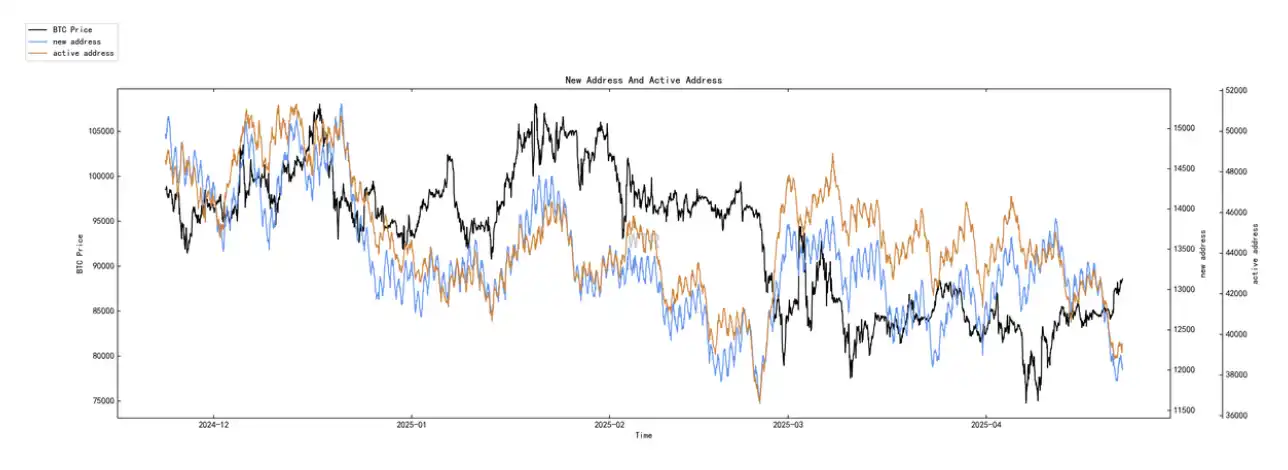
New active addresses are at a low level.
Spot and selling pressure structure rating: Overall, BTC continues to see significant outflows, while ETH has only a small outflow.
(Ice Sugar Orange trading platform net position in the chart below)
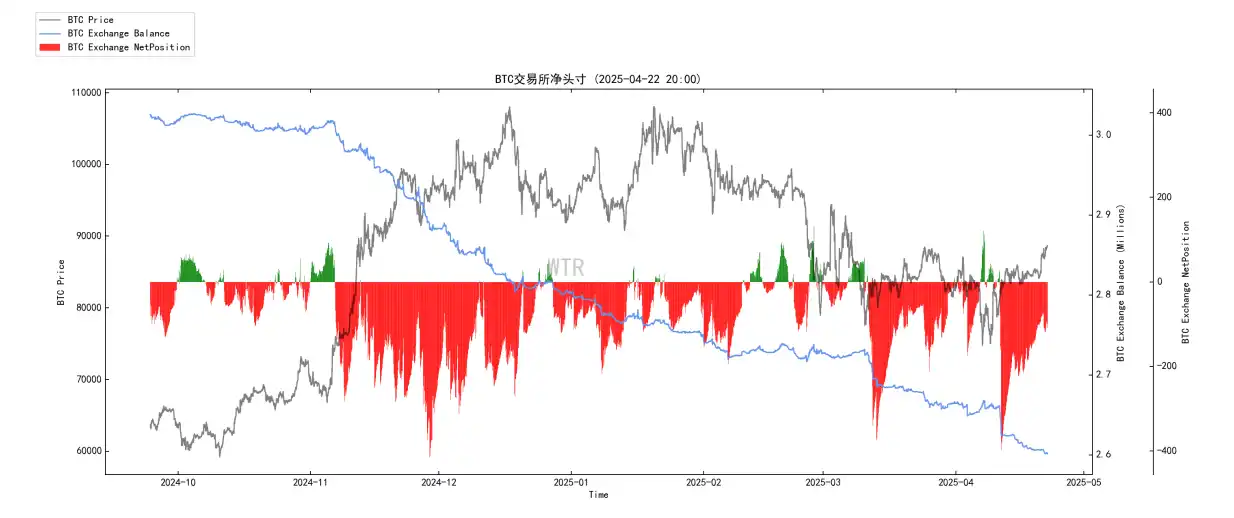
Currently, there is a large outflow of BTC.
(Yita trading platform net position in the chart below)
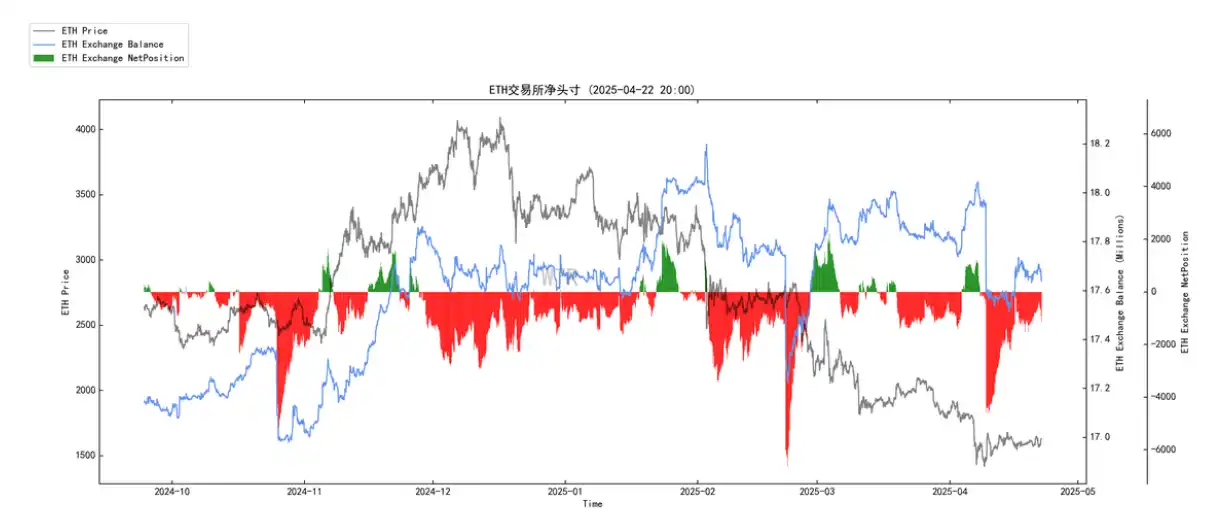
On the surface, the net position in the ETH trading platform is continuously flowing out, but in reality, observing the blue line, the net position balance in the ETH trading platform is almost equivalent to the market peak period in December. In the short term, the selling pressure in the ETH market will still persist.
(High-weight selling pressure in the chart below)
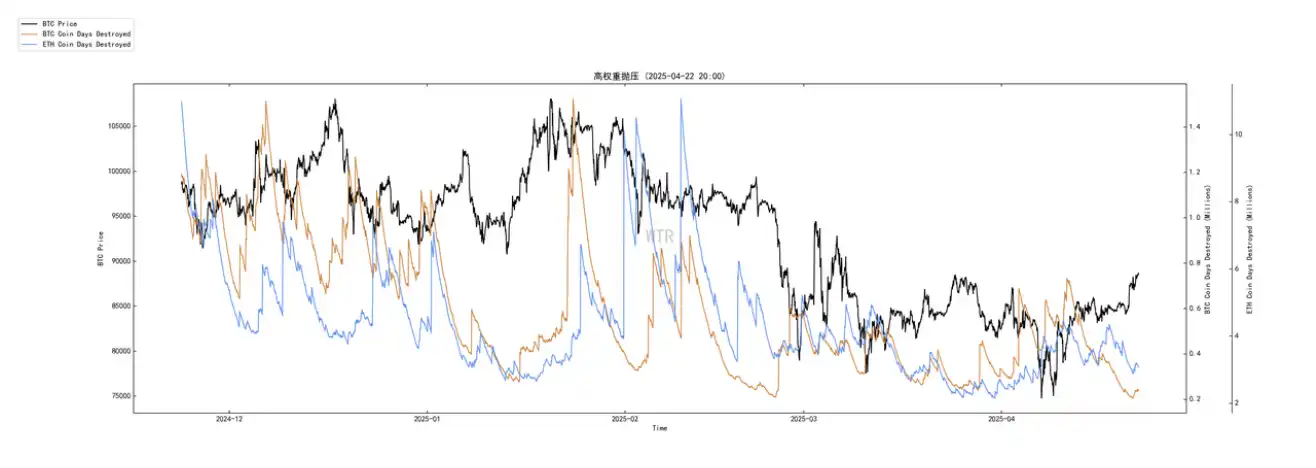
No high-weight selling pressure.
Purchasing power rating: Global purchasing power is in a state of loss, while stablecoin purchasing power remains flat.
(Global purchasing power status in the chart below)
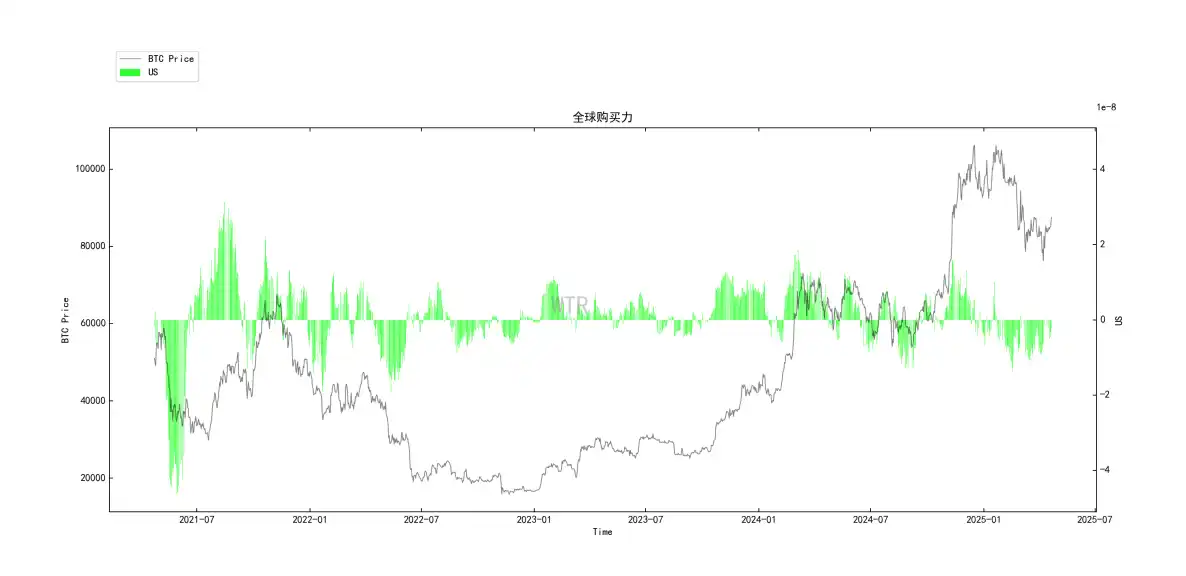
Last week, purchasing power slightly rebounded, but this week it has entered a state of loss again.
(USDT trading platform net position in the chart below)
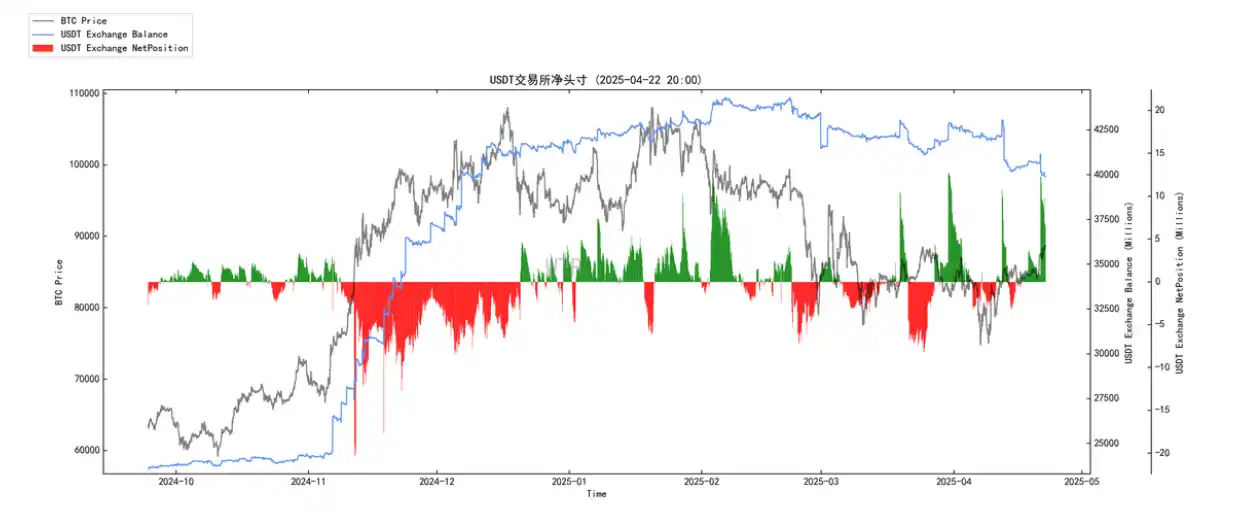
Overall, stablecoin purchasing power remains flat compared to last week.
Off-chain trading data rating: There is a willingness to buy at $80,000; there is a willingness to sell at $92,000.
(Coinbase off-chain data in the chart below)
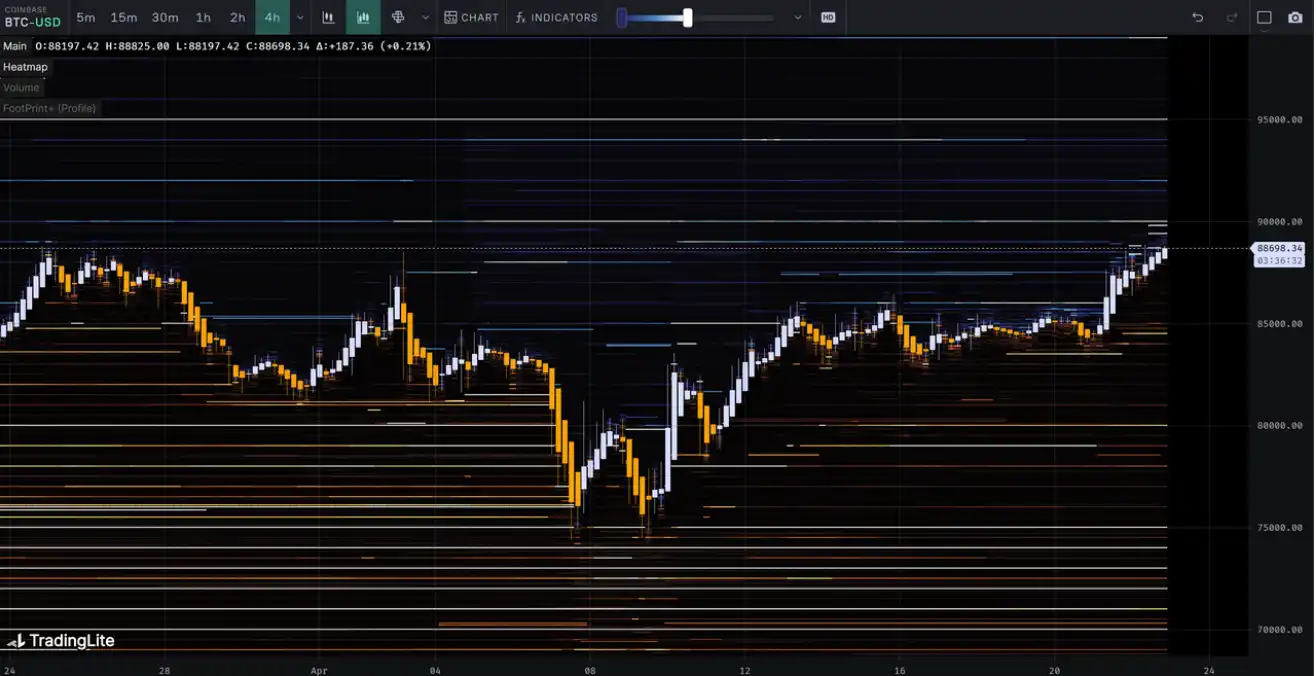
There is a willingness to buy around the price level of $70,000 to $80,000;
There is a willingness to sell around the price level of $90,000 and $95,000.
(Binance off-chain data in the chart below)
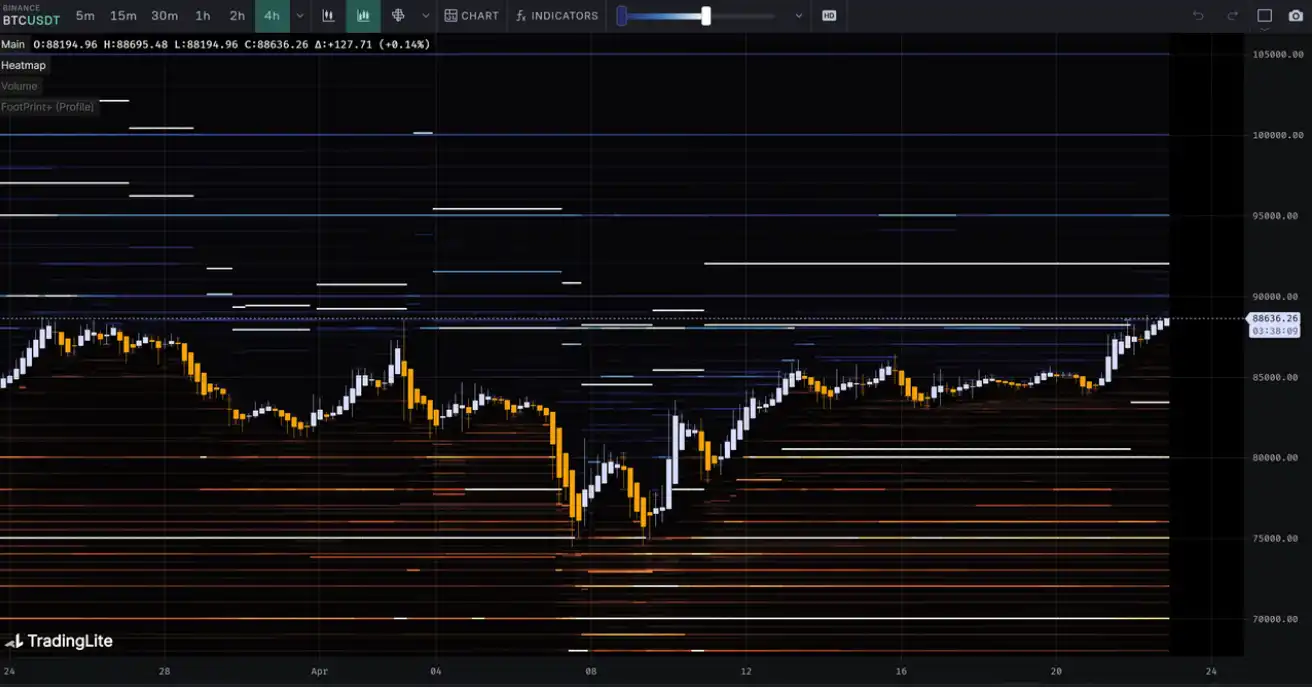
There is a willingness to buy around the price level of $70,000 to $80,000;
There is a willingness to sell around the price level of $92,000.
(Bitfinex off-chain data in the chart below)
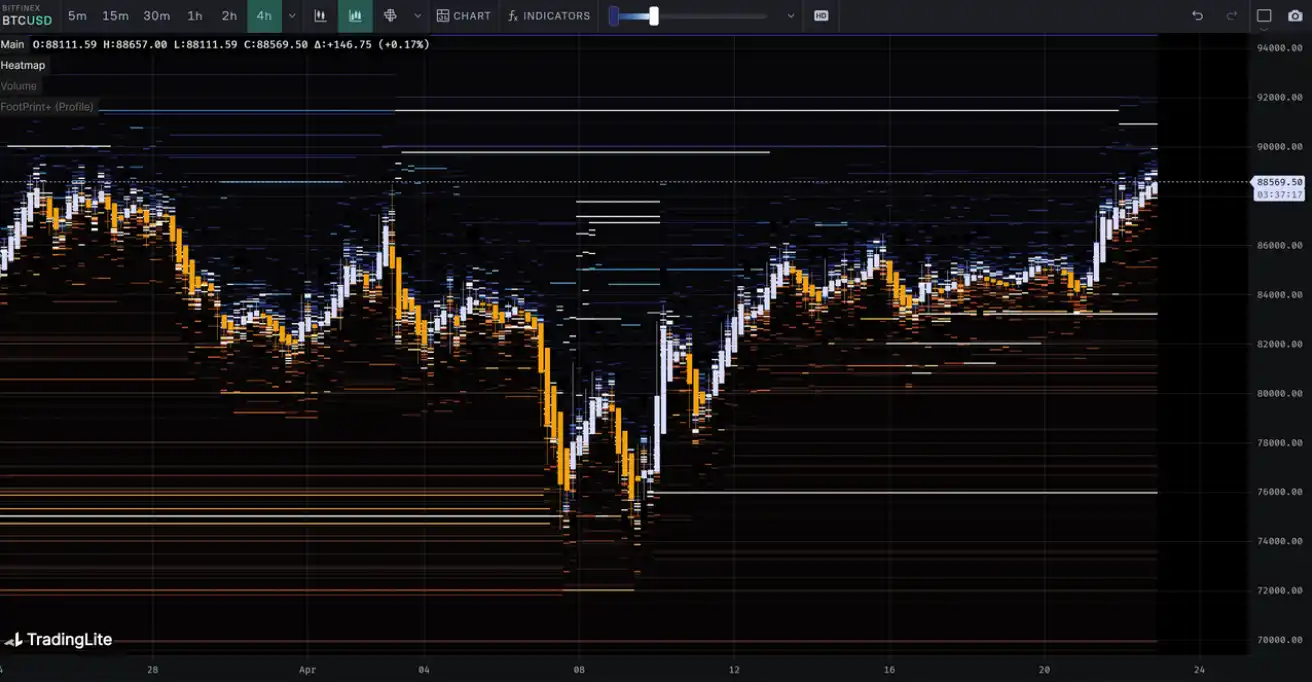
There is a willingness to buy around the price levels of $70,000 and $83,000;
There is a willingness to sell around the price level of $92,000.
This Week's Summary:
News Summary:
The current market is shrouded in significant macro uncertainty, as evidenced by the notable pressure on the U.S. stock market and the soaring gold prices reaching new highs, with strong risk-averse sentiment dominating traditional capital markets. The focus is almost entirely on the Federal Reserve, where political pressure (especially from Trump's ongoing attacks on Powell) intertwines with the market's extremely high expectations for interest rate cuts, making the future path of monetary policy a core variable that influences the overall situation.
In this context, the cryptocurrency space, particularly Bitcoin, presents a complex and differentiated picture: on one hand, it shows a certain resilience amid the macro storm, with recent net outflows from U.S. spot ETF funds shifting to slight net inflows, which is a key marginal improvement signal indicating that the selling pressure from traditional channels has temporarily eased, allowing the market to catch its breath at a critical position; on the other hand, this stabilization does not stem from strong new demand but contrasts sharply with the "firm behavior of core participants"—institutions like MicroStrategy and on-chain "whale" addresses continue to accumulate chips significantly, demonstrating strong long-term conviction, while smaller holders show a trend of outflow.
At the same time, the marginal improvement in the U.S. regulatory environment also provides potential long-term support for the market. Therefore, the current core shield lies in the "tug-of-war between external macro pressure and internal structural forces (ETF stabilization, core players increasing holdings, and favorable regulation)," which may lead the market to continue maintaining a volatile pattern in the short term, being highly sensitive to macro signals (especially the Federal Reserve's movements) while waiting for clearer catalysts to break the deadlock.
On-chain Long-term Insights:
The current price is operating below the average cost of short-term holders (around $92.4k), putting pressure on recent entrants with unrealized losses, and may create a selling pressure wall around $92.4k due to the anchoring effect.
The dominant recent signal is the large-scale net outflow of Bitcoin from trading platforms by whales, indicating a strong strategic accumulation willingness and optimism about future prices, significantly reducing the short-term available supply.
After experiencing weakness, ETFs have recently seen a remarkably significant single-day net inflow, indicating a strong pulse of demand from compliant channels, injecting important buying power into the market.
The proportion of non-liquid whales continues to rise steeply, indicating that BTC is being locked away for the long term and is leaving circulation at a high speed, with the fundamental aspect of market supply continuing to tighten rapidly.
• Market Tone:
The core characteristic of the current market state is the pressure on surface prices (below the short-term holder cost line) contrasted with extremely strong underlying on-chain accumulation (large withdrawals by whales, demand locking from non-liquid whales, ETF demand pulses), creating a stark contrast and fierce confrontation. This indicates that the market is undergoing a deep correction or "washout" dominated by strong buying power, with "weak hands" who entered recently under pressure, while "strong hands" with long-term optimism are actively accumulating and locking in supply, leading to an extremely tight supply-demand fundamental situation. Therefore, although the struggle around the key cost level (around $92.4k) may bring volatility in the short term, the overwhelming positive signals on-chain suggest that the market is likely to digest the pressure, confirm the bottom, and build momentum for the next stage of upward movement based on strengthened fundamentals.
On-chain Mid-term Exploration:
• Network sentiment is slowly recovering, potentially presenting structural opportunities on the right side.
• The upper limit of stock is around $95,000, which may face significant profit pressure as it approaches; the short-term cost is $92,000, which may constitute a resistance level.
• BTC dominates trading platform circulation, with smooth handovers and a tendency for risk aversion.
• WTR liquidation status indicates that it is currently in a strong bullish phase.
• The speculative atmosphere of short-term chips is decreasing, while long-term holdings are increasing.
• Market Tone:
Recovery, accumulation
The market is seeking stability, with sentiment gradually stabilizing, BTC dominating liquidity, and long-term holdings increasing.
On-chain Short-term Observation:
The risk coefficient is in the red zone, indicating increased derivative risk.
New active addresses are at a low level.
Market sentiment state rating: Neutral.
The net position on trading platforms shows a continuous large outflow of BTC, while ETH has only a small outflow.
Global purchasing power is in a state of loss, while stablecoin purchasing power remains flat.
Off-chain trading data indicates a willingness to buy at $80,000; there is a willingness to sell at $92,000.
The probability of not breaking below $70,000 to $75,000 in the short term is 80%; among them, the probability of not breaking above $90,000 to $95,000 in the short term is 70%.
• Market Tone:
The market will continue to be dominated by BTC, while market sentiment remains neutral. This week, in the absence of external news stimuli, the rebound space in the market will still be limited by the pressure of the short-term holder cost line (around $92k).
Risk Reminder: The above is all market discussion and exploration, and does not constitute directional opinions for investment; please approach with caution and guard against market black swan risks.
This article is from a submission and does not represent the views of BlockBeats.
免责声明:本文章仅代表作者个人观点,不代表本平台的立场和观点。本文章仅供信息分享,不构成对任何人的任何投资建议。用户与作者之间的任何争议,与本平台无关。如网页中刊载的文章或图片涉及侵权,请提供相关的权利证明和身份证明发送邮件到support@aicoin.com,本平台相关工作人员将会进行核查。


