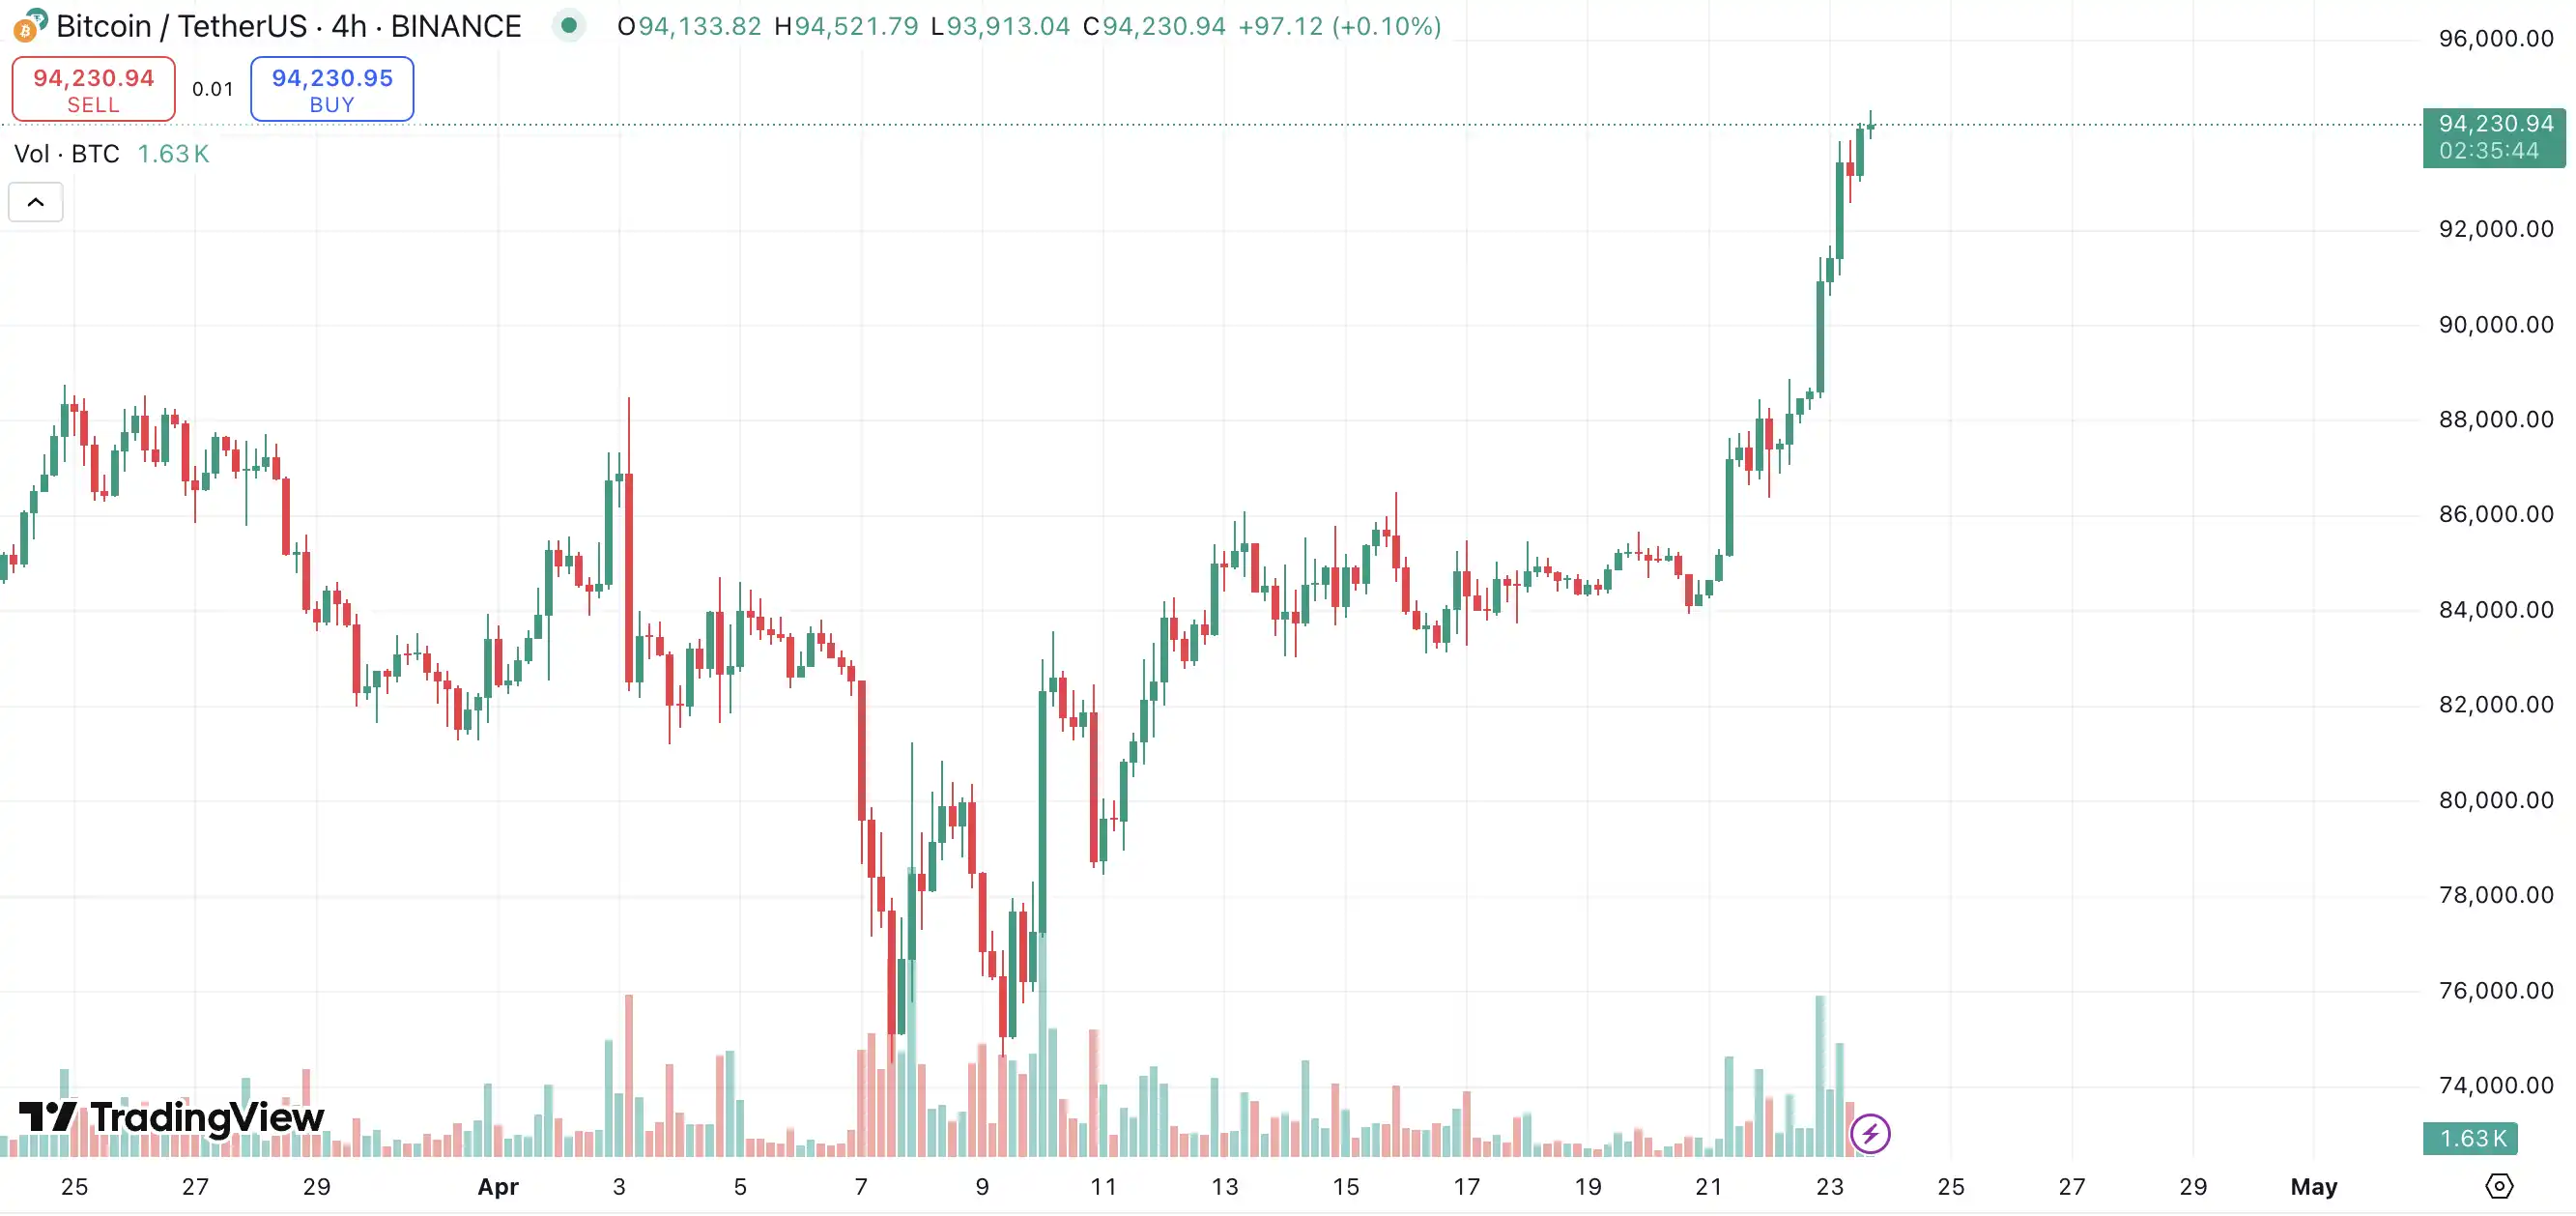
Bitcoin breaks through $94,000, is it a reversal or a rebound? | Trader's Observation

CN
7 hours ago

Under the multiple catalysts of easing signals in China-U.S. trade and a temporary alleviation of uncertainty in Federal Reserve policy, Bitcoin has strongly broken through the $94,000 mark in the short term, reigniting market enthusiasm for "digital gold."

Related Reading: "Bitcoin Soars 7%, Is the 'Digital Gold' Narrative Back?"

This round of price increase is not merely a short-term reaction to the warming of China-U.S. trade relations, but rather a risk repricing under the overlay of multiple macro signals. In this storm of policy games and risk aversion demands, Bitcoin is once again viewed as a "safe haven" for capital, and its price surge may be a preemptive response from the market to future inflation, dollar credit, and changes in the global geopolitical landscape.

However, whether this price surge marks the beginning of a structural reversal or a phase-driven rebound due to policy games remains a significant divergence in market opinions.

On one hand, the funding and policy fronts are releasing positive signals for "risk repricing." The Trump administration's softened stance on tariffs, the temporary "hands-off" approach towards Powell, and Wall Street's high-profile participation in Bitcoin funds are seen as manifestations of the shifting roles between traditional safe-haven assets and digital assets. Institutions like QCP and Matrixport view this Bitcoin surge as an active pricing adjustment under changing macro trends, pointing out that funds are flowing from traditional assets like gold into the crypto market.

On the other hand, some technical analysts and seasoned traders remain cautious, believing that the current rise has not yet completed the structural confirmation needed for a trend reversal. From wave patterns, RSI indicators to liquidity dense ranges, the long and short signals are complexly intertwined, with the current market more resembling a strong rebound rather than a trend reversal. Technical assessments consistently emphasize that only a sustained breakthrough above $95,000 for Bitcoin could potentially initiate a new bullish trend.

Institutional Analysis

QCP: Bitcoin Successfully Breaks Through the Psychological Barrier of $90,000, Highlighting Investors' Renewed Interest in Risk Assets

QCP Capital's daily market analysis states that Cantor, SoftBank, Tether, and Bitfinex have jointly launched a bold Bitcoin acquisition fund named 21 Capital (tentative name), coinciding with a decisive shift in U.S. policy stance, as the Trump administration leans towards supporting the "digital gold" narrative, providing a boost to the cryptocurrency market.

Bitcoin has successfully broken through the psychological barrier of $90,000. Meanwhile, gold has dropped by 6%, highlighting a renewed interest from investors in risk assets and clearly showing a flow of funds into digital assets.

Institutional investors are no longer just testing the waters of cryptocurrency but are fully committed. As the Strategy approach gradually fades, 21 Capital is expected to become a new benchmark for cryptocurrency confidence.

Macro risks still exist, but a key uncertainty factor seems to have been alleviated. Trump has stated that there are currently no plans to replace Federal Reserve Chairman Powell, which has helped U.S. long-term bond yields slightly retreat, reducing an important tail risk.

Although the bond market is stabilizing, the U.S. stock market remains at record highs, reflecting a more moderate and cautious market response. However, the overall outlook is far from simple. Trade frictions, geopolitical tensions, and regulatory uncertainties continue to cast shadows over the market. Investors navigate a rapidly changing environment, remaining highly sensitive to the next potential turning point.

Matrixport: As Concerns Over Tariffs Diminish, the Probability of Bitcoin Breaking Through the Key Level of $95,000 is Increasing

Due to the recent market recovery, speculative trading activity has risen, and open interest in futures contracts has increased. Although Bitcoin has not yet broken through the key level of $95,000, the likelihood of this level being surpassed is increasing as market concerns over Trump's tariff remarks diminish. Bitcoin's current trend shows a certain upward trajectory.

CITIC Securities: High Tariffs May Trigger "Recessionary" Rate Cuts by the Federal Reserve

Considering two scenarios: one where negotiations with trade partners lack substantial progress, and after 90 days, the effective tariff rate remains high, leading to a dominant income effect that weakens economic demand, potentially prompting the Federal Reserve to start cutting rates from July, with a cumulative cut of up to 100 basis points for the year.

The other scenario is where negotiations yield results, tariffs are reduced, and the demand shock under the substitution effect is relatively mild, but inflationary pressures are more persistent, leading the Federal Reserve to delay easing measures, with only a slight rate cut in December. For the market, although monetary easing comes earlier in the first scenario, this "recessionary" rate cut reflects a deterioration in economic fundamentals, which could suppress risk assets.

Macro Insights

@qinbafrank

Last night, the market surged, accompanied by three easing signals from Trump's team:

  1. At 11:59 PM; Bessent stated at a closed-door meeting with JPMorgan investors that the current situation is unsustainable and that tensions with China will soon de-escalate, which will allow the market to "breathe a sigh of relief." Chinese concept stocks surged, gold dipped slightly, and the Nasdaq rose. The Treasury Secretary specifically chose to express this privately to investors within a Wall Street investment bank like JPMorgan, indicating a high regard for market sentiment, allowing the most sensitive capital market participants to digest and position themselves before any formal announcement.

  2. Around 1 AM, Politico reported that completing negotiations may take months. At this time, the White House was paving the way: White House Press Secretary Levitt stated at a press conference that Trump is laying the groundwork for a trade agreement with China, and relations with China are moving in the right direction. Levitt also mentioned that Trump "has the right to express dissatisfaction with the Federal Reserve" and its Chairman Powell, believing that some of the Fed's actions are politically motivated.

  3. At 5 AM, Trump stated that tariffs on China would "significantly" decrease from the current level of 145%, but would not drop to zero. China would be very satisfied with the final tariff rate. Trump also expressed no intention to fire Powell and hopes to see him be more proactive on rate cuts.

These three easing signals gradually pushed the market upward. As mentioned the day before, it is highly likely that the market will continue to trend upward over the next week or two. Since Trump and Bessent are still pushing for negotiations, the market remains hopeful for a new trade agreement, while also showing signs of desensitization to tariff fluctuations, thus providing upward momentum for short-term sentiment.

@Phyrex_Ni

Indeed, as soon as Trump eased up, the market began to surge uncontrollably. Although many friends are calling for a bull market return, I still feel there is some distance from a "bull return," especially for the overall risk market, where liquidity constraints still exist. I still believe this is a rebound rather than a reversal, though I may not be right.

Additionally, I don't think it's the right time to short, even if I believe it's just a rebound. I won't open positions during non-U.S. stock trading hours; I will wait to see how U.S. investors react after the market opens.

I want to reiterate that trading difficulty in April remains high. High trading difficulty does not mean a decline; it indicates that the long and short battles are more complex, and many of the reasons for the battles are driven by events, especially with Trump being the biggest uncertainty.

An increase in difficulty does not equate to a bearish outlook. I worry that friends may not understand this; I have explained this issue multiple times. If your reading comprehension is poor, don't blame me. The difficulty in the second quarter is already evident, and the volatility caused by Trump's remarks doesn't need further elaboration, not to mention the GDP data at the end of the month.

Technical Analysis

@GuilinChen

  1. Qualitative: Before breaking the previous high and forming a clear upward five-wave impulse, any rise should be regarded as a rebound rather than a reversal.

  2. Wave: Currently, Bitcoin has formed three upward segments: the first segment is from 74508 to 86496, the second segment is from 86496 to 83950, and the third segment is from 83950 to now. The third segment's rise is approaching a 1:1 ratio with the first segment's rise and has reached the lower boundary of the upper M head area.

  3. Indicators: Within the daily level, the 12H-1H RSI indicator is overbought.

@Cato_CryptoM

In the one-hour timeframe, Bitcoin showed a temporary stop and initial topping signal around 7 AM, but this was quickly broken by subsequent strong movements. The price retraced without breaking the one-hour MA7, demonstrating strength, and the overall range is contracting upward, with no divergence adjustment needed.

The four-hour chart shows no signs of stopping or topping. The overall one-hour trend is strong, and considering the current risk market situation, there should still be an upward movement after the U.S. stock market opens tonight. There is currently no effective resistance above, so we can only closely monitor short-term topping signals.

The logic of topping during an upward movement is similar to stopping during a downward movement: a rapid breakthrough accompanied by a long candlestick, followed by the second K line being lower than the previous high/higher than the previous low, then confirming the one-hour topping/stopping signal, and so on for the four-hour and daily levels. For example, in the current situation, there was an initial topping signal around 7 AM, but the subsequent market continued to oscillate upward, breaking the topping signal, and the four-hour chart shows no such signal. Therefore, under the premise of a temporarily unchanged macro trend, the technical outlook remains bullish with oscillating upward movements.

@CryptoPainter_X

The anticipated oscillating upward path was quickly invalidated; I didn't expect the acceleration to come so fast! BTC directly hit the orange line at the 4-hour average resistance level and cleared almost all liquidity within the current range in the futures market…

Now, the main supply zone is the range of 93k to 95k.

As the price enters the orange average resistance zone, it is unrealistic to make large-scale long positions in the short term, as that would be akin to lifting my trend long positions.

However, short-term long positions can still be made with confidence. Bull markets differ from bear markets; after acceleration, a V-shaped rebound often occurs. In a bull market, after acceleration, there tends to be a high-level range, continuously testing new highs until demand weakens, at which point a pullback will begin.

In the short term, as the channel rises rapidly, the upper yellow line of the oscillating channel will become a potential pullback target (89k~90k). In subsequent pullbacks, as long as the price does not fall below the yellow line and returns to the oscillating channel, there will always be hope for a breakthrough at 95,000.

As for the situation where the pullback breaks below the yellow line, we will address that when it actually happens.

The current market situation may have exceeded many people's expectations, but if you look at the price rebounding from the bottom, then to a mid-range contraction and oscillation, and today’s accelerated rise, this is a clear two-segment ABC structure, where the rise of A is approximately equal to the increase of C.

Therefore, I subjectively believe that the overlap of the orange line with the supply zone creates significant price pressure, making it unlikely to rise all at once. A proper pullback and oscillation to accumulate short liquidity, gradually grinding upwards and absorbing supply, is necessary to achieve a final breakthrough.

I want to emphasize again that the current market, in my view, is still a rebound, not a reversal. The price action resembles oscillation within the large range of 95k~78k;

Thus, when the price approaches the upper range, it is advisable not to chase long positions. Only after the price firmly stands above the orange line and 95,000 can we consider it the start of a stronger bullish trend.

Although I have been caught off guard by such false breakouts before, I will not preemptively assume that there will definitely be a false breakout at 95k followed by a retracement. It is best to take it step by step!

@market_beggar

$BTC Technical Bullish Signals: Have I Turned Bullish Again?

From a technical perspective, or more precisely: from a trend structure standpoint, BTC's daily chart has shown a clear bullish signal.

Since I started managing Twitter last December, I have been bearish all the way until now. As a diligent bear, I feel it is necessary to come out and write an analysis,

Discussing my views on the upcoming market.

Previously, I shared my views on the S&P 500, where I introduced the "123 Rule." Interested readers can refer to that. At this moment, BTC's daily chart has completed "1" in yesterday's surge. According to the 123 Rule, a trend change requires the fulfillment of 1, 2, and 3. The current BTC price has already broken through the previous Lower High (88.8K) and created a Higher High.

Next, if it can satisfy: "2: The pullback does not break the previous low, creating a Higher Low" + "3: Creating a new Higher High," then from the perspective of the 123 Rule, we can basically confirm the trend reversal.

However, it must be emphasized that the above discussion is from a "technical" perspective.

As I mentioned in my weekly reports, STH-RP has always been a significant barrier to returning to a bullish trend. The analytical logic of STH-RP can be referenced in this article.

Currently, the position of STH-RP is approximately 92,571. The current price has slightly broken through STH-RP, and whether it can effectively stabilize above it will be the focus in the coming days. Additionally, as mentioned in last week's report, from the perspective of URPD, it can resonate with the viewpoint of STH-RP:

Currently, the information provided by URPD is as follows:

➡️ The range of 81K ~ 85K has accumulated about 1.35 million BTC.

➡️ There are still a large number of trapped chips above 93K (detailed data can be found in the weekly report).

Among them, the chips in the 81K ~ 85K range are, at least from the current perspective, purchased by relatively uncertain "short-term holders."

Therefore, when the price leaves this range, these short-term holders will have the willingness to sell; at the same time, if the future price reaches the position of the upper STH-RP,

In addition to facing the suppression effect of STH-RP itself, the trapped chips at 93K may also experience "unwinding demand."

Based on the above, the conclusions are as follows:

1️⃣ The position of STH-RP is the dividing line between bullish and bearish trends, resonating with the perspective of URPD.

2️⃣ If a strong breakthrough cannot be achieved, it may create an unfavorable situation for the bulls.

3️⃣ If a strong breakthrough occurs, the bulls may gain a leading position.

Furthermore, if a breakthrough truly occurs, the accumulation range of 81 ~ 85K, if not quickly consumed, may become a strong backing for the bulls.

免责声明:本文章仅代表作者个人观点,不代表本平台的立场和观点。本文章仅供信息分享,不构成对任何人的任何投资建议。用户与作者之间的任何争议,与本平台无关。如网页中刊载的文章或图片涉及侵权,请提供相关的权利证明和身份证明发送邮件到support@aicoin.com,本平台相关工作人员将会进行核查。

派网:注册并领取高达10000 USDT
Ad
Share To
APP

X

Telegram

Facebook

Reddit

CopyLink