In 2025, the tariff war escalated comprehensively, with the Trump administration announcing a minimum 10% tariff on goods from almost all countries and imposing higher tariffs on about 60 countries with the largest trade imbalances with the U.S. This caused panic in the global market, with the main logic being:
- Increased tariffs raise corporate costs and compress profit expectations.
- Disruption of global supply chains deepens economic uncertainty.
- Retaliatory tariffs trigger increased trade war risks.
In such an environment, capital market participants will:
- Reduce risk asset allocation (such as stocks and cryptocurrencies).
- Increase safe-haven asset allocation (such as gold, U.S. dollars, and Japanese yen).
- Raise volatility expectations → VIX surges.
Tariffs → Rising costs + Global supply chain disruption + Retaliation risks + Investment pullback + Safe-haven capital flow → Market panic.
The panic index VIX also surged to 60 on April 7. What does this mean? Historically, this has only happened three times, the last being on August 5, 2024, and the first during the COVID-19 pandemic in 2020.
We can confirm that the current VIX index is in an extremely extreme historical environment. In the face of such a situation, how can we use VIX to predict the market?
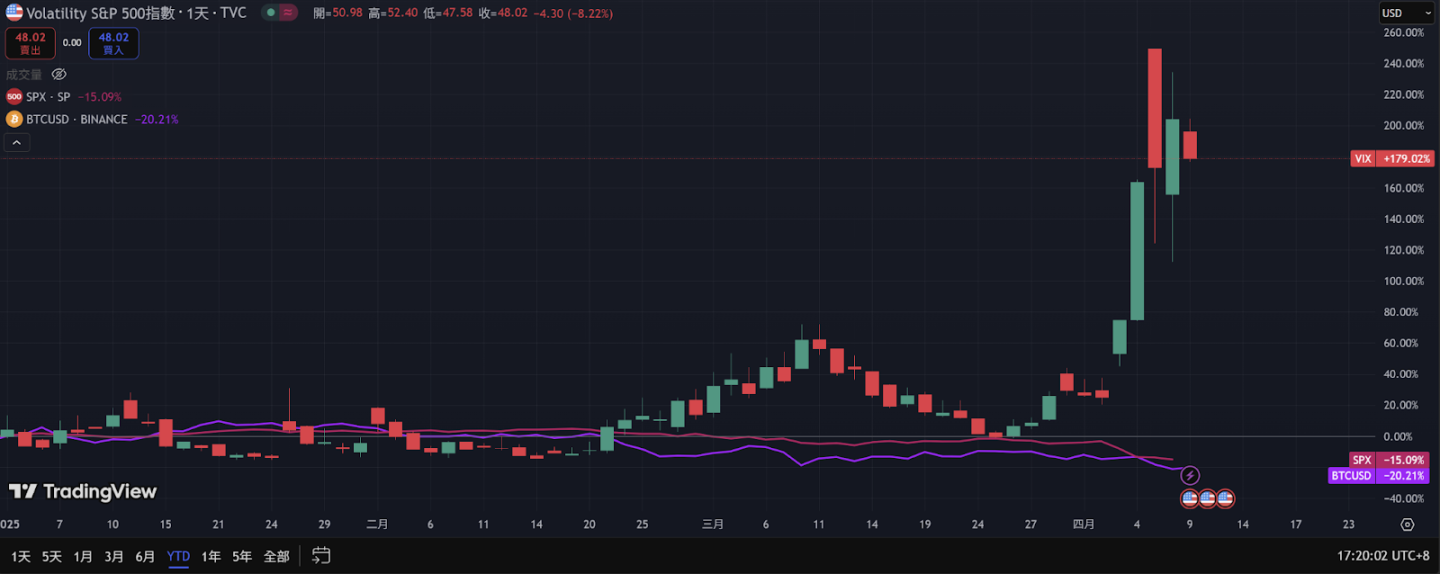
Reference: Tradingview
What is VIX?
VIX is derived from the prices of S&P 500 index options and estimates the expected volatility of the market over the next 30 days. It is regarded as an indicator of market uncertainty and panic sentiment.
In simple terms, a higher VIX indicates that the market expects more severe future volatility and stronger panic sentiment; a lower VIX indicates a calmer market with higher confidence. Historical experience shows that VIX typically surges during significant stock market declines and falls back when the stock market stabilizes. Due to this inverse relationship with the stock market, VIX is also known as the "panic index" or the market's emotional thermometer.
A normal VIX level is around 15–20, which is considered a calm range; when VIX exceeds 25, it indicates that the market is starting to panic; above 35 is considered extreme panic. In extreme crisis events (such as financial crises or pandemics), the VIX index can even soar above 50, reflecting extreme risk-averse sentiment in the market. Therefore, by observing changes in VIX, investors can gain insights into the current strength of market risk-averse sentiment as a reference for adjusting investment allocations.
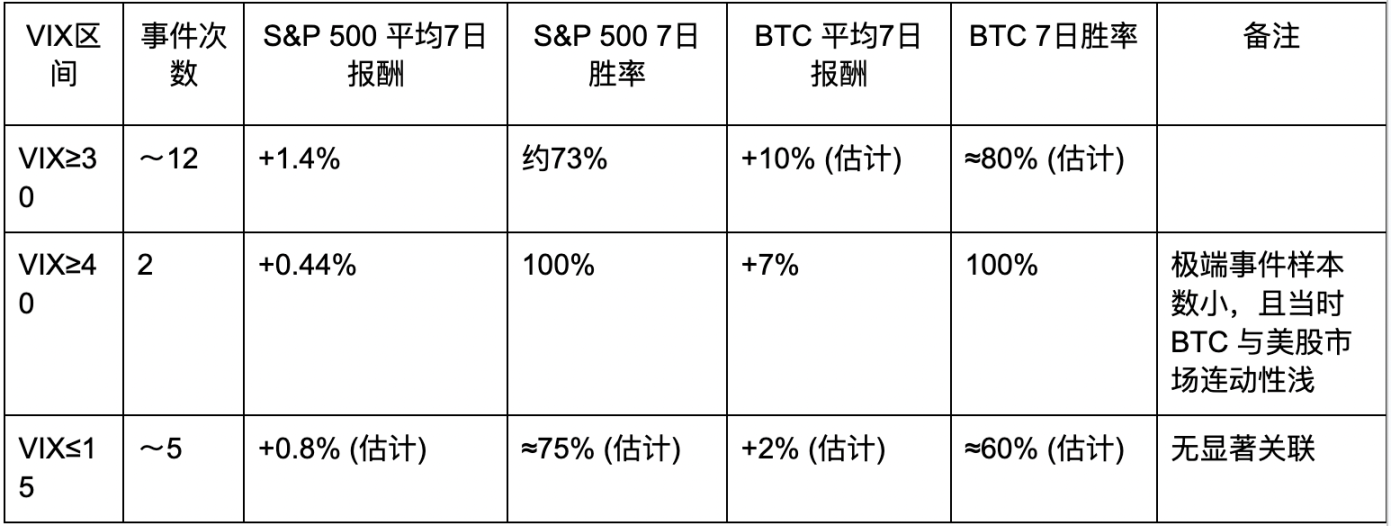
High Volatility Panic Zone: VIX ≥ 30
When the VIX index rises above 30, it usually indicates that the market is in a state of high fear or panic. This situation is often accompanied by sharp declines in the stock market, but historical data shows that after extreme fear, the market often rebounds.
- Sample events: Between 2018 and 2024, there were about a dozen instances when the VIX closed above 30, typical scenarios include the volatility storm in February 2018, the pre-Christmas sell-off in December 2018, pandemic panic in February-March 2020, the retail investor storm in early 2021, and the interest rate hikes and geopolitical shocks in early 2022.
- S&P 500 average performance: Within 7 days after these panic events, the S&P 500 often experiences a positive rebound. Statistics show an average increase of about 1.4%, with about a 73% chance of rising after the event within 7 days.
- This indicates that when VIX surges above 30 (panic zone), the stock market is likely to technically rebound in most cases in the short term.
BTC average performance: Bitcoin also tends to rebound strongly after extreme panic. Statistics estimate that BTC's average 7-day increase is around 10%, with a win rate of about 75–80%. For example, when VIX broke 30 due to geopolitical crises in February 2022, Bitcoin surged over 20% in the following week, showing a similar phenomenon of risk-averse sentiment dissipating and rebounding as seen in the stock market.
Extreme Panic Peak: VIX ≥ 40
When the standard is raised to VIX ≥ 40 (extreme panic), qualifying events during the period from 2018 to 2024 are extremely rare, with only February 5, 2018, and February 28, 2020, when the pandemic triggered a crash that pushed VIX to close above 40 (the first time in four years), and subsequently, VIX soared to an unprecedented 82 points in March.
Due to the limited sample size, statistical results are only for reference: after the 2020 event, the S&P 500 slightly rebounded about 0.6% within 7 days (the market was highly volatile that week but had a slight technical rebound), while BTC rebounded about 7%. Both had a win rate of 100%, but this was solely due to a single event's rise (not indicative of guaranteed rises in future similar situations). Overall, when VIX reaches historical extreme values above 40, it often signifies that extreme panic selling pressure in the market is nearing its peak, and the chances of a short-term rebound are relatively high, generally indicating a relative low point in the larger cycle.
- February 5, 2018 (VIX surged over 100% intraday to nearly 50): The S&P 500 only rose 0.28% a week later, with no significant increase. However, Bitcoin plummeted 16% that day to a local low of ~$6,900, and two weeks later rebounded to over $11,000, showing strong rebound momentum. However, at that time, the correlation between Bitcoin and real-world asset trends was not high, so using VIX to judge Bitcoin's trend was not appropriate.
- Mid-March 2020 (VIX peak 82): The S&P 500 bottomed on March 23 and rebounded over 10% within a week, while Bitcoin quickly surged about 30% from below $4,000.
Although statistically, short-term performance after extreme panic tends to be positive, the scarcity of samples means high uncertainty, and the correlation between Bitcoin and U.S. stocks at that time was not as closely aligned as it is now. In practice, VIX above 40 serves more as a signal confirming that the market is in an extreme panic state, and future market trends still need to be assessed in conjunction with fundamental information.
Low Volatility Zone: VIX ≤ 15
When the VIX index falls below 15, it usually indicates that the market is in a relatively calm state. Investor sentiment is more optimistic, and the demand for safe havens is low. However, subsequent trends are not as consistently clear as during high VIX periods:
- Sample events: Between 2018 and 2024, VIX fell below 15 multiple times, such as after a strong stock market rebound in early 2019, during the stable market period at the end of 2019, during the stock market uptrend in mid-2021, and in mid-2023. During these periods, market volatility was at historically low levels (sometimes referred to as market calm).
- S&P 500 average performance: Within 7 days after VIX events at extremely low levels, the average return of the S&P 500 is about +0.8%, with a win rate of about 60–75% (slightly above random probability). Overall, in low volatility environments, stock indices tend to maintain a gradual upward trend or slight fluctuations. For example, in the week following VIX dropping below 15 in October 2019, the S&P 500 remained stable and slightly reached new highs; in July 2023, when VIX was around 13, the index continued to rise about 2% in the following week. This indicates that low VIX does not necessarily lead to an immediate pullback, and the market may continue to maintain an upward trend for a period. However, it is important to be cautious, as extremely low volatility often implies market complacency, and once unexpected negative news occurs, volatility and declines may significantly amplify.
- BTC average performance: Bitcoin's performance during low VIX periods lacks a clear directional trend. Statistics show its average 7-day increase is only about +2%, with a win rate of about 60%. Sometimes, low VIX calm periods coincide with Bitcoin's own bull market phase (for example, in spring 2019, low VIX accompanied a significant rise in BTC); but at other times, during low VIX periods, BTC may experience a corrective trend (for example, in early 2018, when VIX remained low, Bitcoin was in a downtrend following a bubble burst).
Therefore, low VIX has limited predictive value for BTC's subsequent trends and must be considered alongside the cryptocurrency market's own capital sentiment and cycle considerations.
In summary, when VIX is below 15, the S&P 500 often continues its existing trend (in most cases, a gradual rise), but the magnitude of the rise and win rate are significantly lower than the rebounds following panic. Meanwhile, BTC lacks a unified response pattern in this environment, indicating that low traditional market volatility does not necessarily mean synchronized movements in the cryptocurrency market.
Conclusion: Risks and Opportunities Coexist, Seeking Certainty is Just a Reference
When VIX surges to the 30–40 range
- There may be short-term risks, but it also contains potential reversal opportunities.
- BTC usually declines in sync with panic selling pressure, but as panic sentiment eases, excessive selling can easily trigger a strong technical rebound.
- If VIX starts to peak and fall (from 35 gradually back to below 30), it is a potential time to buy BTC in the short term.
- It is essential to also assess the severity of the event itself; if it is a significant financial risk outbreak, the market may continue to decline further.
When VIX ≥ 40
- This indicates that the market is in extreme panic, including possibilities of liquidity exhaustion and large capital withdrawals.
- The short-term probability of BTC experiencing a significant drop is extremely high, but often a week or two later, if panic eases slightly, BTC's rebound is expected to be relatively impressive.
- In this environment, it is advisable for short-term speculators to maintain high risk control and strictly adhere to stop-losses, as "treading on the edge" entails both profit and risk.
- From a larger cycle perspective, this is generally a relative low point.
When VIX ≤ 15
- The market is generally in a natural state. Whether BTC rises often depends more on the cryptocurrency market's own cycles, capital flows, or technical trends.
- In an overly calm environment, be cautious that once unexpected changes or black swan events occur, VIX may rise rapidly, and BTC may also follow with a decline.
- Consider retaining some cash/stablecoins during this period as a precaution, while keeping an eye on risk trends.
The intermediate area of VIX 15–30
- Generally regarded as the "normal volatility" range. BTC will also be influenced by cryptocurrency cycles and macro capital flows, and at this time, VIX can serve as a supplementary indicator.
- If VIX rises from above 20 to close to 30, it indicates that panic is beginning to rise, necessitating moderate risk prevention; conversely, if VIX gradually falls from 25 to below 20, it indicates that panic is dissipating, and BTC may be relatively stable.
At the time of writing, VIX is at 50, and in the face of uncertainty regarding U.S. tariffs, market sentiment remains in a state of extreme panic; however, markets are always born out of despair.
During the 2020 pandemic, VIX peaked above 80, while the S&P 500 was around 2,300 points. Even after recent panic sell-offs, the S&P 500 remains near 5,000 points, achieving over 100% ROI in five years; at the same time, Bitcoin was at an excellent buying point at just $4,800, and the peak of this bull market reached $110,000, with a maximum increase of nearly 25 times.
Each major drop is often accompanied by market repricing and capital flows; chaos is a ladder, and whether one can use it to climb higher is the key issue of this period.
免责声明:本文章仅代表作者个人观点,不代表本平台的立场和观点。本文章仅供信息分享,不构成对任何人的任何投资建议。用户与作者之间的任何争议,与本平台无关。如网页中刊载的文章或图片涉及侵权,请提供相关的权利证明和身份证明发送邮件到support@aicoin.com,本平台相关工作人员将会进行核查。


