Trump's "killing the chicken to scare the monkey" pauses tariffs on other countries for 90 days: Bitcoin surges 8% taking advantage of the situation.

CN
3 days ago

Trump's "Killing the Chicken to Scare the Monkey" Suspends Tariffs on Other Countries for 90 Days: Bitcoin Soars 8%_aicoin_figure1

Macroeconomic Background: Trump's Tariff Policy Intensifies Global Market Volatility

In the early hours of April 10, 2025, President Trump suddenly announced an increase in tariffs on China to 125%, effective immediately, aimed at punishing China for its "disrespect towards the global market" and paving the way for future renegotiation of trade terms. Meanwhile, the U.S. government decided to suspend new tariffs on all other countries for 90 days, with equivalent tariff levels decreasing by 10%. Following Trump's tariff announcement, the Bitcoin market surged rapidly, rising over 8% within 24 hours, breaking through the $82,000 mark.

Trump's "Killing the Chicken to Scare the Monkey" Suspends Tariffs on Other Countries for 90 Days: Bitcoin Soars 8%_aicoin_figure2

Bitcoin K-Line Analysis: Strong Rebound After Retracement

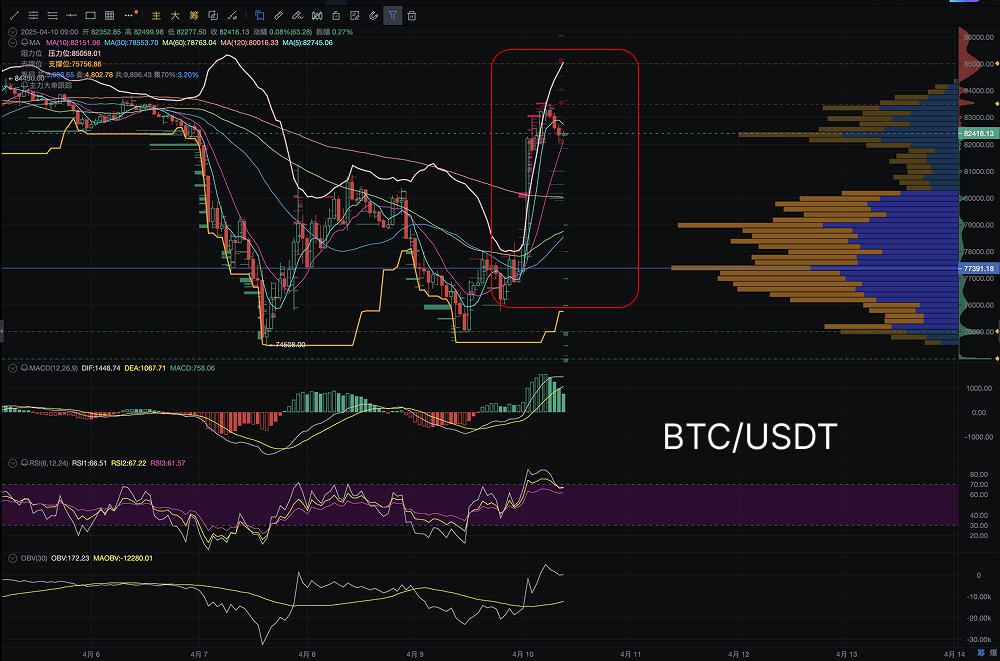
According to AiCoin's Bitcoin K-line chart, the current price has broken through the previous $76,000 area and is approaching $83,000 again.

K-line Pattern Analysis:

On April 10, the K-line for Bitcoin formed a strong bullish candle, with the closing price significantly breaking through the previous resistance area ($79,000), indicating clear rebound momentum.

Bollinger Bands: As the price breaks through the upper band, Bitcoin's volatility has increased in the short term, showing strong market buying power. If it can maintain near the upper Bollinger Band, it may further expand the upward space.

Volume and Trading Concentration:

From the trading concentration area in the chart, the price has just broken through the $83,000 area, indicating a new support area in the market. This breakthrough suggests signs of capital inflow, and relatively stable buying has supported the current rise. An important support level appears at $77,391; if the price dips to this level and holds effectively, the market is expected to welcome a new round of increases.

Technical Indicator Analysis:

  • MACD: The MACD DIF line has broken through the DEA line, and the MACD histogram is gradually increasing, indicating enhanced upward momentum. The current MACD is in a bullish arrangement, which is a strong buy signal.
  • RSI: The RSI (14) is currently at 66.51, close to the overbought range but not yet at the limit, indicating that there is still room for upward momentum and the market is not overheated.
  • OBV (On-Balance Volume): OBV shows continuous capital inflow, supporting Bitcoin's rebound. Accelerated capital inflow indicates that the current upward trend may continue.

Support and Resistance:

  • Support Level: According to the VPVR chart, the current support level is at $77,391, which is a relatively dense trading area recently. If the price retraces to this level, it is expected to face strong support.
  • Resistance Level: There is significant resistance above, especially in the $85,000 range, which is an important pressure point for Bitcoin in the short term. If the price breaks through this range, it may initiate a new wave of increases.

Market Sentiment and Capital Flow: The Impact of Trump's Policies

Trump's tariff policy undoubtedly increases market uncertainty, but for Bitcoin, more capital inflow is a positive signal. The U.S. announcement to suspend new tariffs on other countries and reduce equivalent tariff levels suggests that the global trade environment may gradually stabilize. Investors' demand for safe-haven assets has increased, leading to capital inflow into digital assets like Bitcoin, thus driving up its price. Additionally, signs of large capital movements are becoming increasingly evident.

Today's Trend Prediction

  1. Short-term Expectations:

If Bitcoin continues to maintain above $83,000 and does not fall below the $77,391 support level, it may challenge the next resistance level at $85,000.

It is expected that today's (April 10) price fluctuations will oscillate between $82,000 and $85,000. If it breaks through $85,000, a new round of increases may begin, with a target looking towards $90,000.

  1. Mid-term Outlook:

In the mid-term, Bitcoin still has upward potential, especially considering the changes in the global trade environment and the positive signals from technical indicators. If the price continues to maintain at current levels and breaks through resistance, it may test new highs in the coming days.

This article only represents the author's personal views and does not reflect the stance and views of this platform. This article is for information sharing only and does not constitute any investment advice to anyone.

AiCoin Official Website: aicoin.com

Telegram: t.me/aicoincn

Twitter: x.com/AiCoinzh

Email: support@aicoin.com

Group Chat: Customer Service Yingying, Customer Service KK

免责声明:本文章仅代表作者个人观点,不代表本平台的立场和观点。本文章仅供信息分享,不构成对任何人的任何投资建议。用户与作者之间的任何争议,与本平台无关。如网页中刊载的文章或图片涉及侵权,请提供相关的权利证明和身份证明发送邮件到support@aicoin.com,本平台相关工作人员将会进行核查。


ad
Bybit: $50注册体验金,$30000储值体验金
Ad
Share To
APP

X

Telegram

Facebook

Reddit

CopyLink