交易理念:大周期看趋势,小周期找点位;
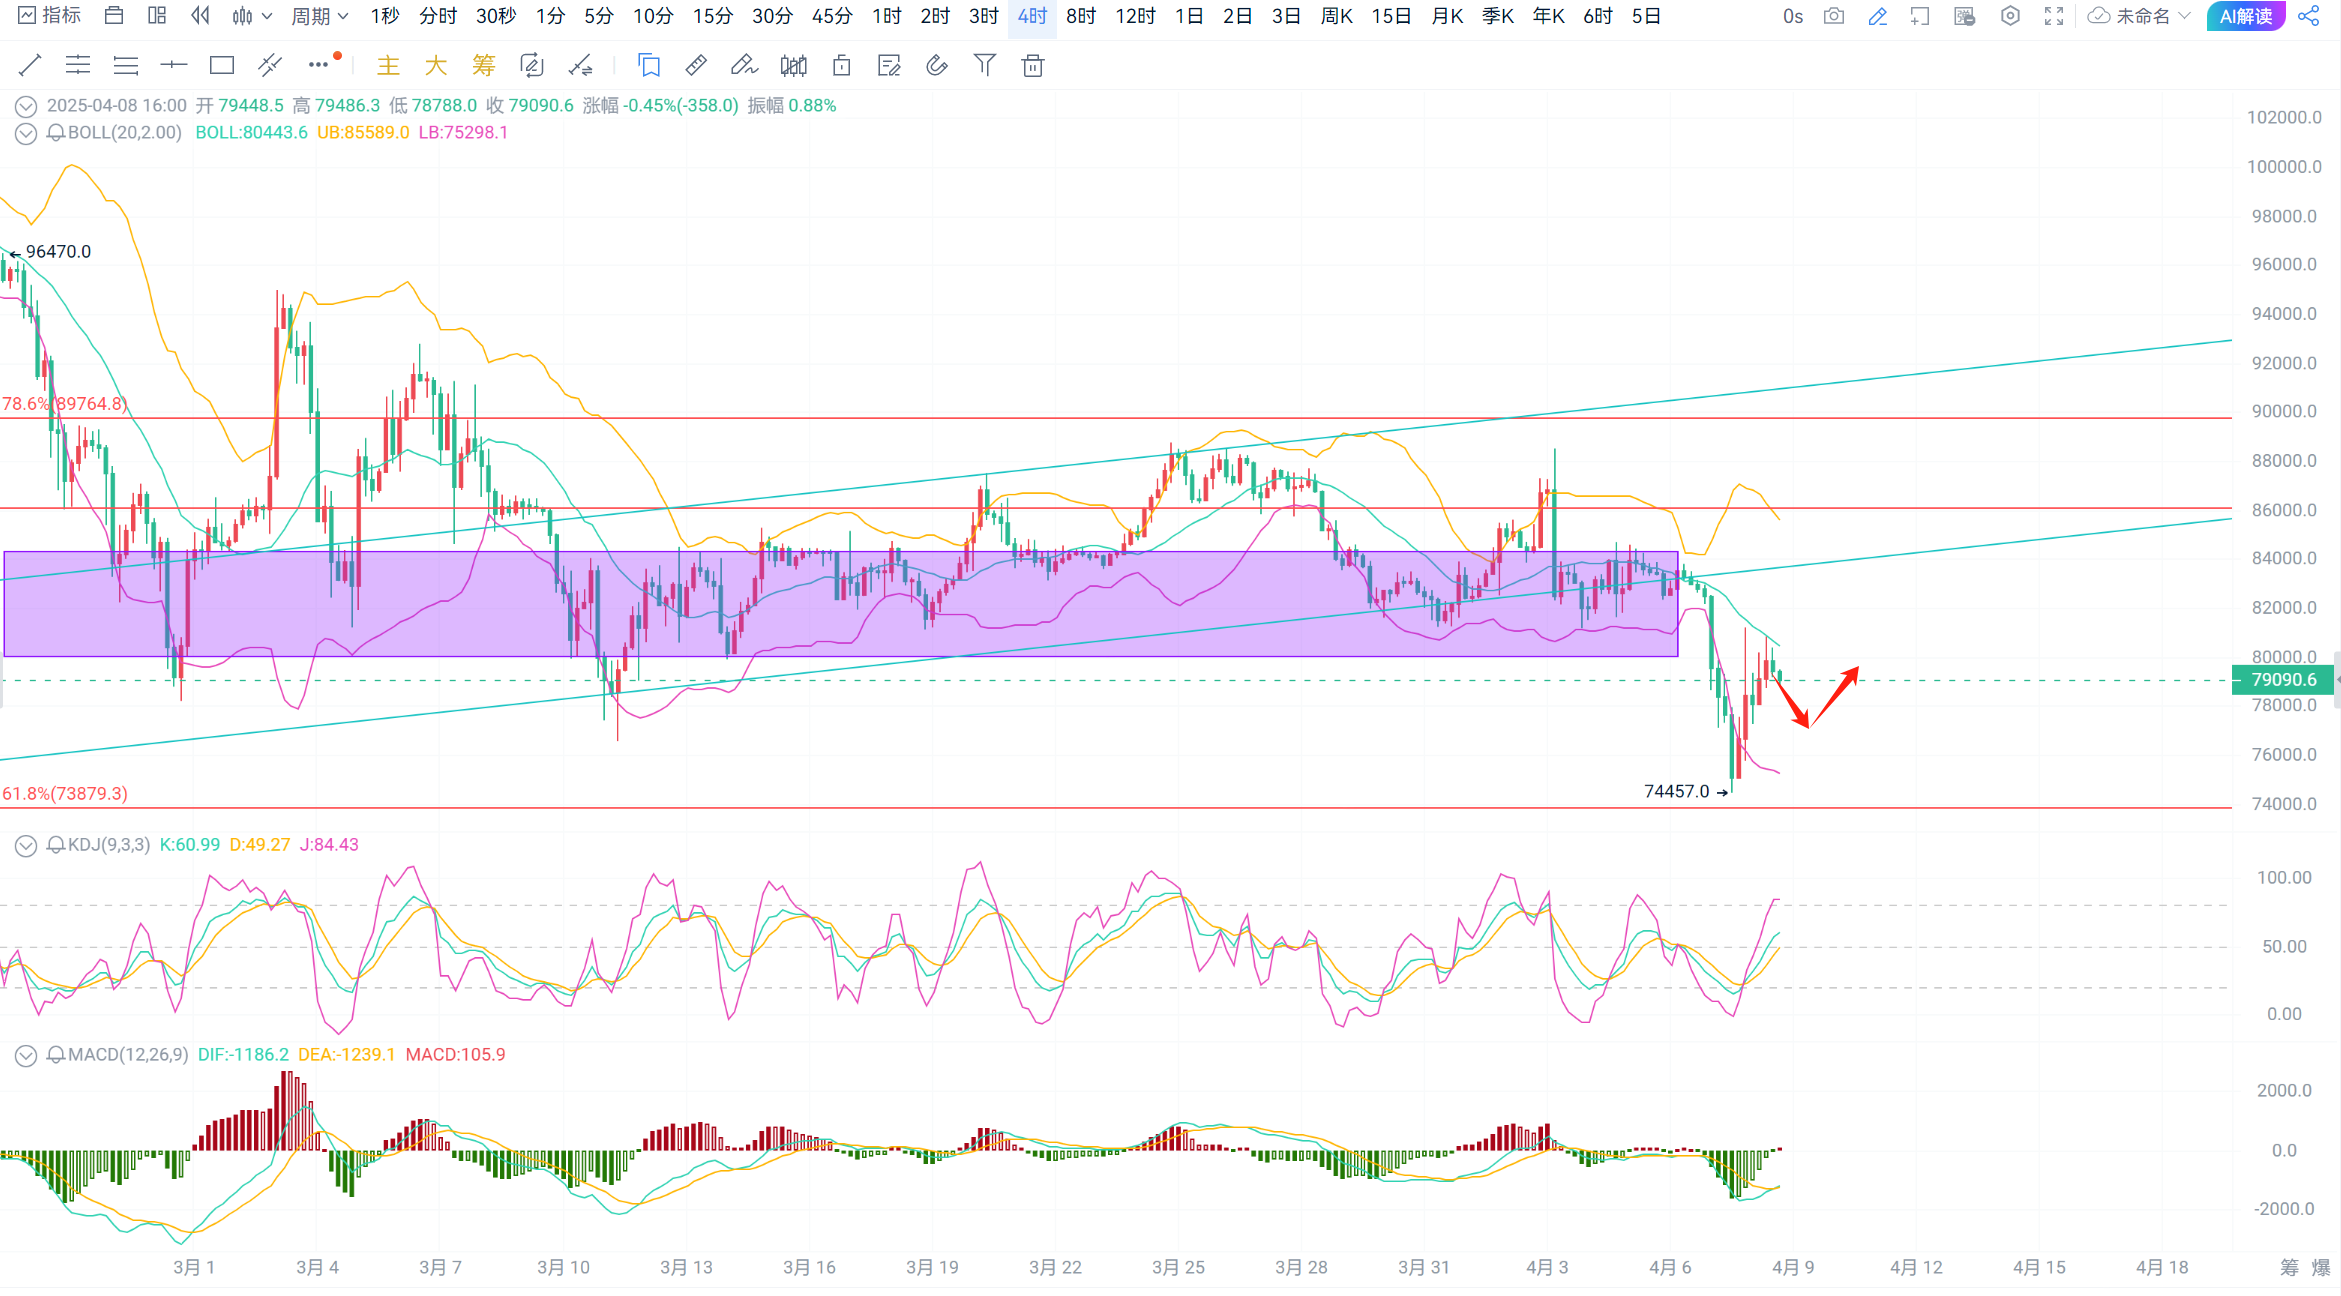
技术分析:比特币方面,日线级别收下插针阳K在79100附近,布林带开始向下张口运行,MACD均线继续向下运行,空头量能继续放量,KDJ线开始平缓向上运行,4时线级别,布林带继续向下张口运行,MACD均线开始平缓向上运行,多头量能开始放量,KDJ线向上运行;
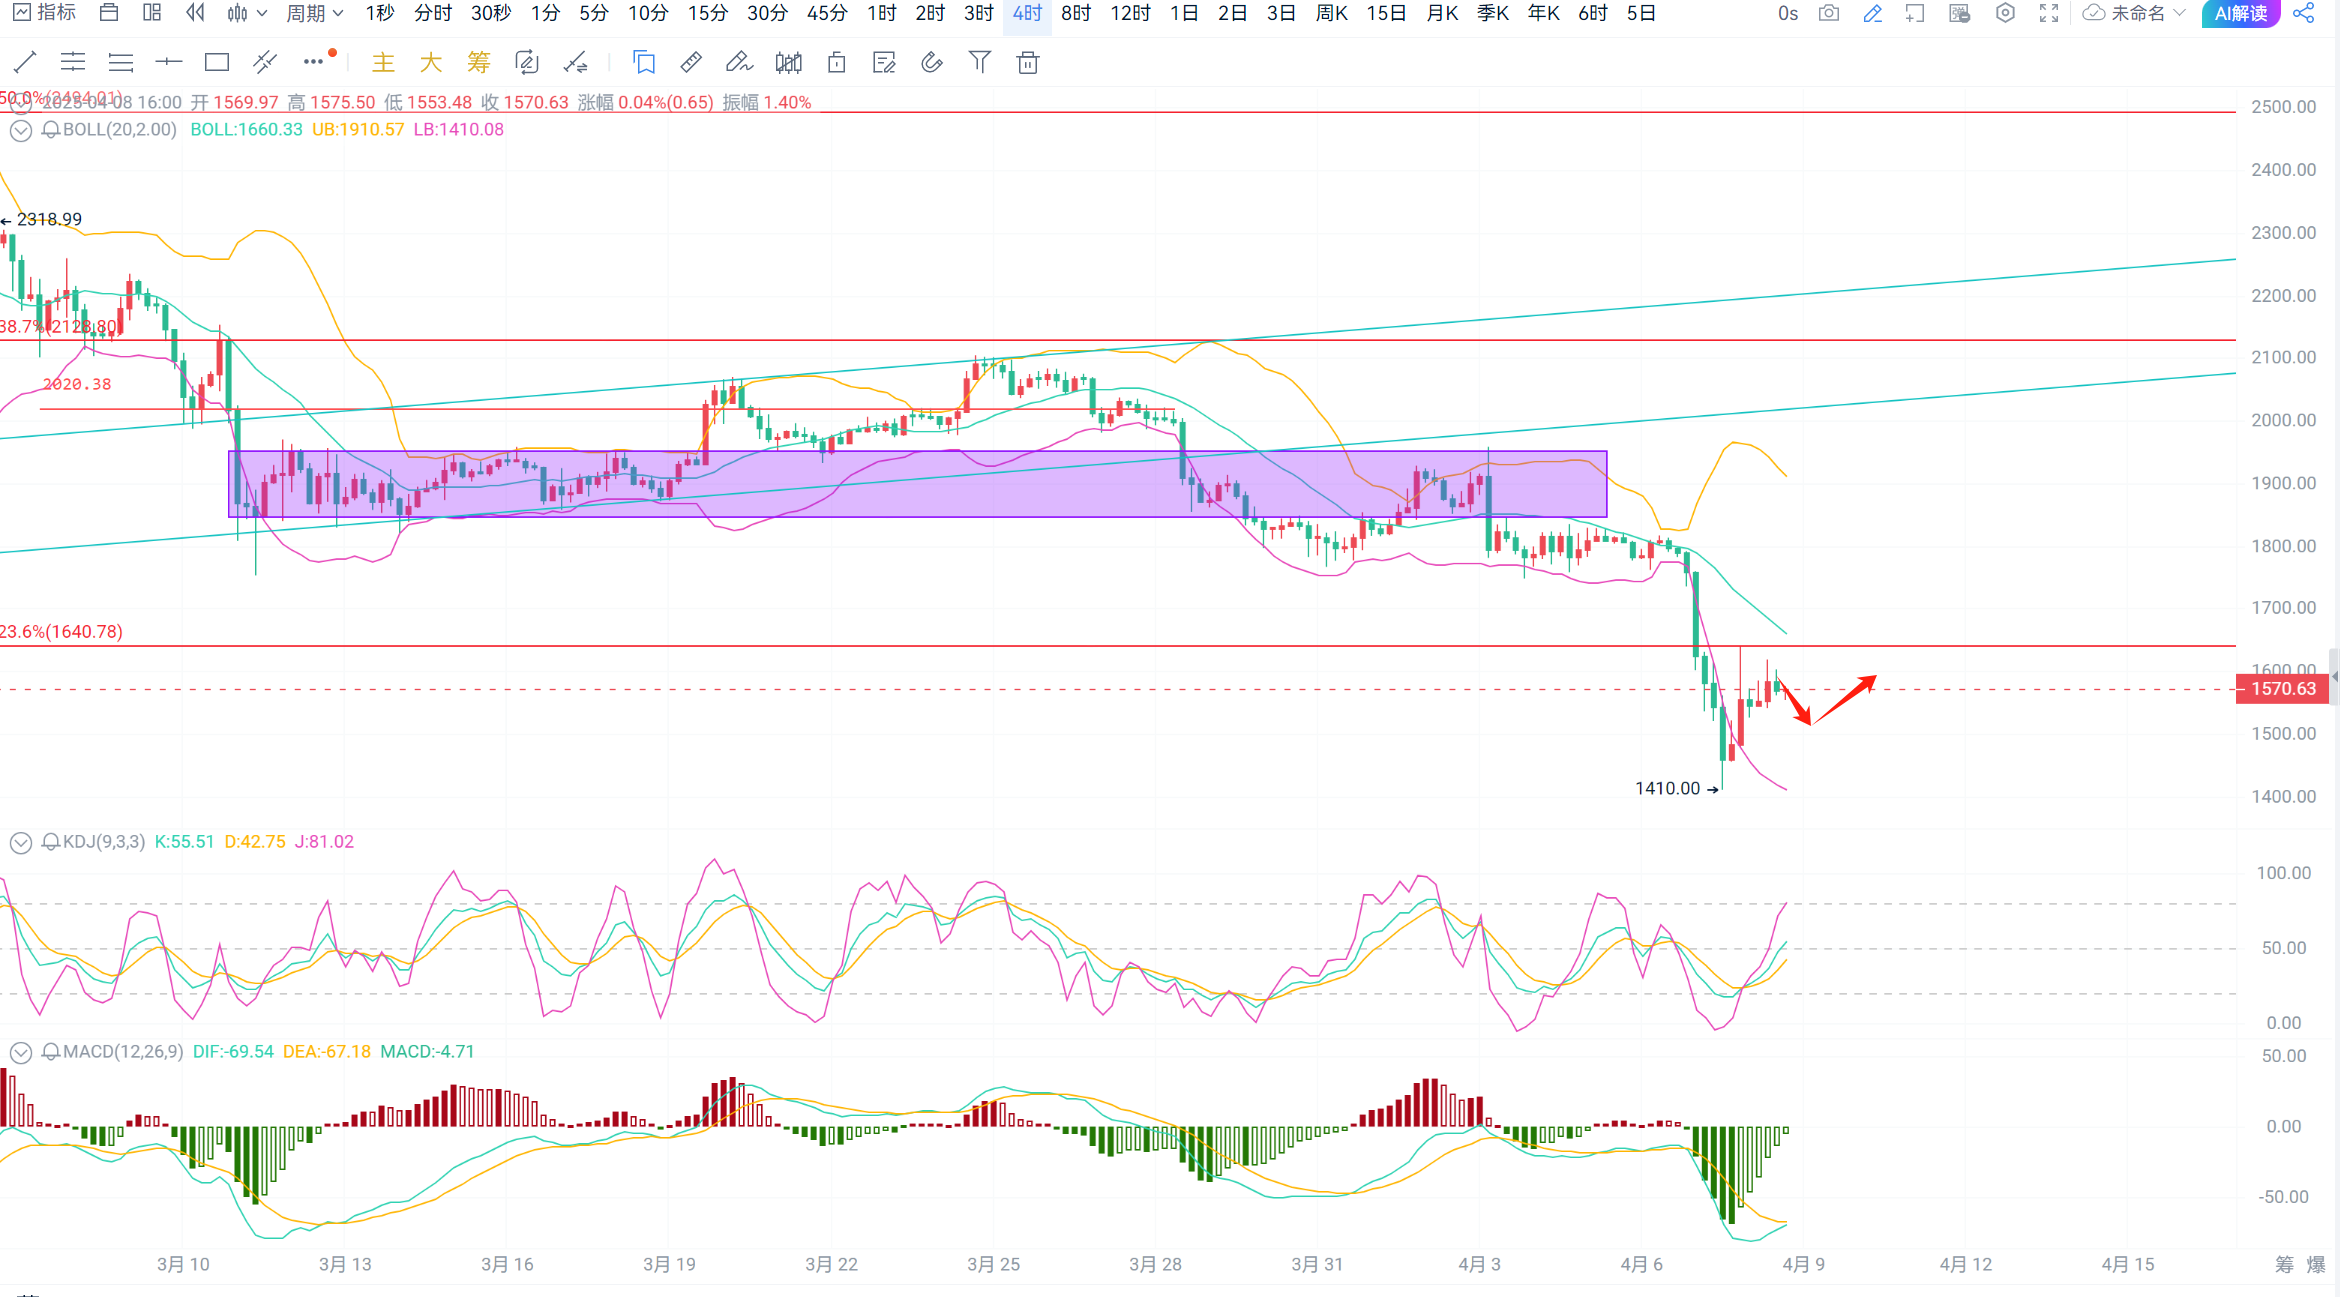
以太坊方面,日线级别收下插针阴K在1550附近,布林带开始向下张口运行,MACD均线继续向下运行,空头量能继续放量,KDJ线开始平缓向上运行,4时线级别,布林带继续向下张口运行,MACD均线继续平缓运行,空头量能继续缩量,KDJ线开始平缓向上运行;
目前行情总体超跌后开始盘整,后续操作建议支撑位附近做多!
操作建议:低位做多!
比特币77500-78000做多,目标79000-80000,防守76500;
以太坊1510-1530做多,目标1600-1650,防守1480;
策略具有时效性,具体以私下实时指导为准!
扫描下方二维码,关注微信公众号,了解更多实时行情动态!

免责声明:本文章仅代表作者个人观点,不代表本平台的立场和观点。本文章仅供信息分享,不构成对任何人的任何投资建议。用户与作者之间的任何争议,与本平台无关。如网页中刊载的文章或图片涉及侵权,请提供相关的权利证明和身份证明发送邮件到support@aicoin.com,本平台相关工作人员将会进行核查。


