Cryptocurrency Market March Report: Breaking Through the Fog of the Trade War, BTC May Experience a Reversal in Q2

CN
PANews
Follow
18 hours ago

Author: 0xWeilan

The chaos and concerns triggered by Trump's tariff war, combined with the rebound in U.S. inflation expectations, have strengthened the market's anticipation that the U.S. economy may face "stagflation" or even "recession." This is extremely bearish for high-risk assets.

This expectation has impacted the valuations of U.S. stocks, which have been at high levels for two consecutive years, and has subsequently transmitted to the crypto market through BTC ETFs.

Short-term investors in BTC have sold off to lock in the maximum loss of this cycle, completing the latest pricing of BTC. Long-term holders have shifted from "reducing holdings" to "increasing holdings," absorbing some of the sell-off, causing the price to reach a new equilibrium around $82,000. However, the market remains fragile, with short positions still at high levels. If the chaos in U.S. stocks leads to BTC ETF fund sell-offs, short positions will inevitably participate in the sell-off, resulting in a price correction.

Currently, the moderate adjustment in U.S. stocks is basically complete, but further movements will depend on the extent of the explosion triggered by the tariff war on April 2, as well as whether the employment data in March shows a significant decline. If both exceed expectations for deterioration, further downward pricing will occur.

The reverse is also true. As chaos subsides, both U.S. stocks and BTC have experienced significant corrections, and the panic and sell-off have been released to a considerable extent.

We believe that as the negative impact of the tariff war gradually diminishes and the Federal Reserve gradually resumes interest rate cuts, it is highly probable that BTC will see a reversal in the second quarter.

Macroeconomic Finance: Economic and Employment Data Strengthen Expectations of "Stagflation" or Even "Recession," U.S. Stocks Break Down

After the "Trump 2.0 trade" cooled down, U.S. stocks have essentially returned to the starting point of November 6, 2024, the day Trump was elected. A new trading judgment framework was initially established at the end of February, and throughout March, various economic, employment, and interest rate data were continuously released to inform this judgment framework.

This judgment framework revolves around the potential for "economic stagflation" or even "economic recession" triggered by Trump's tariff policy, and the Federal Reserve's choice between prioritizing employment or prioritizing inflation reduction.

On March 7, the U.S. Bureau of Labor Statistics first released the employment data for February: Non-farm employment increased by 151,000, below the market expectation of 170,000, indicating a slowdown in job growth, but still relatively robust. The unemployment rate rose from 4.0% in January to 4.1%, suggesting a slight loosening in the labor market. Average hourly wages increased by 0.3% month-on-month and 4.0% year-on-year, exceeding the inflation rate, indicating an improvement in real wages, but potentially putting pressure on inflation.

This "acceptable" employment data partially alleviated concerns that the economy had already begun to decline, leading to a brief drop followed by a rise in U.S. stocks. However, concerns remain, as the employment data fell short of expectations, and the unemployment rate is also rebounding.

On March 12, the U.S. Department of Labor released CPI data: The overall consumer price index for February increased by 0.2% month-on-month and 2.8% year-on-year, slightly down from January's 3.0%. The core CPI (excluding food and energy) increased by 0.2% month-on-month and 3.1% year-on-year, indicating a moderation in inflation, but core inflation remains above the Federal Reserve's 2% target.

The PCE data, which the Federal Reserve pays more attention to, was released on the 28th, showing: The overall personal consumption expenditure price index increased by 0.3% month-on-month and 2.5% year-on-year; core PCE increased by 0.4% month-on-month and 2.8% year-on-year, reflecting that the downward path of inflation is hindered, and core indicators are quite sticky.

The PCE data indicates that the overall personal consumption expenditure price index increased by 0.3% month-on-month and 2.5% year-on-year, higher than January's 2.5%; core PCE increased by 0.4% month-on-month and 2.79% year-on-year, higher than January's 2.66%.

Although the magnitude is small, both CPI and PCE indicate that price growth has begun to rebound, which means that the Federal Reserve's goal of reducing inflation is facing severe challenges.

After a two-day interest rate meeting on the 18th and 19th, the Federal Reserve announced that it would maintain the federal funds rate at 4.25% to 4.50%, marking the second consecutive pause in rate cuts. The statement noted that economic activity is steadily expanding, the labor market is solid, but inflation remains slightly high, especially with increased uncertainty in the economic outlook due to Trump's policies. This was the first time the Federal Reserve explicitly stated that tariff policies could impact economic downturns, but the risk of recession "has increased, but is still not high."

Possibly out of concern for the jittery U.S. stock market, Federal Reserve Chairman Powell stated that inflation may be delayed in returning to the 2% target due to tariffs and other policies, and hinted that if the labor market deteriorates, rate cuts would be implemented. As a preemptive measure against the impact of tariffs, the Federal Reserve reduced the cap on U.S. Treasury bond sales from $25 billion per month to $5 billion per month.

The Federal Reserve's relatively "dovish" stance boosted the market, driving a significant rebound in the three major stock indices. By the end of the month, the CME Fed Watch board indicated that the market had raised the expectation of rate cuts in 2025 to three times for the first time. Goldman Sachs also predicted three rate cuts this year.

On the 28th, the University of Michigan released the final consumer confidence index for March, which fell from 64.7 in February to 57, a slight decline from the initial value of 57.9, and lower than the median estimate of surveyed economists. Consumers expect an annual inflation rate of 4.1% over the next 5 to 10 years, the highest since February 1993, up from the initial value of 3.9%. The expectation for inflation over the next year is 5%, the highest level since 2022.

The University of Michigan consumer confidence index is subjective data but fully reflects the decline in end-consumer confidence. On the same day, the Atlanta Federal Reserve's GDPNow model showed that as of the 28th, the forecast for the U.S. first-quarter real GDP growth rate was -2.8%. This figure resonates with the University of Michigan consumer confidence index, and as in February, the three major stock indices responded with significant declines, with the VIX index soaring 11.9% in a single day.

Crypto Market March Report: Breaking Through the Fog of the Tariff War, BTC May Welcome a Reversal in Q2 University of Michigan Consumer Confidence Index

Regarding Trump's tariff policy, there have been multiple back-and-forth developments this month. As of the end of March, tariffs on Canada, Mexico, and China, as well as on steel and aluminum products, have been implemented.

Starting April 2, the U.S. will impose a 25% tariff on all imported cars, covering passenger cars and light trucks. A 25% tariff will also be imposed on core automotive components (such as engines, transmissions, and electrical systems), effective no later than May 3.

Pending is the implementation of "reciprocal tariffs" on major trade deficit countries, with a specific list to be released on April 2. April 2 is currently viewed by the market as the most critical day in the tariff war.

Due to concerns over tariff uncertainty and "economic stagflation" or even "economic recession," funds continued to withdraw from the equity market in March, leading to declines of 8.21%, 5.75%, and 4.20% in the Nasdaq, S&P 500, and Dow Jones, respectively, breaking or nearing the 250-day moving average, achieving a moderate technical adjustment.

Safe-haven funds flowed into U.S. Treasuries, pushing the two-year Treasury yield down by 1.15% for the month. The 10-year Treasury yield fell by 0.45%, but combined with inflation expectations, long-term funds' expectations for long-term economic growth have dropped to negative growth levels.

Another safe-haven asset favored by mainstream funds, gold, received significant attention, with London gold officially breaking through the 3,000 yuan mark this month, rising 8.51% in a single month to $3,123.97 per ounce.

Low consumer confidence, rising inflation expectations, and a pessimistic outlook on U.S. economic growth, coupled with concerns that the unpredictable and volatile tariff war could push the U.S. economy into "stagflation" and "recession." EMC Labs assesses that the uncertainty of Trump's tariffs is the biggest variable, which is driving the deterioration of the U.S. economy and consumer confidence, thereby pushing the market towards "stagflation" and "recession" trades. With Powell's relatively "dovish" remarks, the market began to speculate on the Federal Reserve's intervention in rate cuts in June, and as U.S. stocks fell, the number of expected rate cuts increased from two to three. The inflation issue may be temporarily set aside, but it has not disappeared; rather, it is likely to intensify with the tariff war. The impact of the tariff war will only be seen after it is settled.

Crypto Assets: Operating in a Downward Channel, Extreme Market Conditions May Drop to $73,000

Trader anxiety and fear dominated the turbulence in the capital markets in March. BTC remained relatively stable in March due to the significant drop at the end of February, but the rebound was weak, ultimately recording a 2.09% monthly decline.

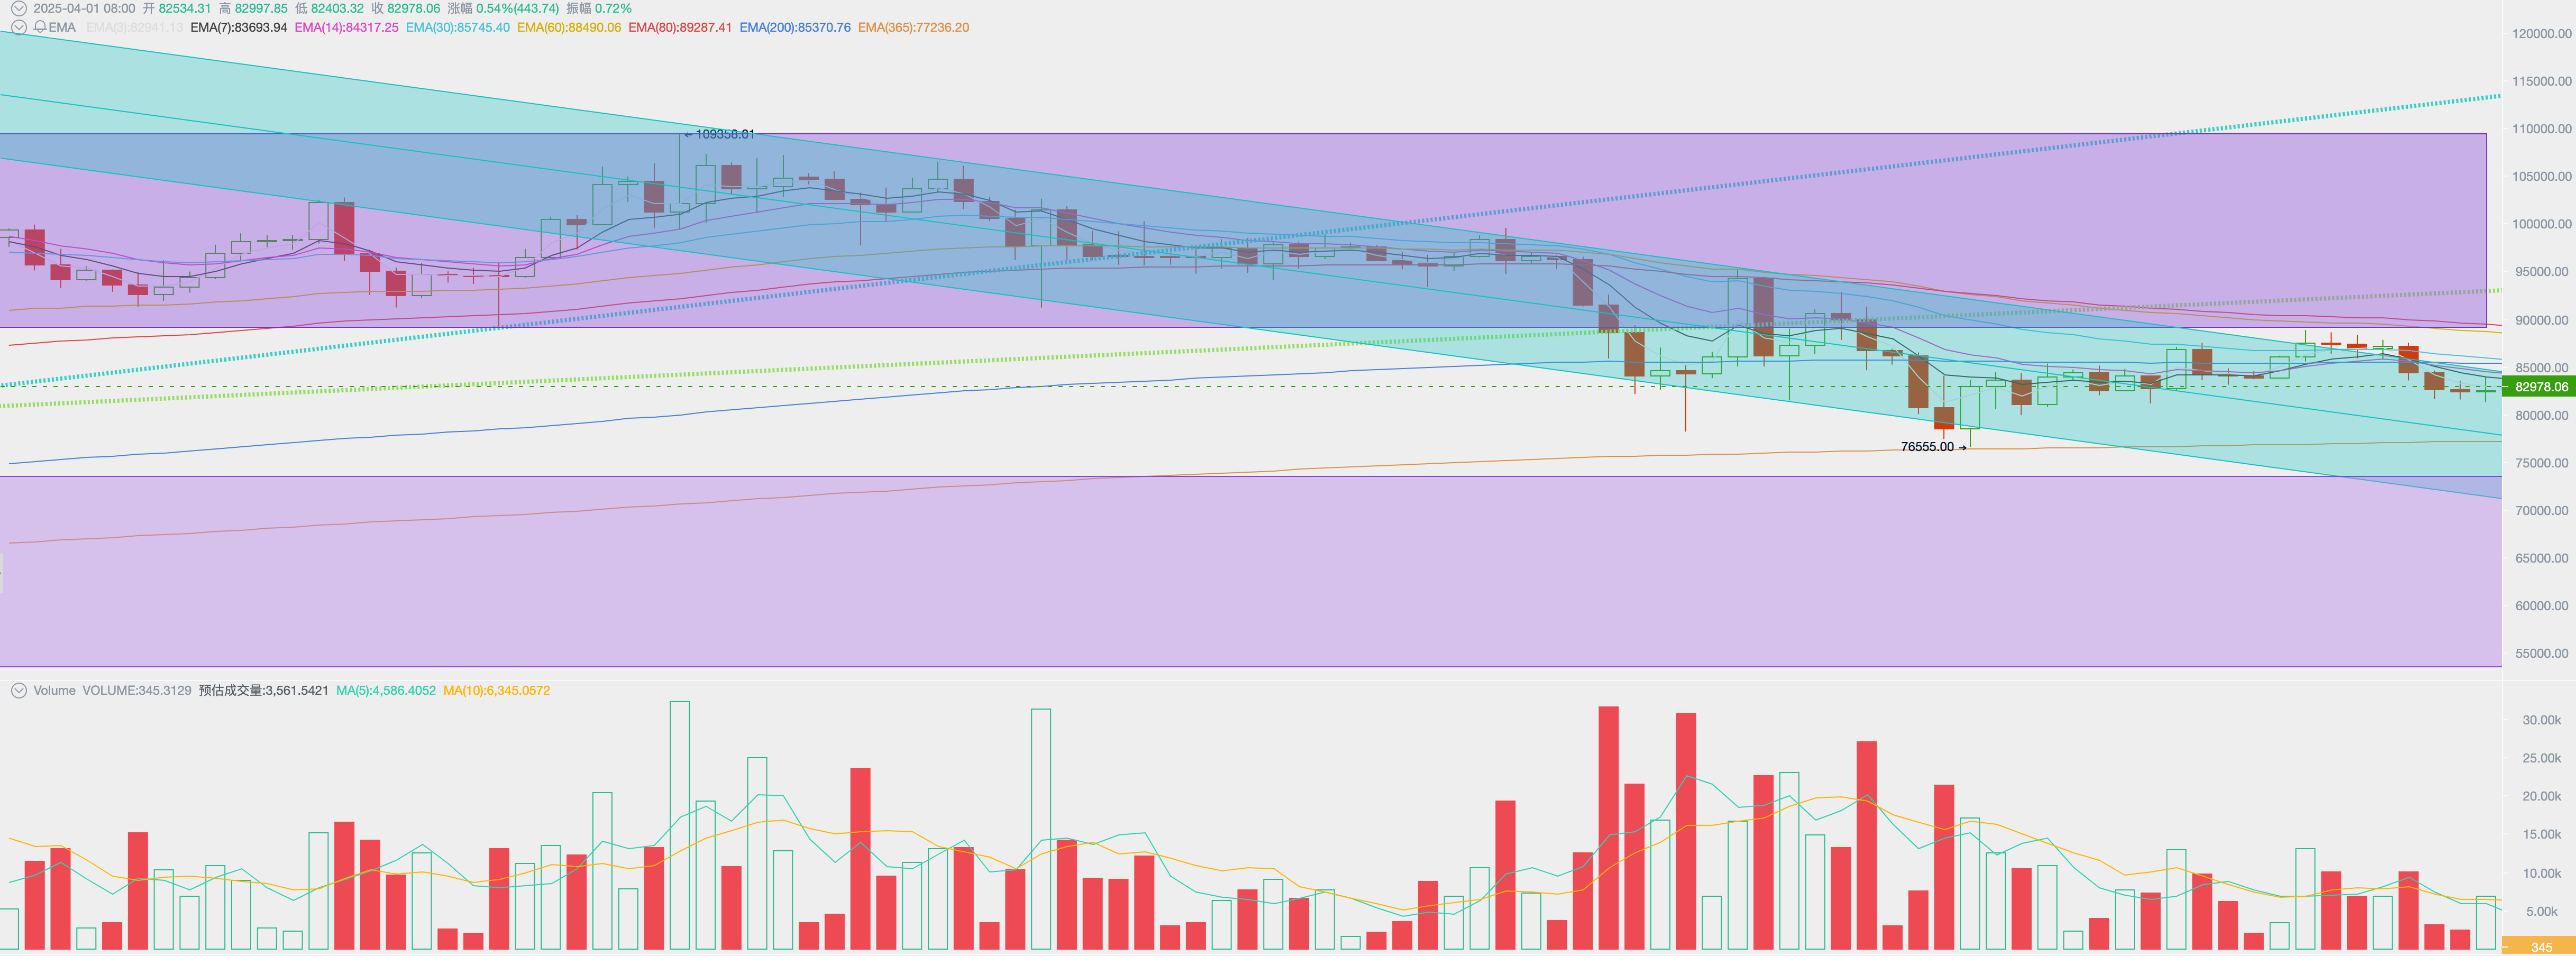
Crypto Market March Report: Breaking Through the Fog of the Tariff War, BTC May Welcome a Reversal in Q2 In February, BTC opened at $84,297.74, closed at $82,534.32, reached a high of $95,128.88, and a low of $76,555.00, with a volatility of 22.03% and a slight increase in trading volume compared to the previous month.

In terms of time, following the significant sell-off at the end of February, BTC began a technical rebound in the second and third weeks of March, but the rebound was weak, with a maximum increase of only 16% from the low point. In the following week, as the U.S. tariff policy became chaotic and inflation data, especially consumer confidence data, declined, BTC fluctuated downward along with U.S. stocks, ultimately recording a monthly decline.

Technically, BTC operated within the downward channel since February, below the first upward trend line of this cycle. After the sell-off at the beginning of the month, trading enthusiasm sharply decreased, with trading volume declining week by week. For most of the month, it operated below the 200-day moving average, briefly touching the 365-day moving average on March 11.

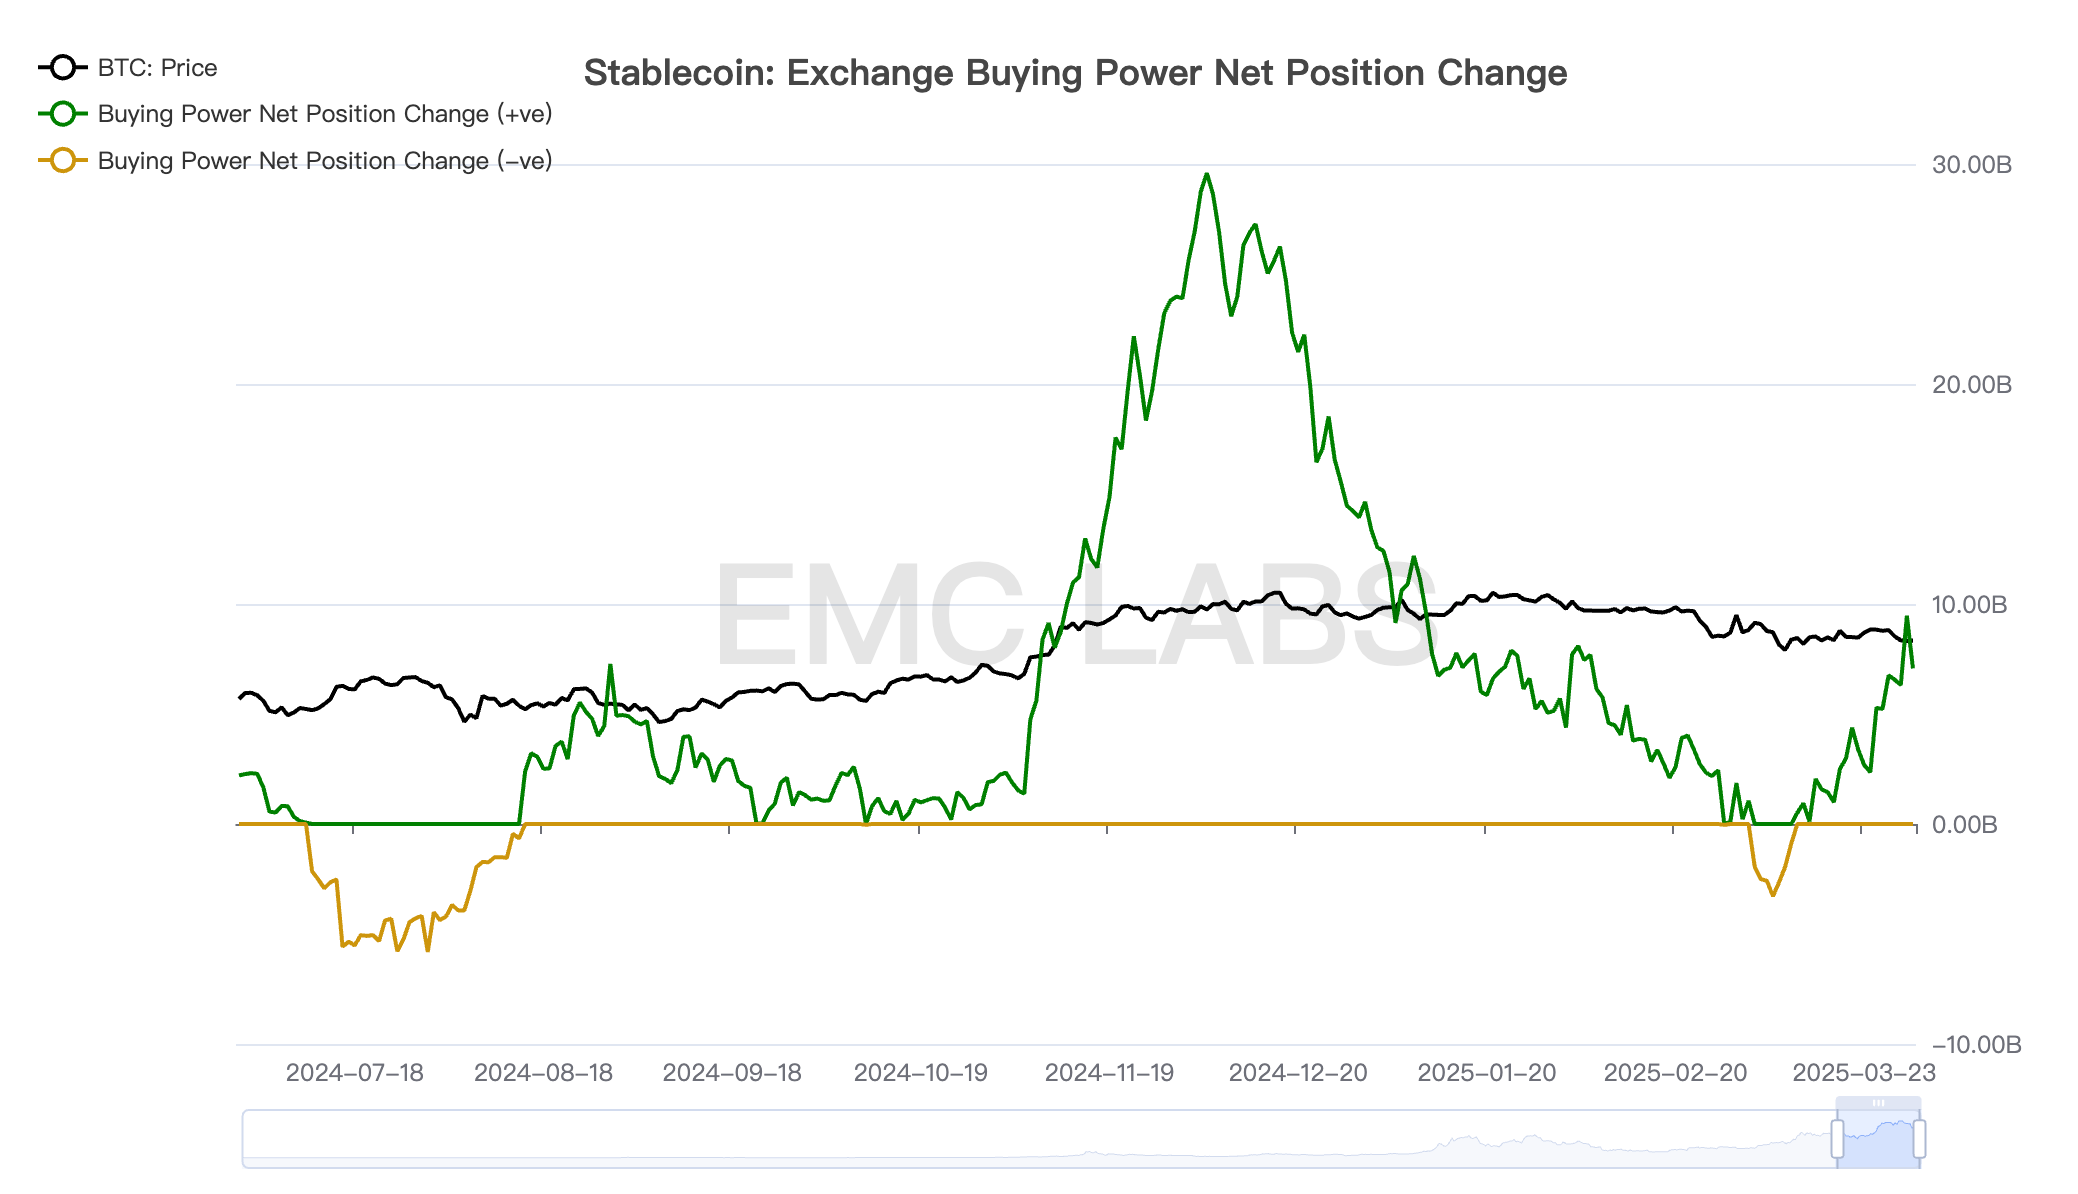
Although there was an outflow of BTC from centralized exchanges throughout the month, and a small amount of funds flowed into BTC ETFs, BTC, as a high-risk asset, still struggled to attract buying power against the backdrop of a jittery U.S. stock market.

On the policy front, there were many favorable developments this month.

On March 6, President Trump signed an executive order to officially establish a "Strategic Bitcoin Reserve" (SBR), incorporating approximately 200,000 BTC previously confiscated by the federal government into the reserve, and clearly stating that these assets would not be sold within the next four years. The order also proposed establishing a reserve consisting of digital assets other than Bitcoin, aimed at enhancing the U.S. position in the global financial system through diversified assets. This marks the first time Bitcoin has been managed as a permanent national asset by the U.S. government, establishing its status as "digital gold." Although the executive order is not legislation, it lays the groundwork for future policies.

On March 7, the day after signing the executive order, Trump held a White House crypto summit, inviting many industry and capital figures to discuss crypto industry regulation, reserve policies, and future development directions. This summit further signaled the U.S. government's support for crypto innovation.

On March 29, the Federal Deposit Insurance Corporation (FDIC) released guidelines clarifying the compliance process for banks participating in cryptocurrency-related activities, providing a clear path for traditional financial institutions to enter the crypto market.

On the same day, Trump granted clemency to three co-founders of the cryptocurrency exchange BitMEX.

At the state level, on March 6, Texas proposed establishing a state-level Bitcoin strategic reserve, which has entered the legislative "intent notice" stage, typically indicating a high likelihood of the bill's passage. On March 31, the California legislature officially submitted the "Bitcoin Rights Act," aimed at clarifying Bitcoin's legal rights and usage regulations within the state.

All of the above indicates that BTC and crypto assets are being concretely established in the U.S. These policies and regulations will take time to take effect, but they are undoubtedly clearing obstacles for the U.S. to build a "crypto capital" in the future.

However, concerns over "stagflation" and "inflation" dominated the market, and risk-averse traders chose to ignore these long-term positives, leading to a short-term decline in BTC prices.

Perhaps supported by long-term positives, BTC remains in a relatively strong position compared to U.S. stocks, which have returned to the November 6 level. This month, the closing price was $82,378.98, still above the $70,553 on November 5.

Considering the lack of liquidity, if tariffs exceed expectations or worse employment and economic data are released, BTC may not rule out retracing all the gains from the "Trump trade," falling to the $70,000 to $73,000 range. However, this would only occur in the case of a significant deterioration in tariffs or employment data. If U.S. stocks can gradually stabilize after the "liberation day" tariff negatives are fully released on April 2, the previous $76,000 may become the low point of this round of sell-off.

Funds: BTC Spot ETF Outflows Slow, Stablecoins Continue to Flow In

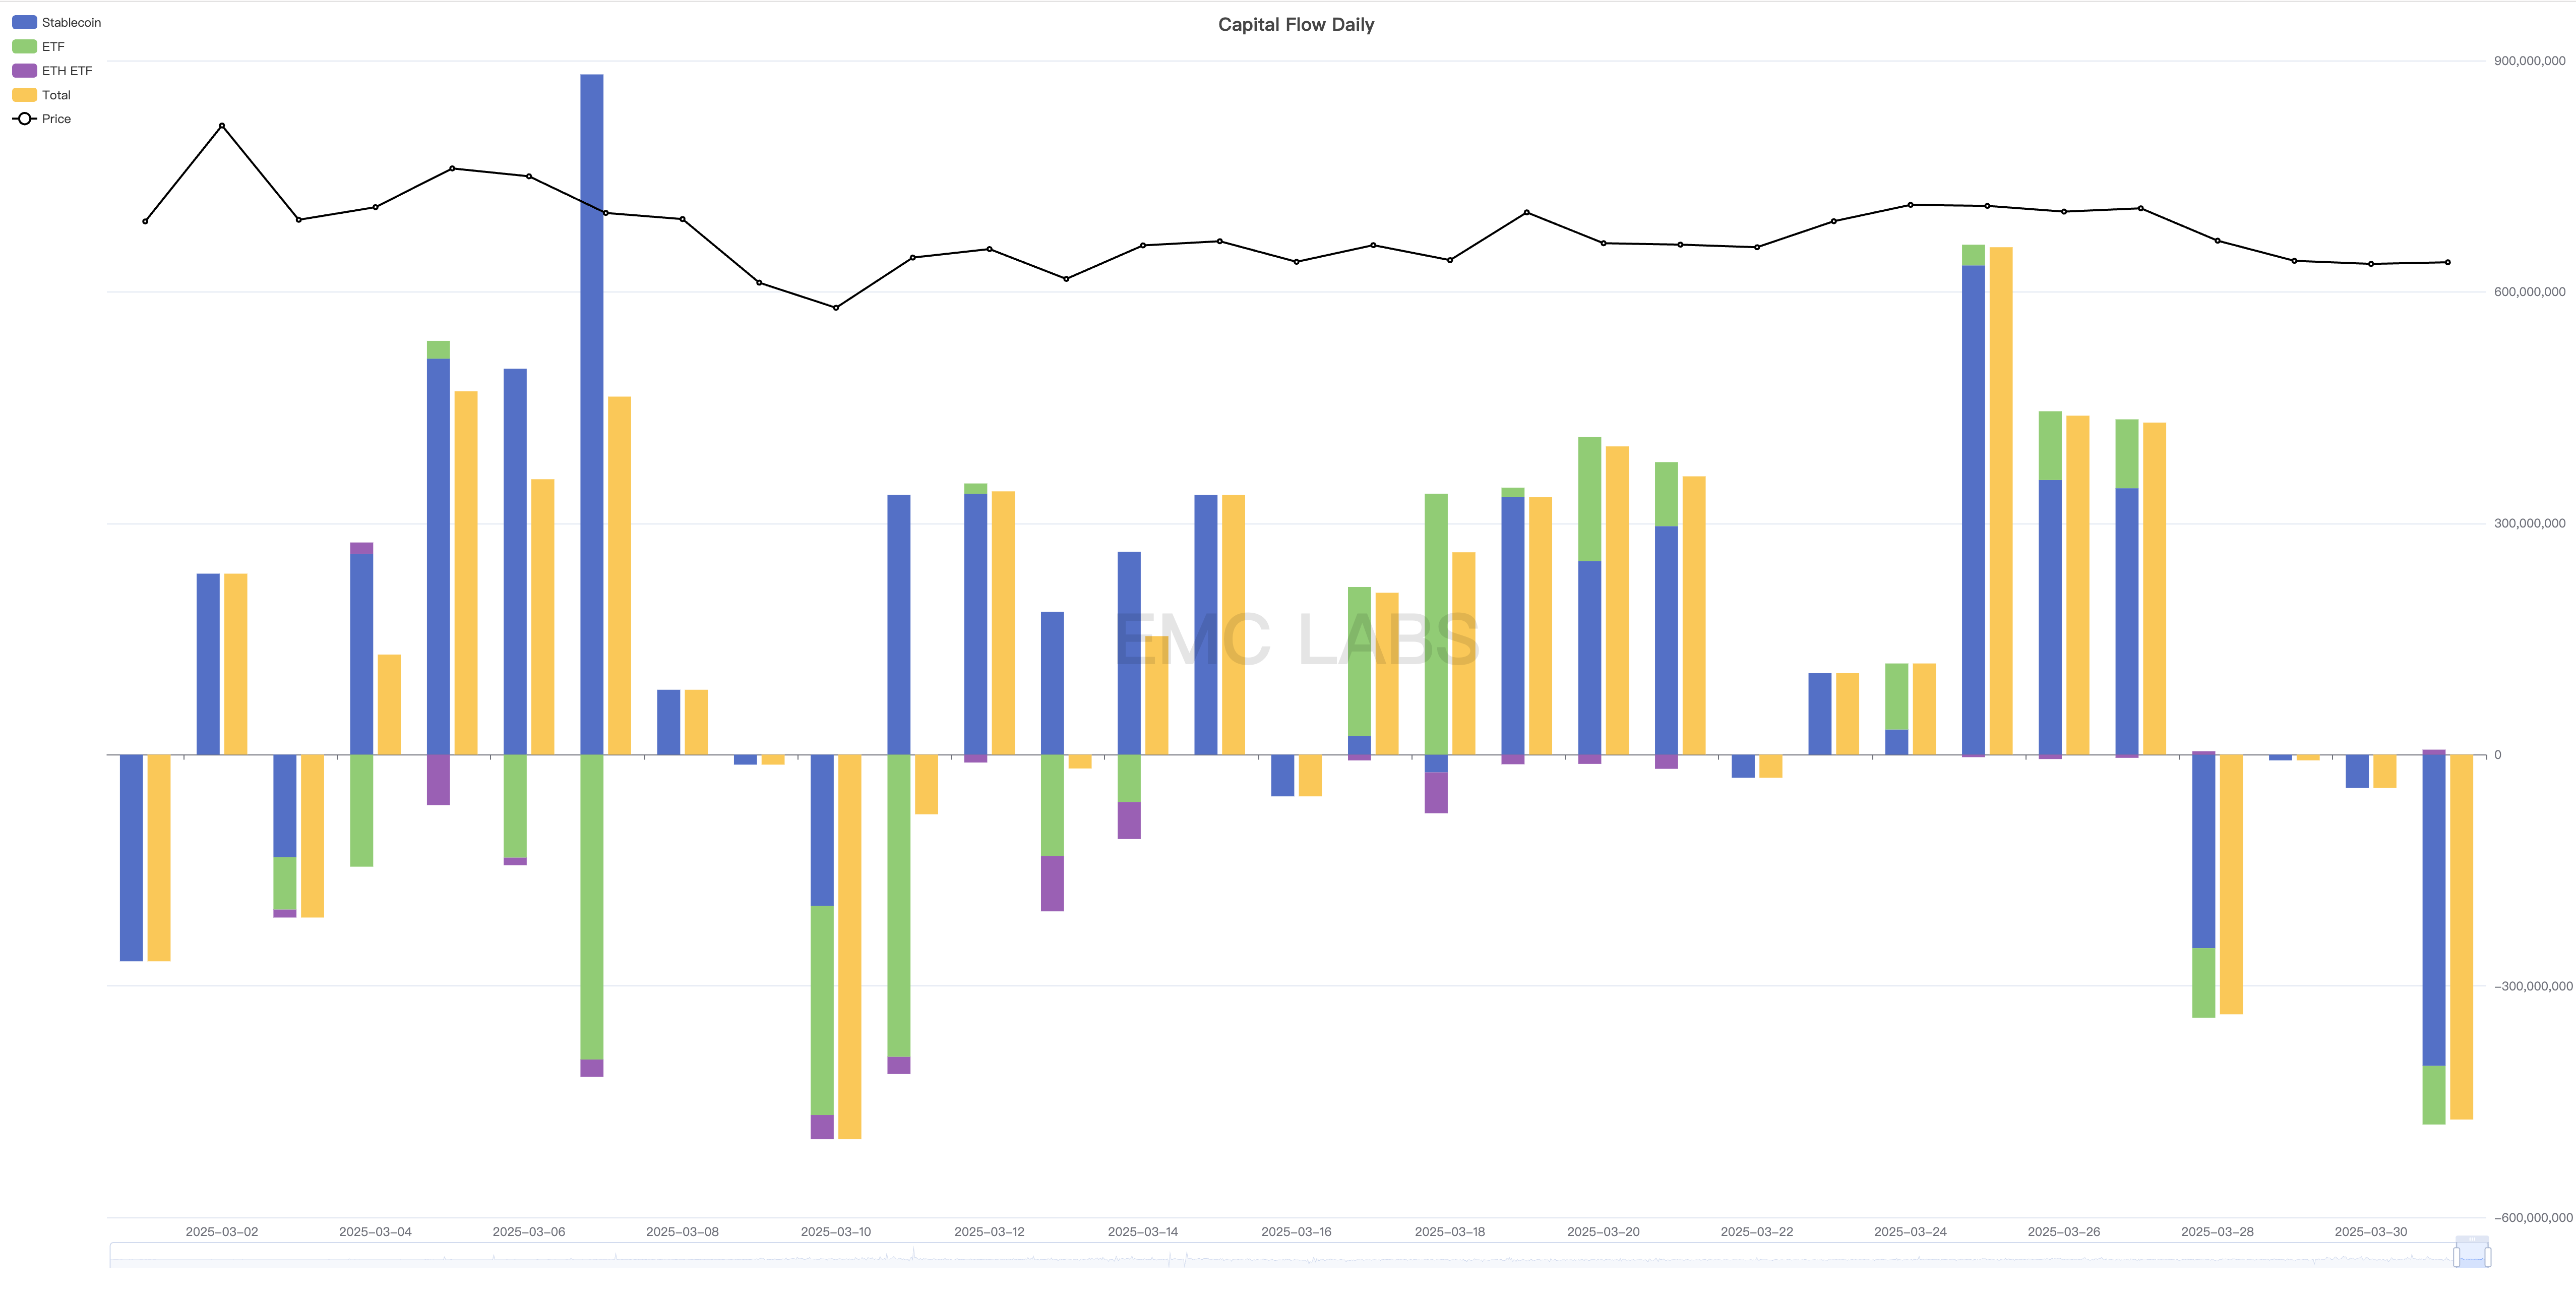
In the February report, we mentioned that the selling force behind this round of adjustments came from the BTC Spot ETF. Last month, its outflows reached $3.249 billion, setting a record for the largest monthly outflow since its inception. This month, the overall outflow of ETF channel funds continued, but the scale significantly decreased to $634 million. The outflows mainly occurred in early March, while after mid-March, there was a maximum inflow for ten consecutive trading days.

Crypto Market March Report: Breaking Through the Fog of the Tariff War, BTC May Welcome a Reversal in Q2 Crypto Market Fund Inflow and Outflow Statistics (Monthly)

Stablecoins continued to flow in this month, amounting to $4.893 billion, slightly lower than last month's $5.3 billion.

The inflow and outflow of ETF channel funds are completely synchronized with the rise and fall of BTC prices, serving as evidence that this round of adjustments is a result of the spillover effect from U.S. stock adjustments.

On-site funds did not exhibit independent behavior but reacted in line with the market, both during the decline from late February to early March and the subsequent rebound.

Crypto Market March Report: Breaking Through the Fog of the Tariff War, BTC May Welcome a Reversal in Q2 Changes in BTC Buying Power on Centralized Exchanges

BTC prices will continue to be linked to U.S. stocks, especially the Nasdaq, so the U.S. tariff war and the Federal Reserve's interest rate cut decisions will continue to influence medium- to long-term trends. The scale and sustainability of inflows into the ETF channel funds will serve as a tool for observing short- to medium-term trend judgments.

Second Round of Sell-Off Pauses: Chips Return to Long Hands, Shorts Continue to Face Pressure

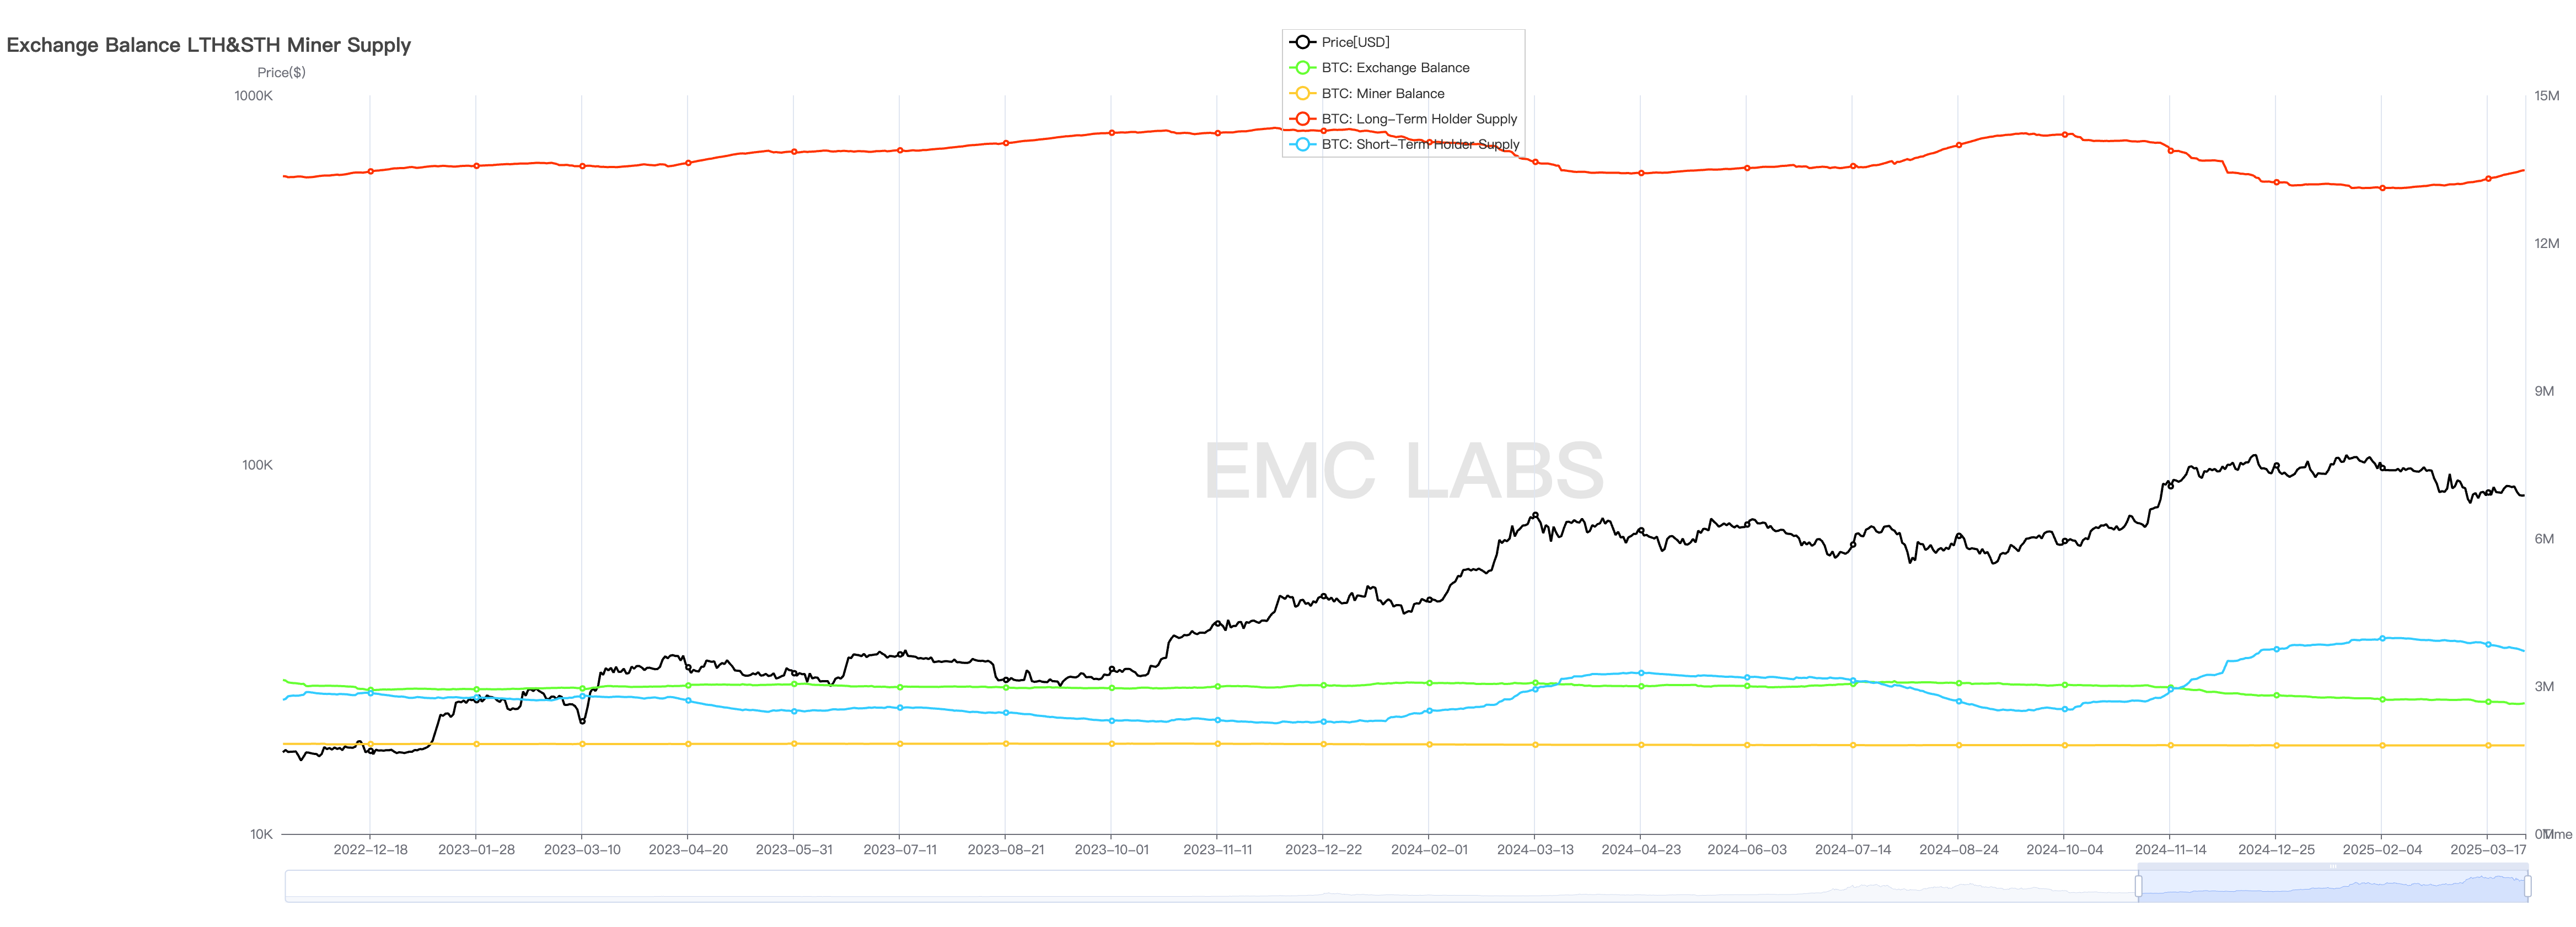
Before the adjustment in February, the main event within the crypto market was the second wave of selling by long holders. This selling was both a reaction to the excess liquidity and objectively "suppressed" the rise in BTC prices. Subsequently, as the trading themes in U.S. stocks changed, both U.S. stock and BTC valuations faced downward pressure, prompting short holders to sell off for safety.

Accompanied by a significant drop in U.S. stocks, the internal structure of the crypto market endured a massive shock and made corresponding adjustments. When short selling intensified and prices fell rapidly, long holders stopped selling around mid-February and shifted to "increasing holdings," significantly reducing the downward pressure on the market, cooling off the trading enthusiasm, and helping the market cope with liquidity reduction, allowing prices to reach a new equilibrium after the decline.

Crypto Market March Report: Breaking Through the Fog of the Tariff War, BTC May Welcome a Reversal in Q2 Long and Short Positions and Miner Group Holdings Statistics

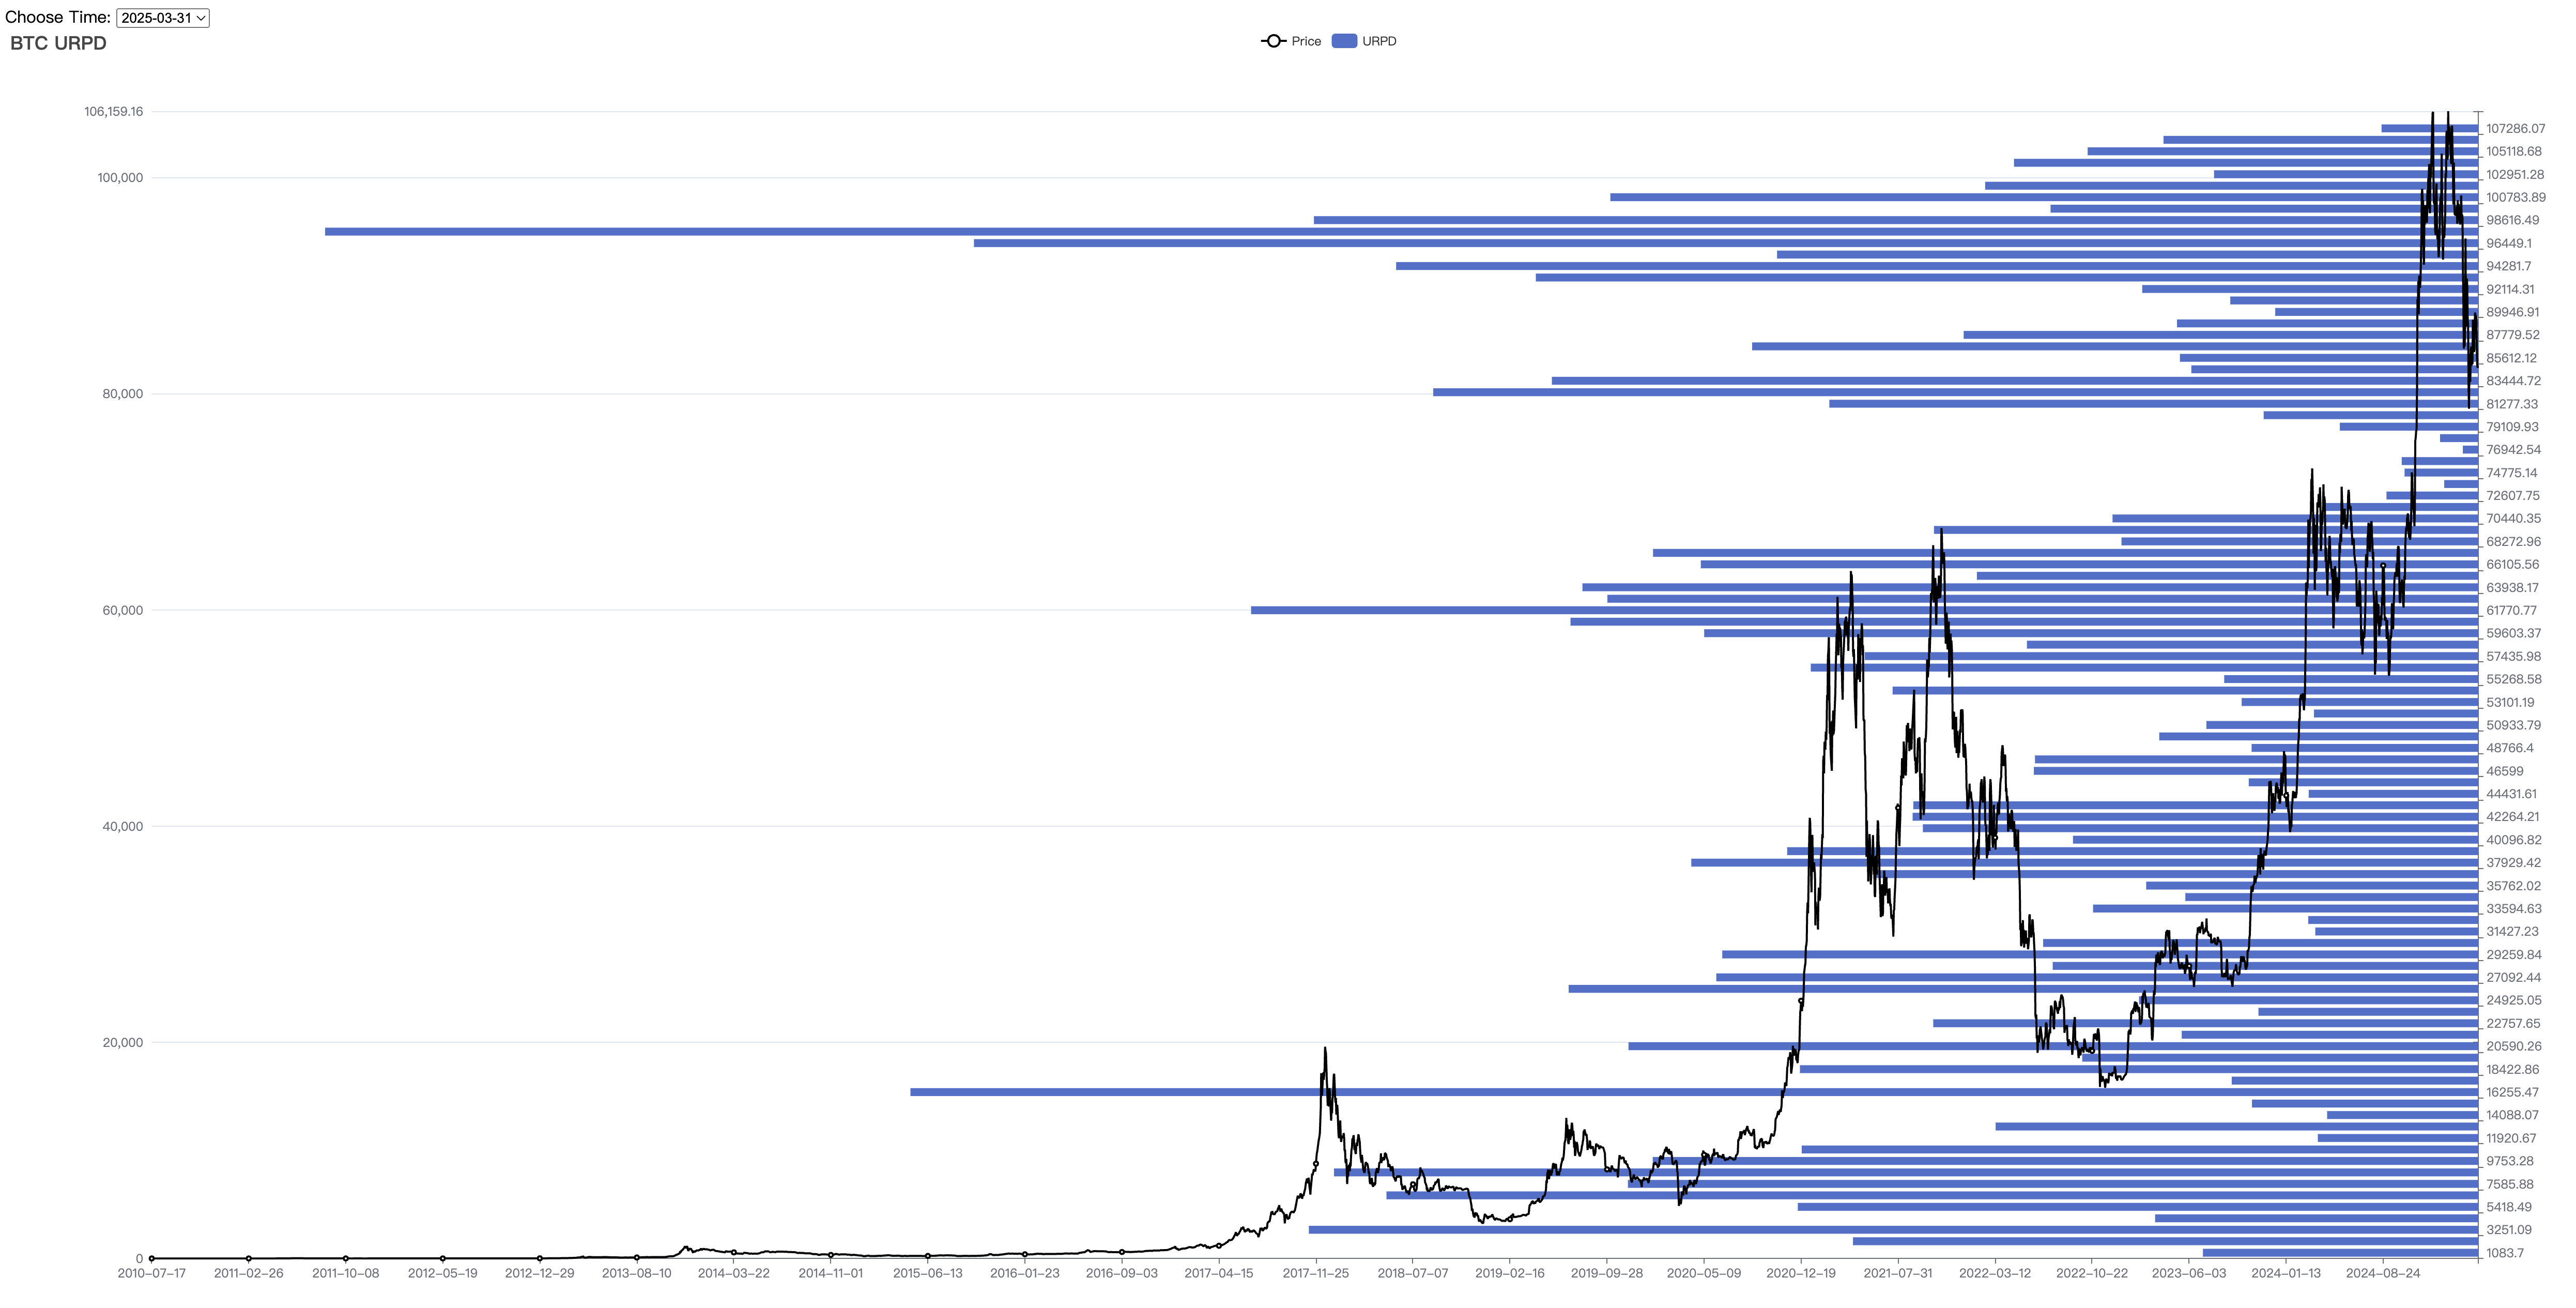
According to eMerge Engine data, the losses caused by this round of declines have exceeded those formed during the 2024 Carry Trade storm, becoming the largest loss range in the new cycle since January 2023. On-chain, this is reflected in a large amount of BTC originally priced in the $90,000 to $110,000 range entering the $76,000 to $90,000 range, partially resolving the previous issue of insufficient chip distribution in the $73,000 to $90,000 range.

Crypto Market March Report: Breaking Through the Fog of the Tariff War, BTC May Welcome a Reversal in Q2 On-Chain Distribution of BTC Chips

This rapid decline, although long holders also engaged in profit-taking, was not significant in scale. The chips that changed hands in panic mainly came from BTC transactions in the $90,000 to $110,000 range after November last year.

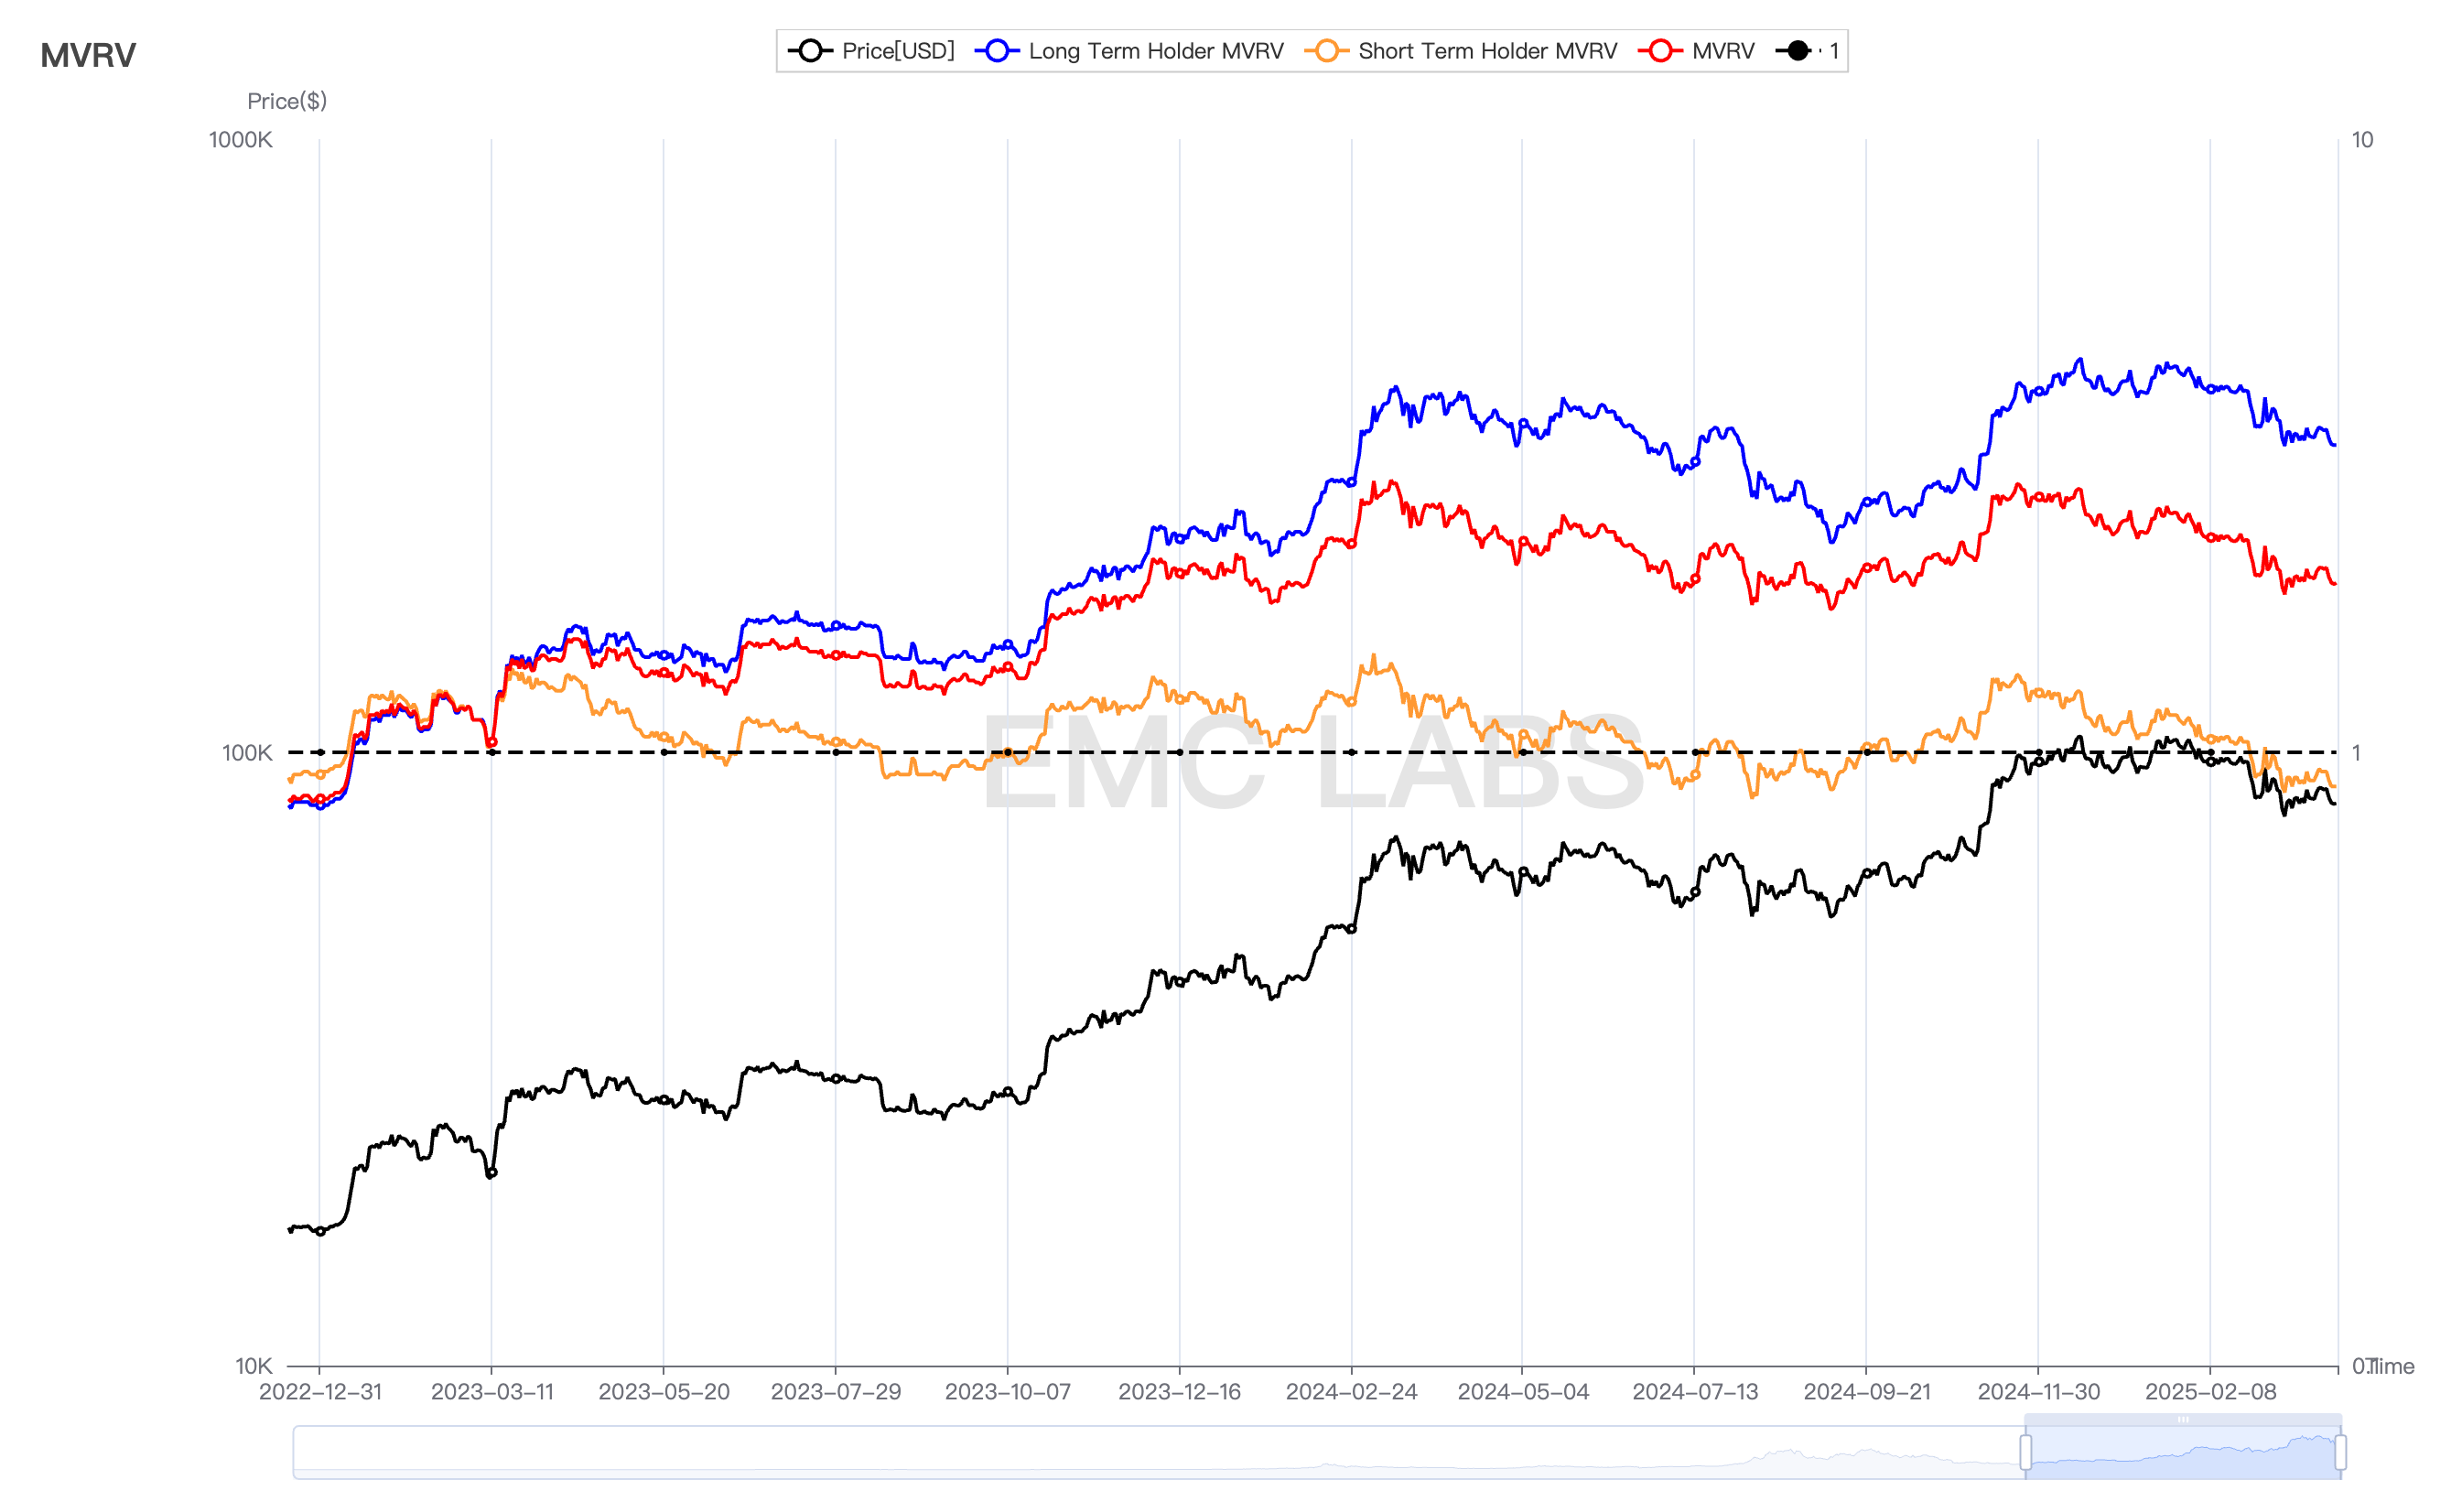
Although the short holders have completed a considerable scale of selling, the overall floating profit and loss situation across the chain remains pessimistic. The maximum floating loss for short holders during this decline reached 14%, close to the 16% on August 5, 2024. As of March 31, short holders still faced a floating loss of 12%, and the patience and endurance of this group are still under significant challenge.

Crypto Market March Report: Breaking Through the Fog of the Tariff War, BTC May Welcome a Reversal in Q2 Floating Profit and Loss Statistics of Different BTC Holders

If this pressure translates into selling pressure, it could push BTC down to $73,000, which is the upper edge of the new high consolidation area and the price before Trump's election.

Conclusion

From an external perspective, BTC prices are currently entirely constrained by the chaos of tariffs and the sticky inflation leading to expectations of "stagflation" or even "recession," as well as the Federal Reserve's willingness to compromise on interest rate cuts.

From an internal perspective, the short holders have experienced the largest scale of selling losses in this cycle over the past month. Currently, the selling pressure has shrunk, but due to the pressure from floating losses, further selling to alleviate pain cannot be ruled out, although the probability is low. The shift from selling to increasing holdings by long holders plays a significant stabilizing role in the market.

Stablecoins continue to flow in, and there are signs of inflows into BTC ETF channel funds. However, if U.S. stocks decline, ETF channel funds may sell off again, becoming the main driving force pushing prices down.

On April 2, Trump's tariff war will reach a phase peak, at which point U.S. stocks may welcome a medium- to short-term bottom. The reverse is also true; if tariff policies do not deteriorate excessively, and the U.S. economy shows signs of recession but not severely, while the Federal Reserve cuts rates again in June, then BTC, which has already undergone significant valuation cuts, is likely to see a reversal in Q2.

After experiencing a tumultuous first quarter, the outlook for the second quarter remains unclear, but the most painful moments may have passed. Once Washington and the Federal Reserve return to a rational game state, the market should be able to return to its operational norms.

免责声明:本文章仅代表作者个人观点,不代表本平台的立场和观点。本文章仅供信息分享,不构成对任何人的任何投资建议。用户与作者之间的任何争议,与本平台无关。如网页中刊载的文章或图片涉及侵权,请提供相关的权利证明和身份证明发送邮件到support@aicoin.com,本平台相关工作人员将会进行核查。

ad
Gate:注册解锁$6666
Ad
Share To
APP

X

Telegram

Facebook

Reddit

CopyLink