Cryptocurrency News
April 2 Hot Topics:
1. Circle acquires Coinbase's stake in Centre for $210 million, becoming the sole issuer of USDC.
2. The White House plans to hold a meeting on TikTok tomorrow in the Oval Office.
3. Dogwifhat announces the abandonment of the Las Vegas Sphere project and will refund nearly $700,000 in fundraising.
4. GameStop raises $1.5 billion to acquire Bitcoin.
5. The SEC plans to discuss a possible settlement with Gemini and apply for a case delay.
Trading Insights
After years of trading cryptocurrencies, I have summarized several stable profit-making techniques, focusing on practicality!
- When a strong coin falls for 9 consecutive days, decisively follow up; the risk is basically digested, and there is a chance to catch a rebound.
- If a coin rises for two consecutive days, reduce positions to lock in profits; after two days of rising, it usually enters an adjustment period, and timely reduction can protect existing gains.
- If the increase exceeds 7%, observe the next day's high; if the increase exceeds 7% in one day, it is highly likely to rise again the next day, so don’t rush to sell; hold and observe.
- For strong bull coins, wait for the correction to end before entering; this is the best choice to avoid chasing high prices.
- If there are three days of flat fluctuations, continue to observe; if a coin has stable fluctuations for three consecutive days, observe for another three days; if there is no improvement, consider switching positions.
- If unable to break even, cut losses in time; if the next day fails to recover the previous day's cost price, decisively exit, do not delay.
- After two days of increase, there must be five days; based on the increase ranking rules, the fifth day after two days of increase is often a good selling point, so buy low and sell on the fifth day.
- Volume and price indicators are crucial; follow up when there is a breakout with increased volume, and exit when there is stagnation at high levels. A breakout with increased volume at low levels is an entry opportunity, while stagnation with increased volume at high levels means to exit decisively.
- Only trade coins in an upward trend; a 3-day moving average pointing up indicates a short-term bullish outlook, a 30-day moving average pointing up represents a medium-term bullish outlook, an 80-day moving average signals a main upward wave, and a 120-day moving average indicates a long-term surge.
- Small funds also have opportunities; as long as the method is correct, the mindset is stable, and the strategy is strictly executed, small funds in the cryptocurrency market can also achieve a turnaround. It is essential to remember that there are many opportunities in the cryptocurrency market, but the risks are enormous; continuous learning and summarizing experiences is the long-term way.
LIFE IS LIKE
A JOURNEY ▲
Below are the real trading signals from the Big White Community this week. Congratulations to the friends who followed along; if your operations are not going smoothly, you can come and try it out.
The data is real, and each order has a screenshot from the time it was sent.
**Search for the public account: *Big White Talks About Coins*
BTC
Analysis
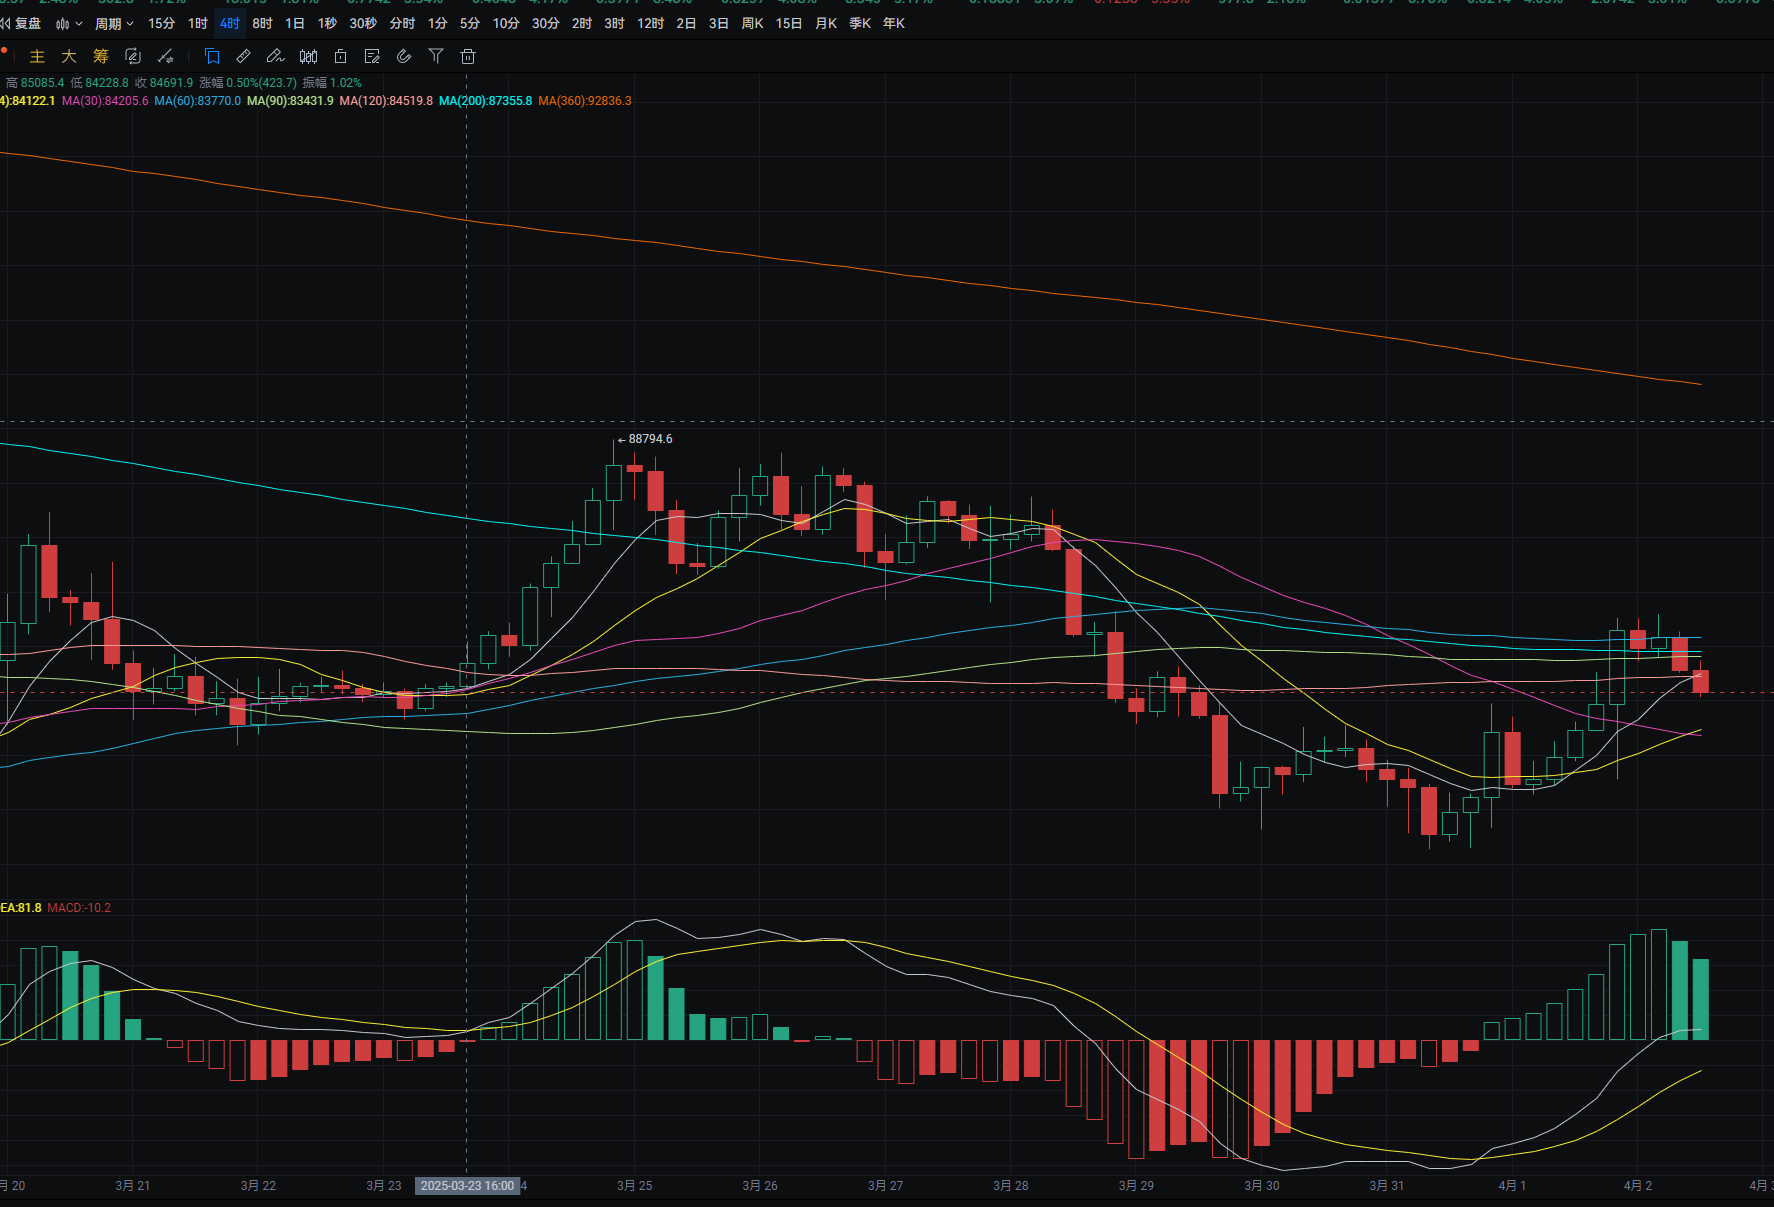
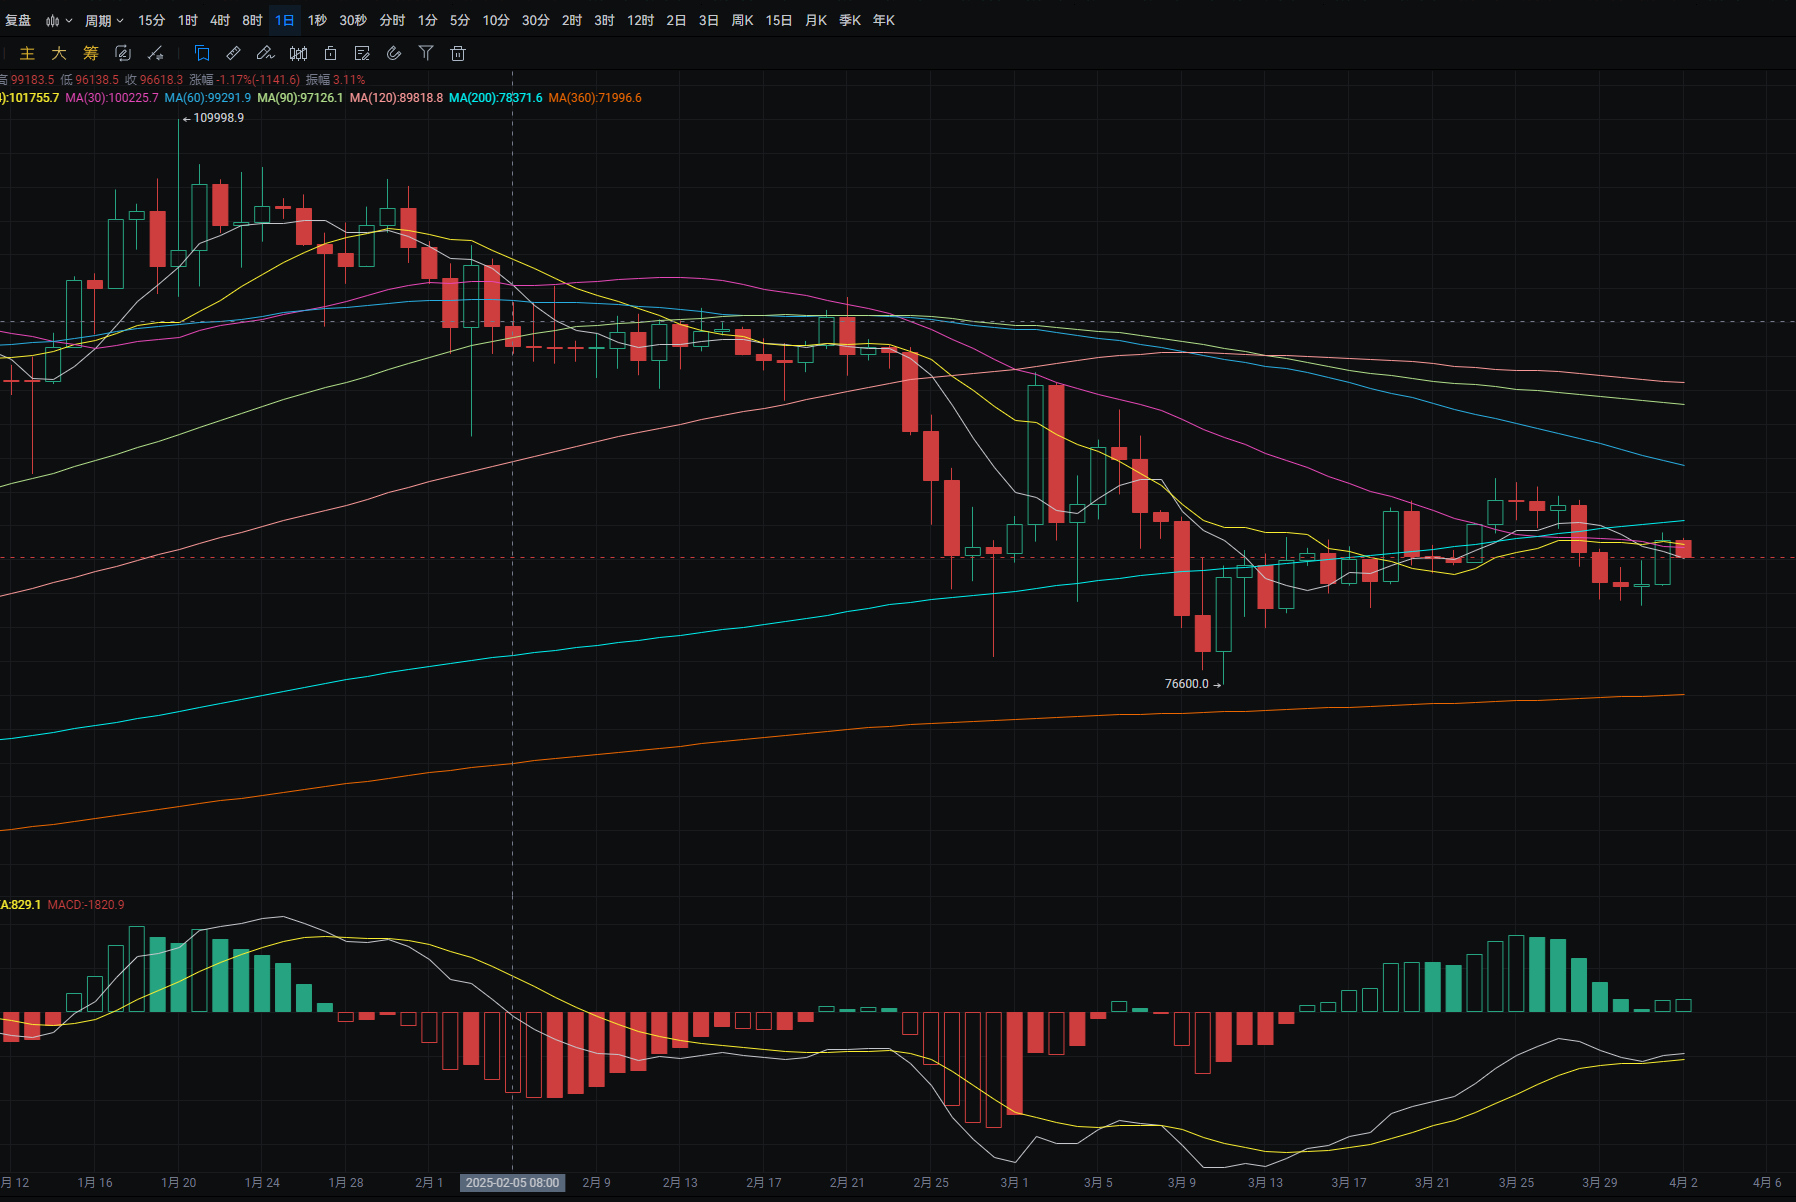
Bitcoin's daily line rose from a low of around 82,400 to a high of around 85,600 yesterday, closing around 85,150. The support level is around 82,350; if it breaks, it can be seen around 81,600. A pullback can be bought around this area. The resistance level is around MA14; if it breaks, it can be seen around MA200. A rebound to this area can be a short opportunity. MACD shows bullish momentum. The four-hour support level is around MA30; if it breaks, it can be seen around 82,300. A pullback can be bought around this area. The resistance level is around MA60; a rebound to this area can be a short opportunity. MACD shows a decrease in bullish momentum.
ETH
Analysis
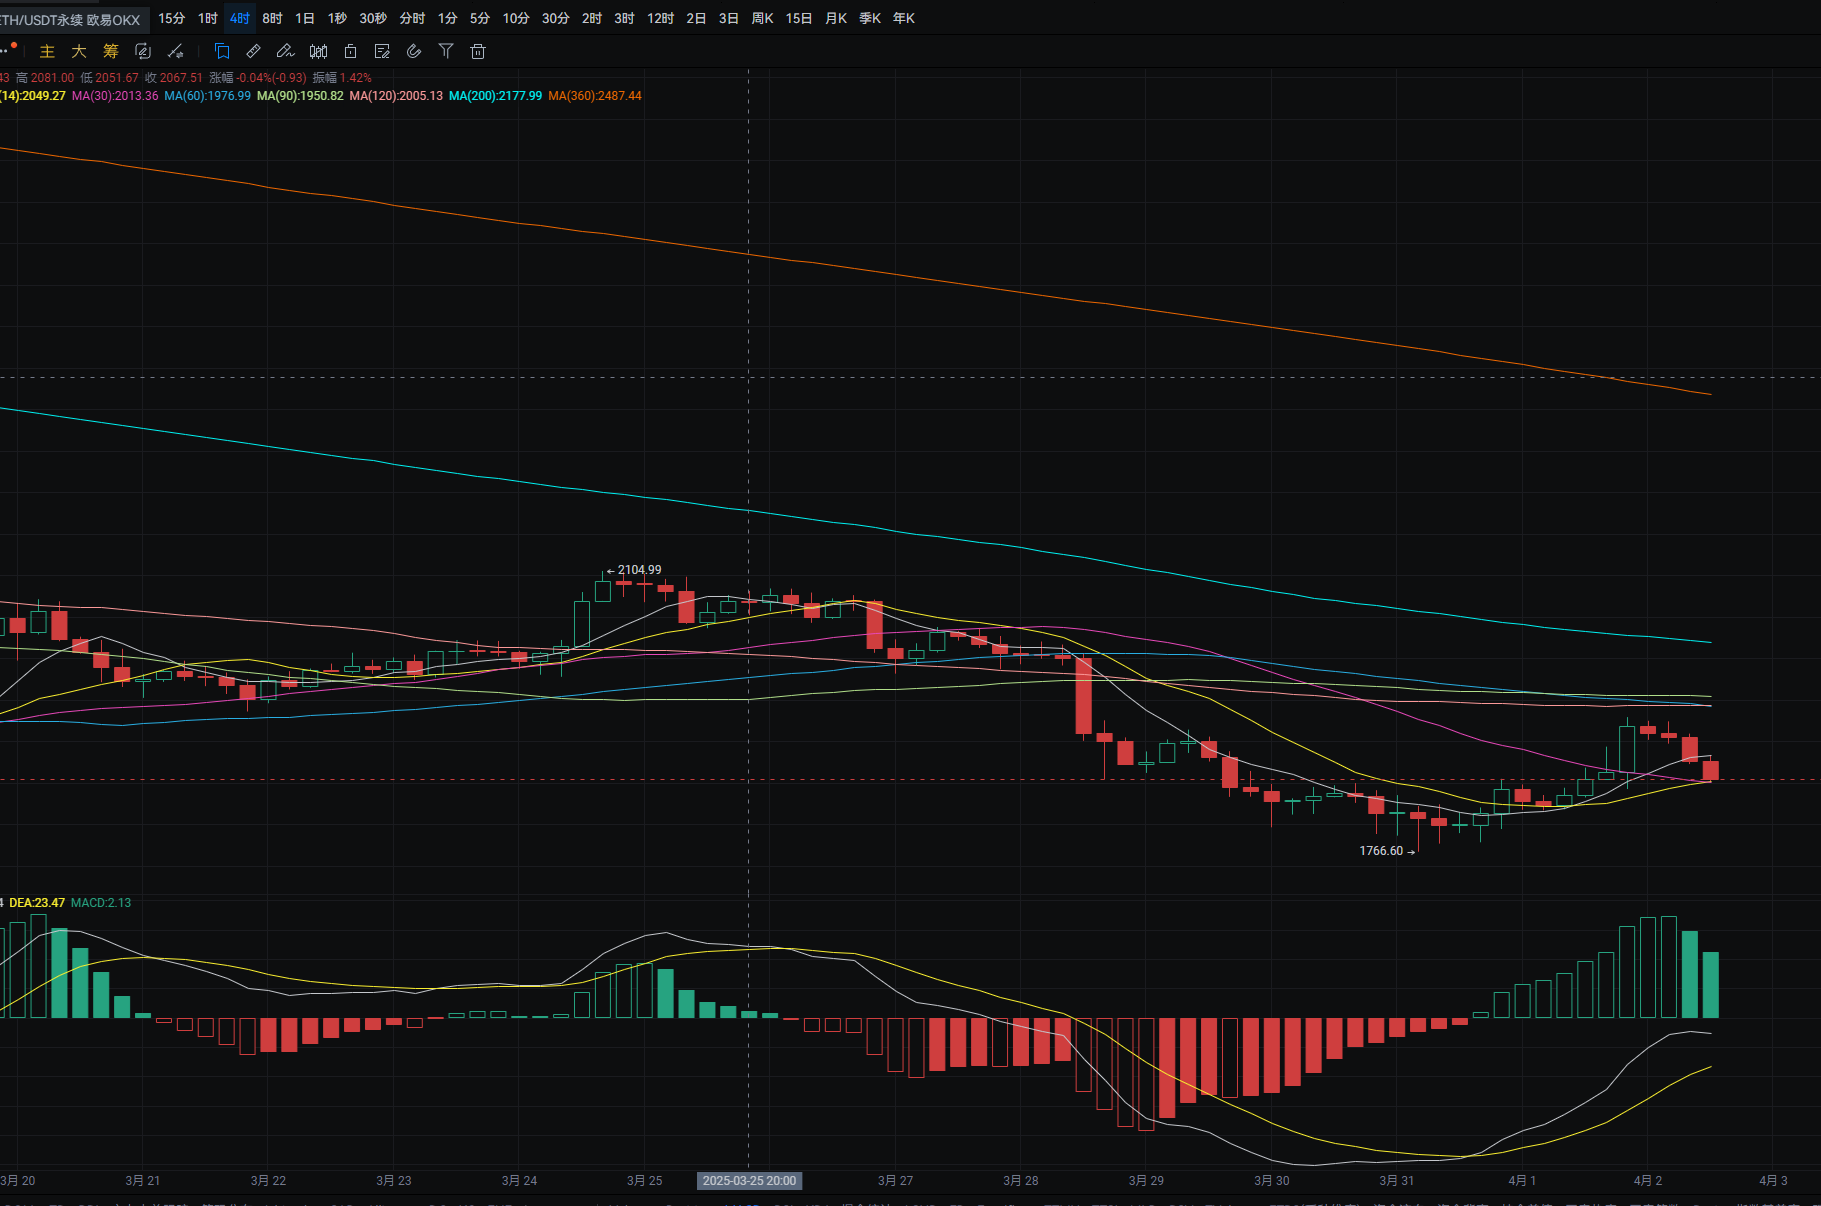
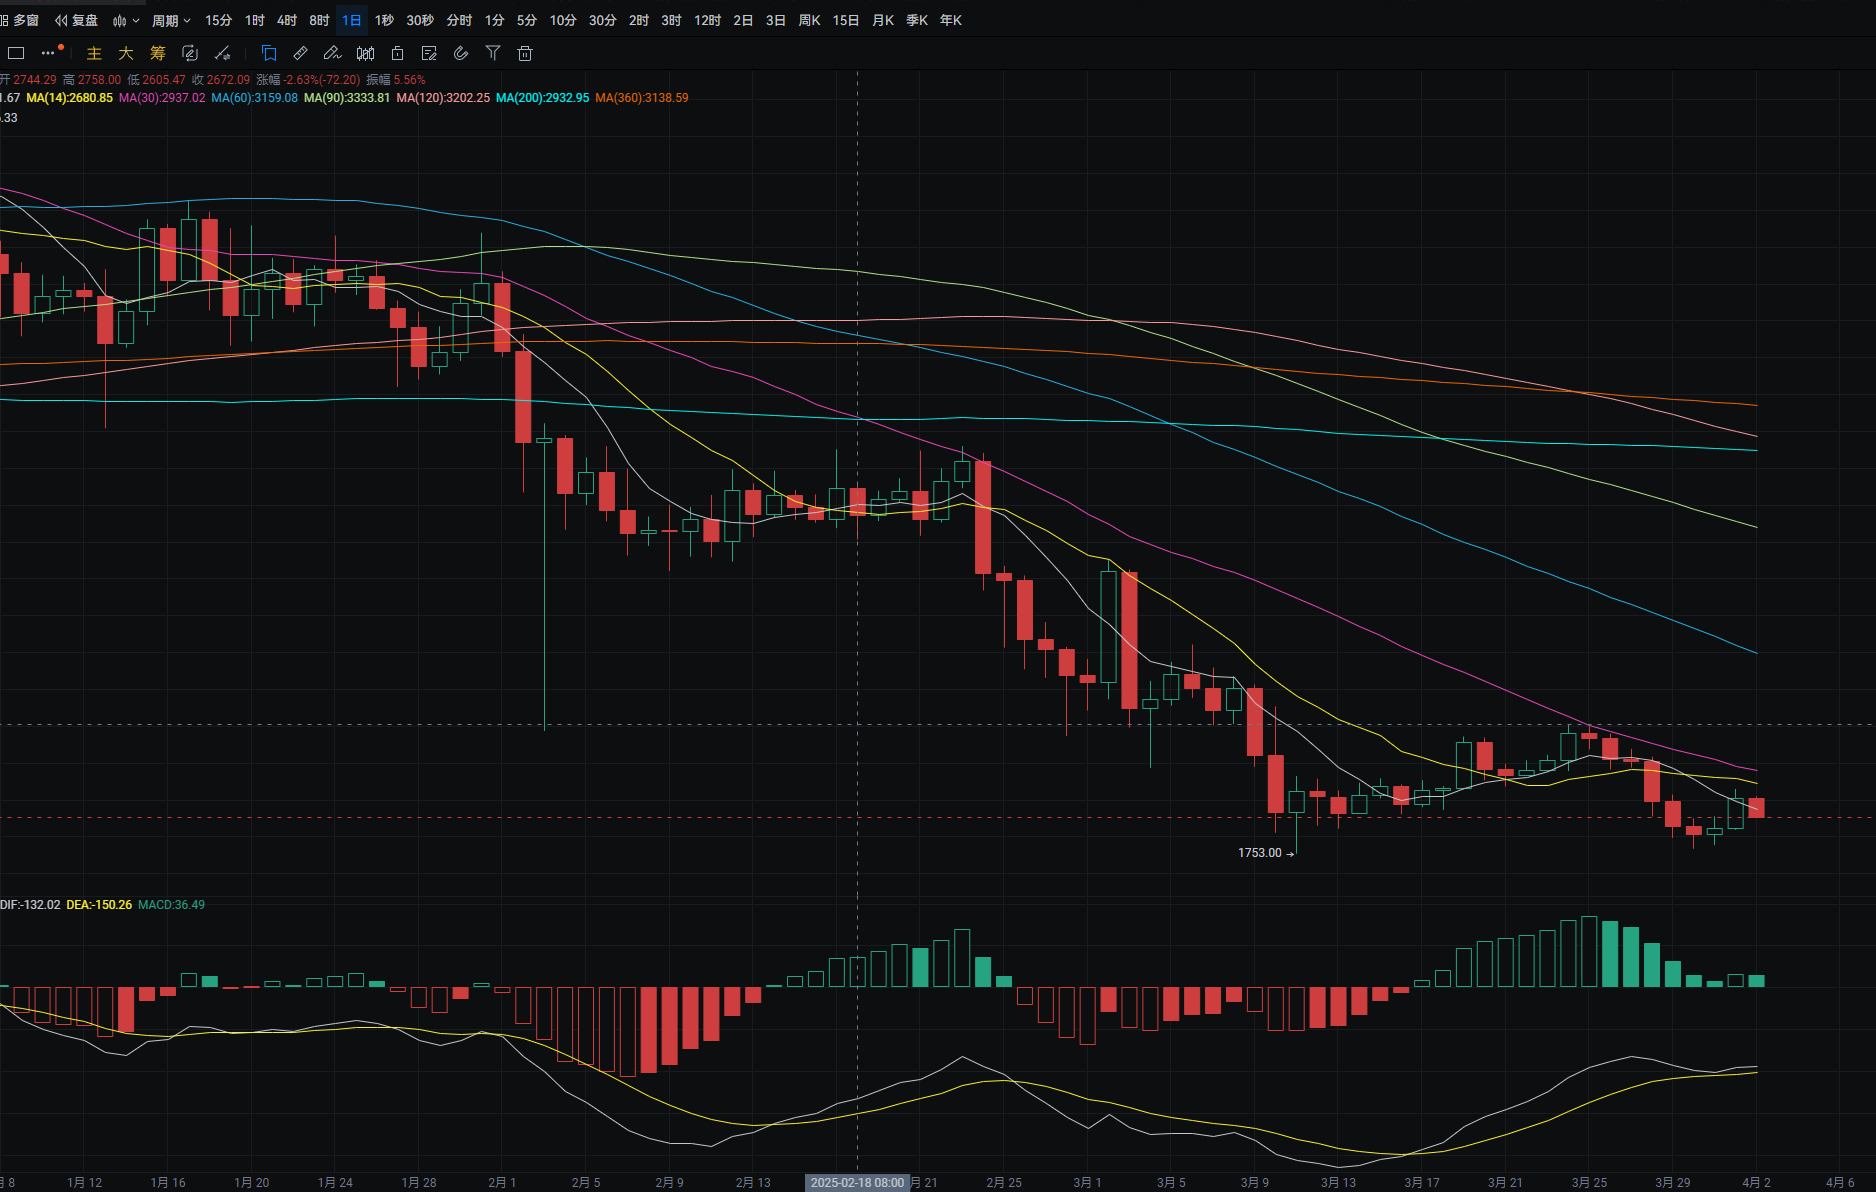
Ethereum's daily line rose from a low of around 1,815 to a high of around 1,930 yesterday, closing around 1,905. The support level is around 1,785; a pullback can be bought around this area. The resistance level is around 1,900; if it breaks, it can be seen around MA14. A rebound to this area can be a short opportunity. MACD shows bullish momentum. The four-hour resistance level is around MA120; a rebound to this area can be a short opportunity. MACD shows a decrease in bullish momentum. A short-term buy can be made around 1,783, with a rebound target around 1,840. A rebound to the range of 1,894-1,920 can be a short opportunity, with a target around 1,783-1,715.
Disclaimer: The above content is personal opinion and for reference only! It does not constitute specific operational advice and does not bear legal responsibility. Market conditions change rapidly, and the article has a certain lag; if there is anything unclear, feel free to consult.
免责声明:本文章仅代表作者个人观点,不代表本平台的立场和观点。本文章仅供信息分享,不构成对任何人的任何投资建议。用户与作者之间的任何争议,与本平台无关。如网页中刊载的文章或图片涉及侵权,请提供相关的权利证明和身份证明发送邮件到support@aicoin.com,本平台相关工作人员将会进行核查。