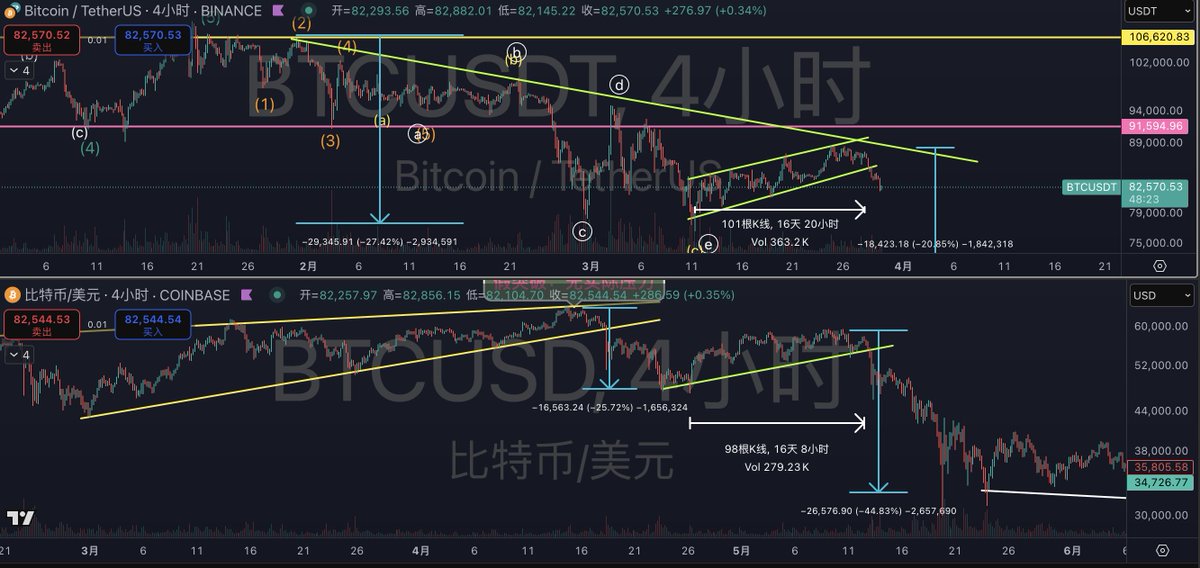
What an interesting chart, what an interesting historical replay!
This time it dropped 27%, last time it was 25%.
This time the low point rebounded and fluctuated for 16 days, last time it was also 16 days.
After the last rebound ended, it dropped 45%, welcoming 519.
Will it be the same this time?
I don't think history will simply repeat itself.
This time the high point dropped for 39 days, last time it was only 11 days.
After the last rebound ended, it plummeted for 9 days, continuing to drop for 71 days until late July.
This time it shouldn't drop as deeply as 45%-50% like last time.
A needle could support around 70,000.
But if we correspond to the last round of drop history, then it would have to go to 50,000…
Anyway, I will buy at 70,000, only looking at 50,000 if it breaks, there is an extremely good cost-performance ratio here.
Moreover, the liquidity support of Bitcoin ETFs is not similar to history.
The interpretation of technical charts is all based on personal trading cognition.
For reference only~
免责声明:本文章仅代表作者个人观点,不代表本平台的立场和观点。本文章仅供信息分享,不构成对任何人的任何投资建议。用户与作者之间的任何争议,与本平台无关。如网页中刊载的文章或图片涉及侵权,请提供相关的权利证明和身份证明发送邮件到support@aicoin.com,本平台相关工作人员将会进行核查。