币圈资讯
3月29日热点;
1.特朗普赦免三位 BitMEX 创始人和前员工关于洗钱的指控
2.美联储戴利:仍认为今年降息两次是一个合理的预测
3.新泽西监管机构命令Robinhood 与 Kalshi 停止体育竞猜服务
4.Coinbase 将 Keyboard Cat (KEYCAT) 添加到上币路线图
5.美 SEC 与 Wintermute 代表会面讨论「加密监管问题」解决方案
交易心得
币圈多年,总结了以下几点炒币心得,分享给大家!1、牛市里的热门币,跌得最快那些被炒得火热的币,特别是控盘严重的,泡沫破得也快,越多人追,越危险。像吹气球一样,吹大了必然会破。2、山寨币的套路都差不多套路一般是先猛砸,再慢慢拉高,换个方式继续收割。山寨币的玩法就这样,一定要有心理准备。3、市场长期趋势向上如果你拉长时间看,币圈的曲线其实相对平稳,短期涨跌是常态,长期趋势一般是慢慢上涨。4、有潜力的币没人炒作真正有潜力的币,往往在底部默默无闻,少有人提及,反倒是那些低调的币悄悄涨上来。5、新上线的币要小心交易所新上线的币,暴涨暴跌的不要碰,这基本是庄家设计的圈套,进去就是被割。6、涨跌都是常事买了就跌,卖了就涨,这在币圈太正常了。如果心态扛不住这点波动,那真得好好练练了。7、最猛的反弹不代表潜力反弹最凶的币,往往不是有潜力的,而是被炒起来的投机盘,别被表象迷惑,真正有潜力的币波动较平稳。8、突然回调小心被割如果你买完币后涨了一波,突然又回调了,那可能庄家开始出货了,注意别被割。9、下半场爆发的币牛市中,前期表现一般的币,下半场可能会爆发几倍,它们就像马拉松选手,后程发力。10、横盘数月的币可能爆发牛市中,有些币经历几倍涨幅后还能横盘数月,那它们很可能正在等待下一波爆发,这种币你得盯紧。
LIFE IS LIKE
A JOURNEY ▲
下方是大白社区本周实盘群单子,恭喜跟上的币友,如果你操作不顺,可以来试试水。
数据真实,每一单都有当时发出的截图。
搜索公众号:大白论币
BTC
分析
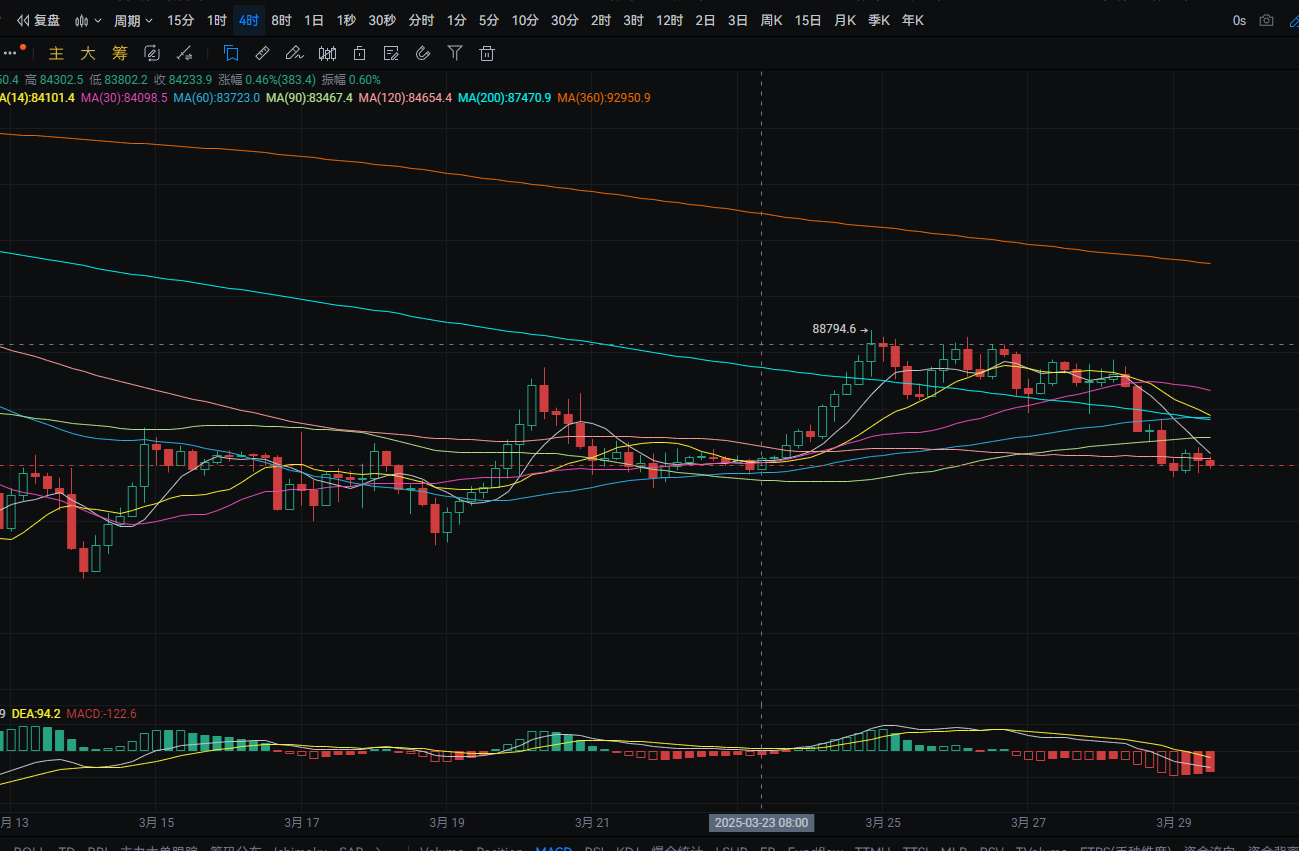
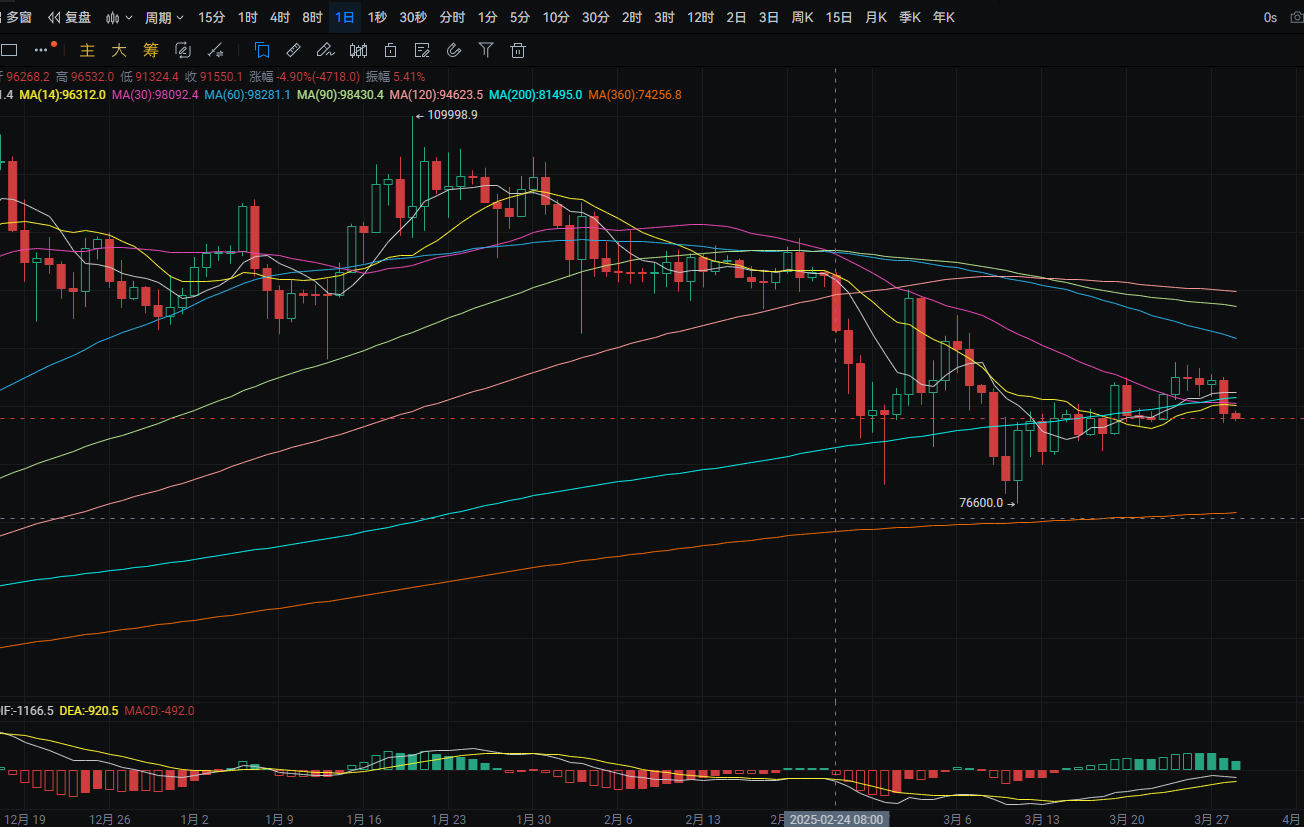
大饼日线昨日从最高87500附近下跌至最低83550附近 收线在84450附近 下方支撑位于83450附近 跌破则可看至82500附近 回踩可在附近进行接多 上方压力位于MA30附近 突破则可看至MA7均线附近 反弹至附近可进行接空 MACD多头缩量 有形成死叉的迹象 四小时上方压力位于MA90附近 突破则可看至MA200附近 反弹至附近可进行接空 MACD空头缩量
ETH
分析
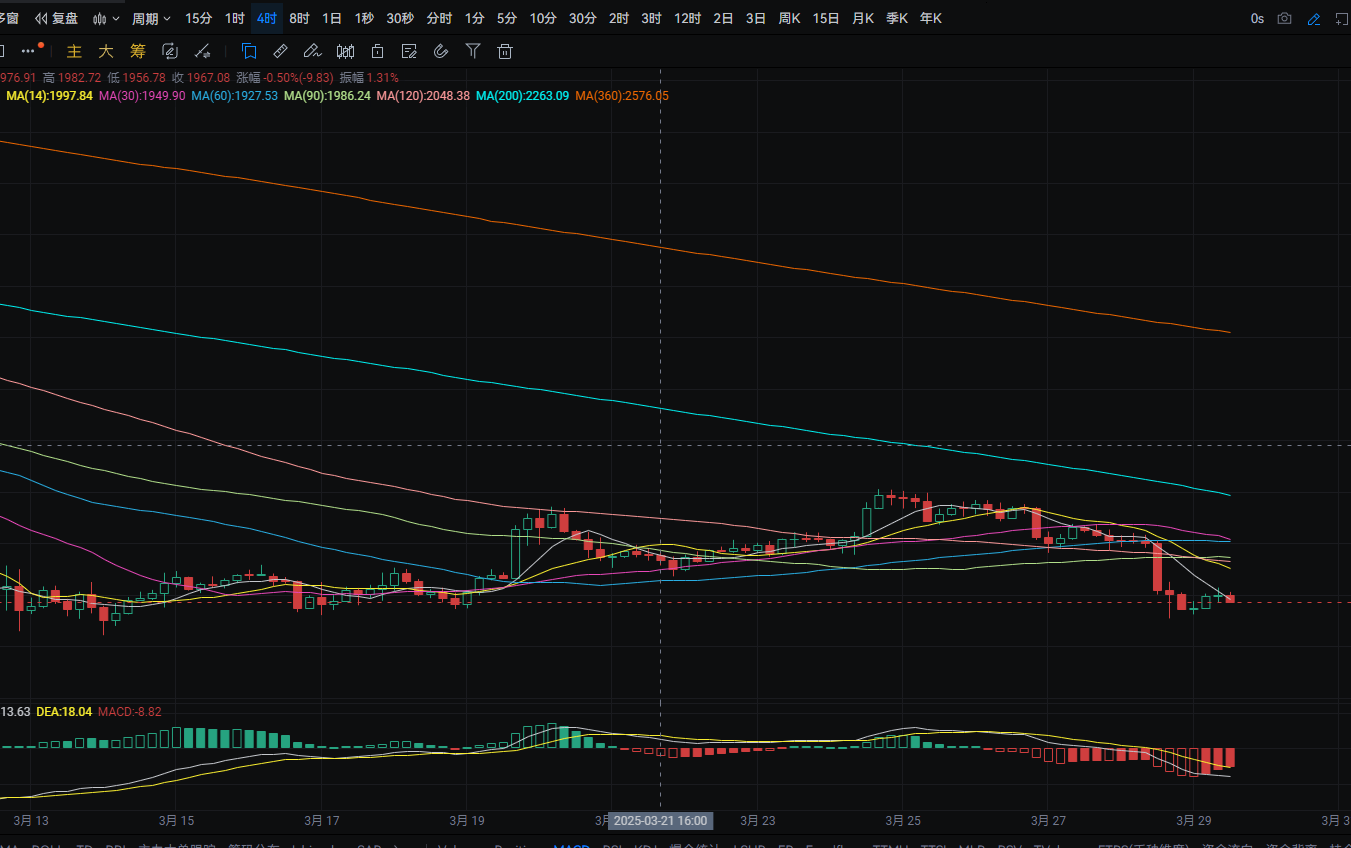
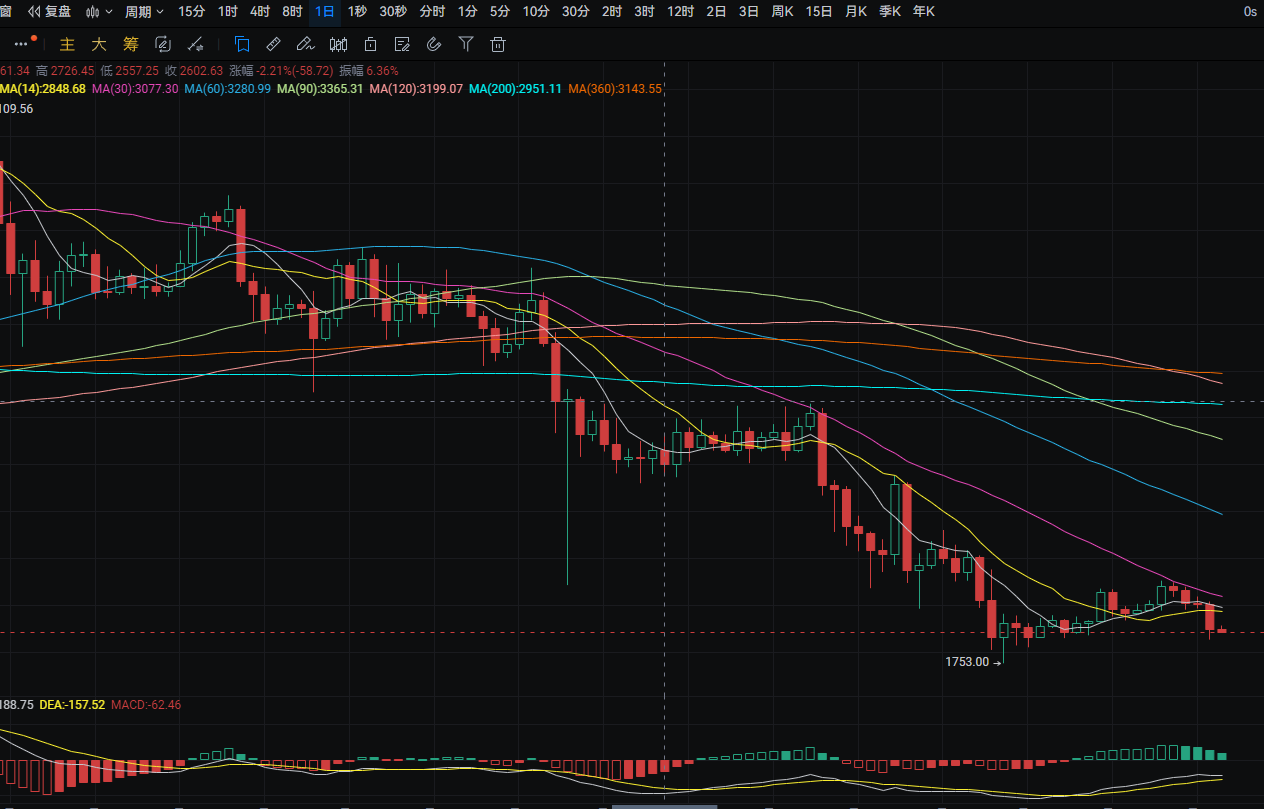
以太日线昨日从最高2015附近下跌至最低1855附近 收线在1895附近 下方支撑位于1830附近 跌破则可看至1750附近 回踩可在附近进行接多 上方压力位于MA14附近 突破则可看至MA30附近 反弹至附近可进行接空 MACD多头缩量 有形成死叉的迹象 四小时上方压力位于MA14附近 突破则可看至MA60附近 反弹至附近可进行接空 MACD空头缩量
免责声明:以上内容均为个人观点,仅供参考!不构成具体操作建议,也不负法律责任。市场行情瞬息万变,文章具有一定滞后性,如果有什么不懂的地方,欢迎咨询
免责声明:本文章仅代表作者个人观点,不代表本平台的立场和观点。本文章仅供信息分享,不构成对任何人的任何投资建议。用户与作者之间的任何争议,与本平台无关。如网页中刊载的文章或图片涉及侵权,请提供相关的权利证明和身份证明发送邮件到support@aicoin.com,本平台相关工作人员将会进行核查。


