Author: Scof, ChainCatcher
Editor: TB, ChainCatcher
Solana seems to be on the verge of a revival.
This week, several assets within the Solana ecosystem began to react, and market sentiment is gradually improving. According to crypto KOL @_Forab, the crypto market-making giant Jump has returned to the market, and there are rumors that the official team is conducting OTC operations for SOL. Additionally, participants within the ecosystem appear to be actively responding to the rise of BNB Chain, seeking new breakthroughs.
This article will analyze and interpret the current capital movements through five key technical indicators to help readers better understand the potential trends within the Solana ecosystem.
1. Price Performance
According to CoinMarketCap data, the price of SOL has rebounded from a low of $117 to about $140 over the past month, an increase of nearly 20%. During the same period, BNB rose from $511 to $637, an increase of approximately 24.6%.
From the trend, BNB's rise was mainly concentrated between March 11 and 18, during which BNB Chain saw active on-chain trading. It is speculated that the increase in price may be due to users buying in advance to purchase meme coins, leading to a surge in demand on-chain, which drove up the price of BNB.
In contrast, SOL's upward momentum was more concentrated, primarily occurring between March 24 and 25, indicating a rapid influx of capital into the Solana ecosystem in a short period.
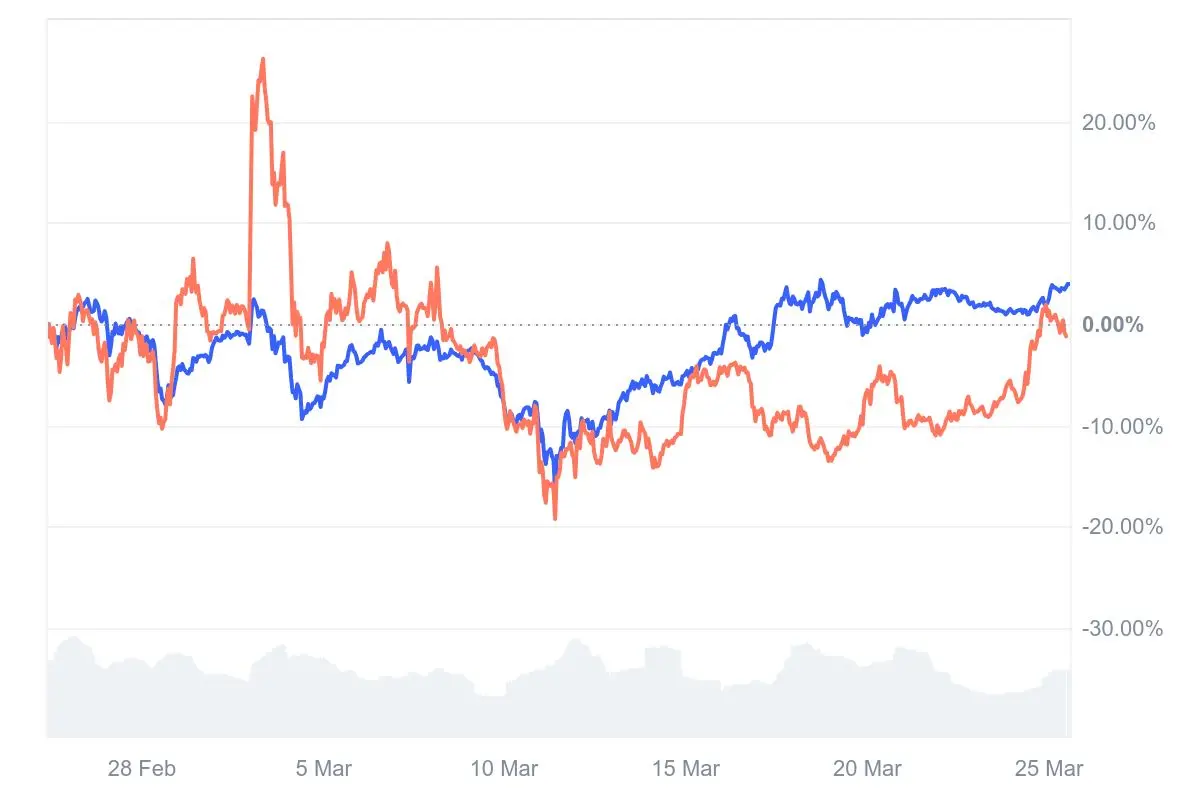
Price comparison of BNB and SOL, blue for BNB, red for SOL
2. Active Address Count
According to data from Artemis Terminal, the daily active user count on the Solana chain on March 24 increased from 3.8 million the previous day to 5.3 million, showing a significant rise in user participation. In contrast, the daily active user count on BNB Chain was only 1.4 million.
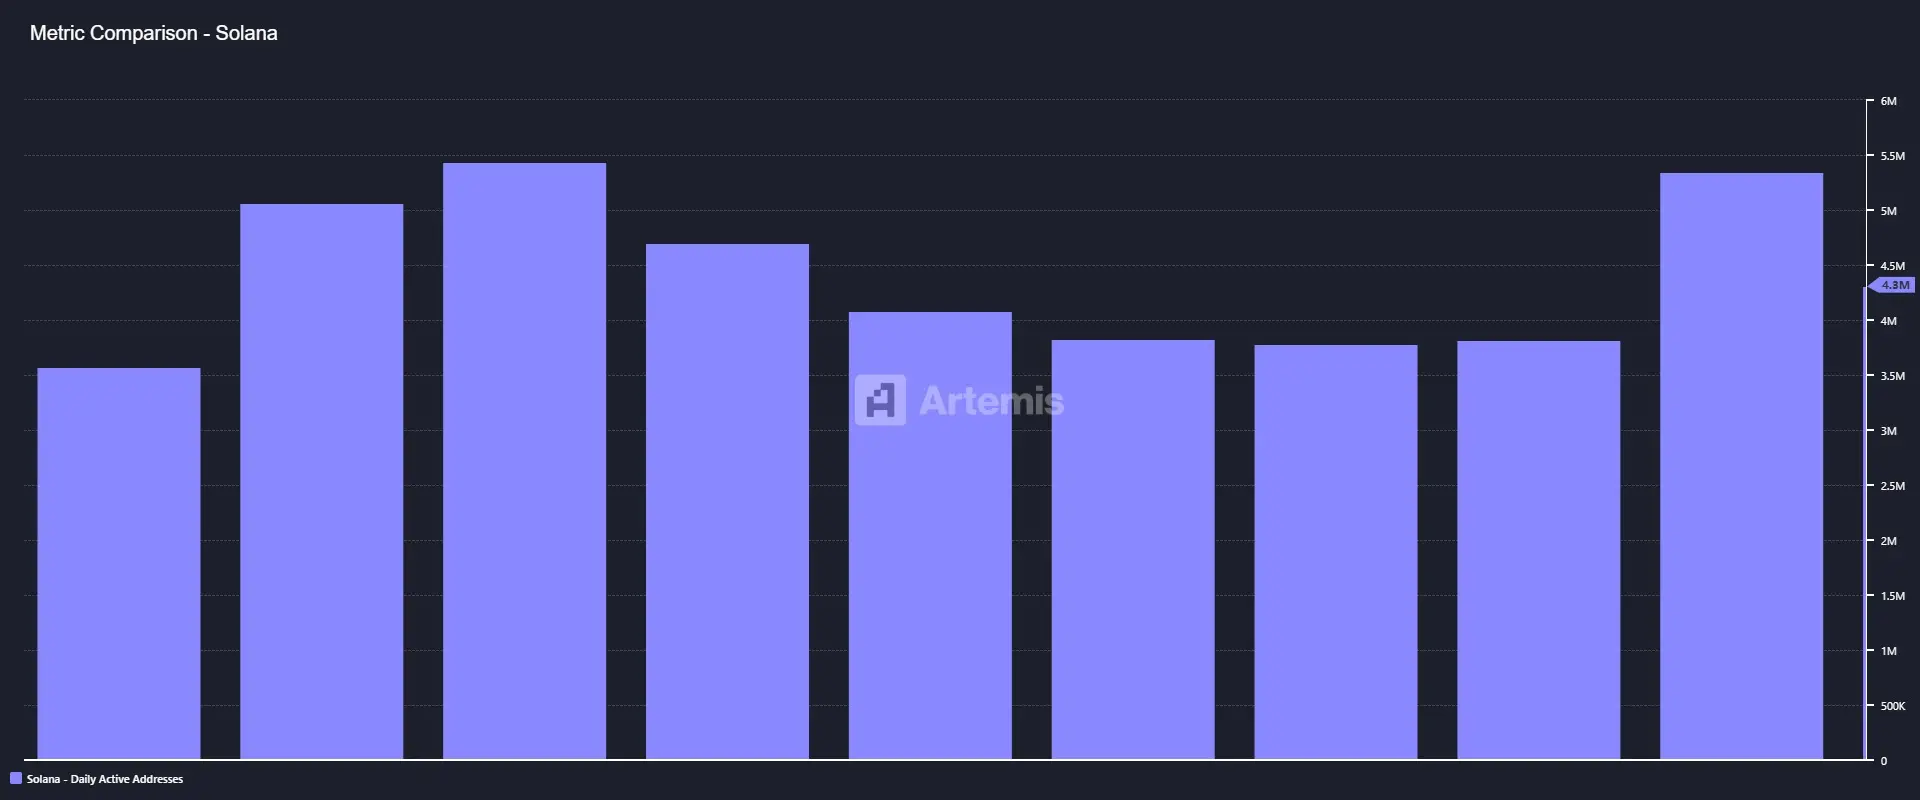
Daily active user count on the Solana chain
3. Capital Inflow Performance
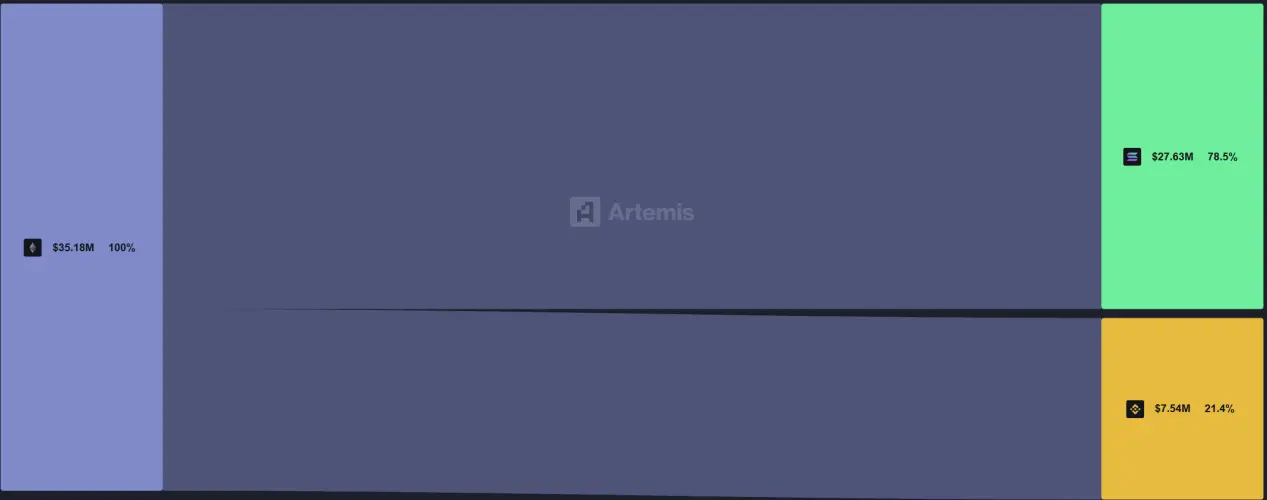
According to Artemis data, in the past 7 days, 78.5% of the funds flowing out of the Ethereum mainnet went to Solana, while only 21.4% flowed into BNB Chain. This capital flow indicates that, at this stage, market funds are more inclined to enter the Solana ecosystem.
Further analysis of the net inflow situation over the past week shows that since March 22, BNB Chain has continuously shown a net inflow, but began to experience capital outflows starting March 23. In contrast, the Solana ecosystem exhibited net inflows from March 19 to March 23, with only a slight net outflow on March 18.
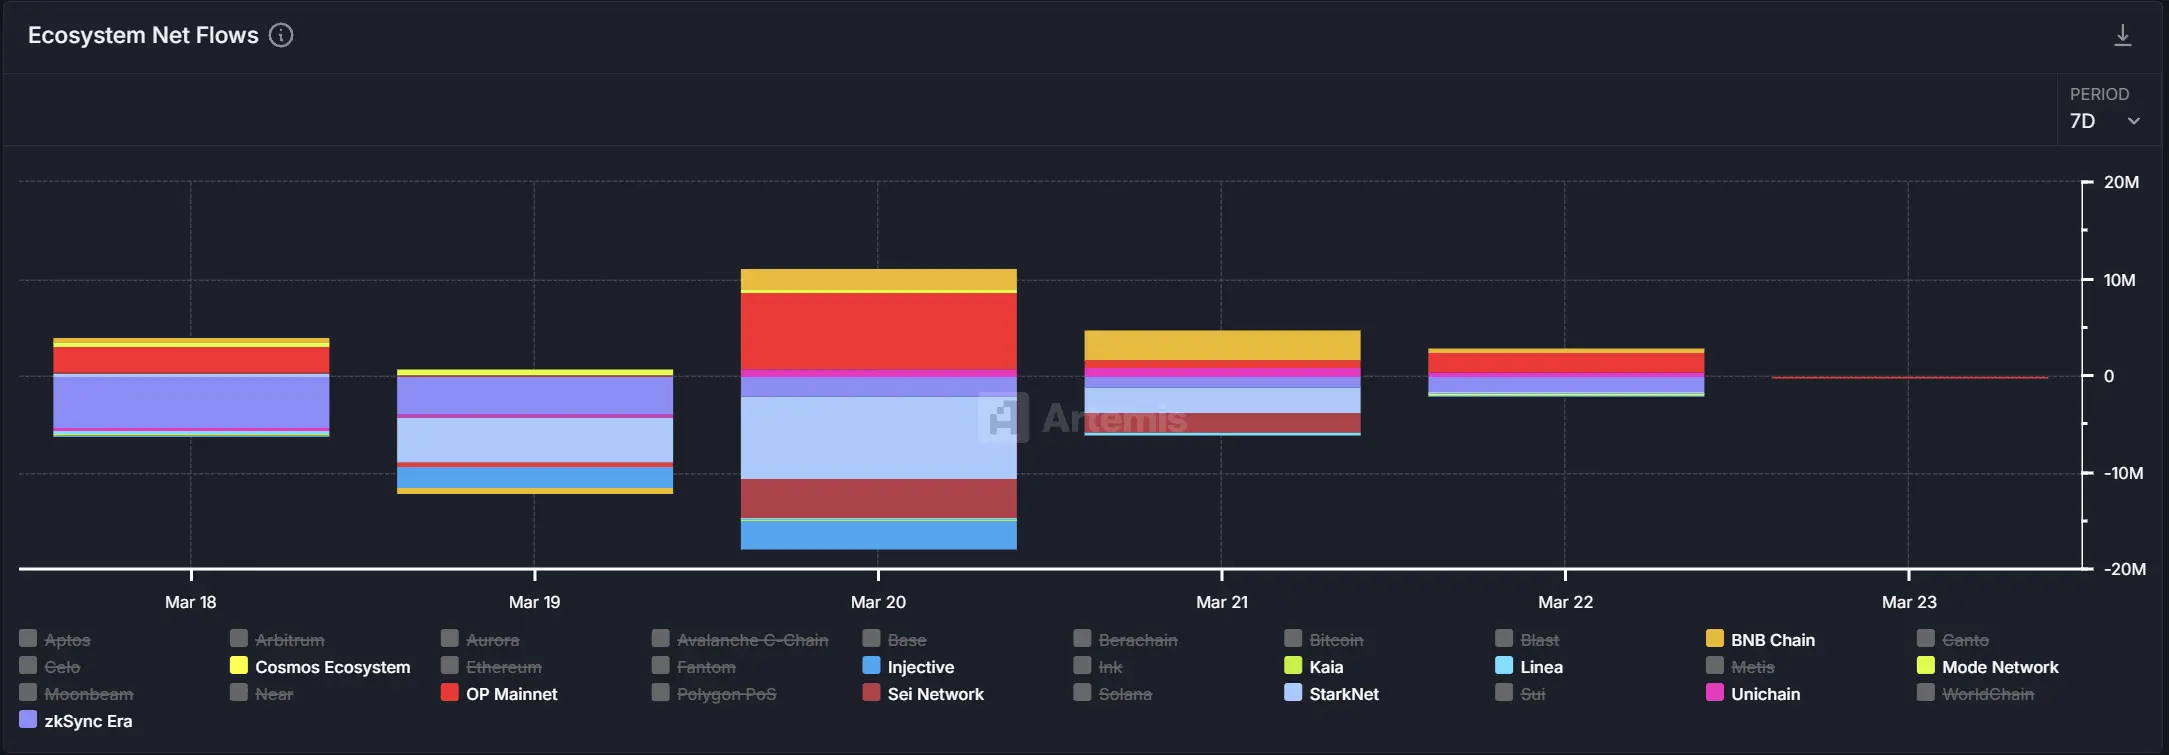
Additionally, combining the capital transfer data between the two chains, in the past week, BNB Chain saw an inflow of $521,000 to the Solana chain, while the Solana chain saw an inflow of $461,000 to BNB Chain. Overall, the trend shows capital flowing from BNB Chain to the Solana chain.
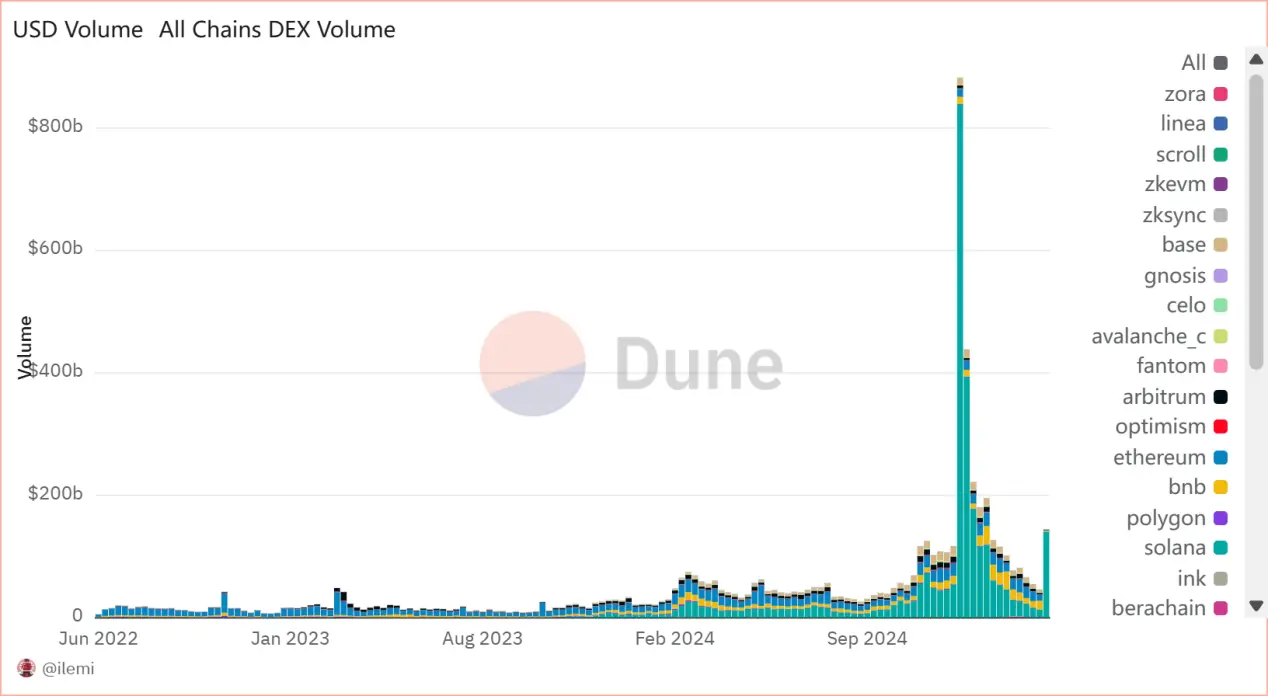
4. DEX Trading Volume
According to Dune data, the DEX trading volume on the Solana chain saw a significant surge on March 24, skyrocketing from $12.5 billion the previous day to $140.4 billion, a remarkable increase. In contrast, the DEX trading volume on BNB Chain plummeted from $14.1 billion to $1.4 billion during the same period, showing a starkly different trend.
This comparison further confirms that market funds and trading activity are clearly shifting towards Solana in the short term. The surge in trading volume not only reflects a significant increase in user participation but may also be related to structural factors concentrating hot assets on the Solana chain, indicating a stronger capacity for liquidity absorption within the ecosystem at this stage.
5. Transaction Fees
According to DeFiLlama data, BNB Chain generated $10.87 million in transaction fees last week, but as of this week, transaction fees have dropped to only $1.18 million, a significant decrease. In contrast, Solana's transaction fees last week were $5.74 million, and so far this week, they have generated $1.29 million. Although there has been an increase, the growth is relatively moderate, indicating that user activity has rebounded, but overall remains in a wait-and-see state, without large-scale actions yet.
Conclusion
In summary, the analysis of the five technical indicators shows that signs of revival in the Solana ecosystem are gradually emerging, particularly in terms of capital inflows, trading volume, and activity levels. Although Solana's transaction fees and price increases have not seen explosive growth compared to BNB Chain, the short-term rebound and capital flow indicate that the market is refocusing on Solana, and trading activities within its ecosystem are gradually heating up.
Especially from the perspective of capital inflow performance, Solana's share in cross-chain capital flows is gradually increasing, indicating that market confidence in the Solana ecosystem is strengthening. The surge in DEX trading volume and the increase in active address counts also somewhat prove the rebound in user participation.
However, despite the current growth trend, Solana's revival is still in a wait-and-see phase and has not yet formed a sustained growth momentum. Further inflows of users and capital will be crucial factors in determining whether Solana can fully emerge from its low point and compete with BNB Chain and others.
The road to Solana's revival still requires more time to validate whether it can break through the current bottleneck and continue to attract broader market attention and capital support.
免责声明:本文章仅代表作者个人观点,不代表本平台的立场和观点。本文章仅供信息分享,不构成对任何人的任何投资建议。用户与作者之间的任何争议,与本平台无关。如网页中刊载的文章或图片涉及侵权,请提供相关的权利证明和身份证明发送邮件到support@aicoin.com,本平台相关工作人员将会进行核查。


