
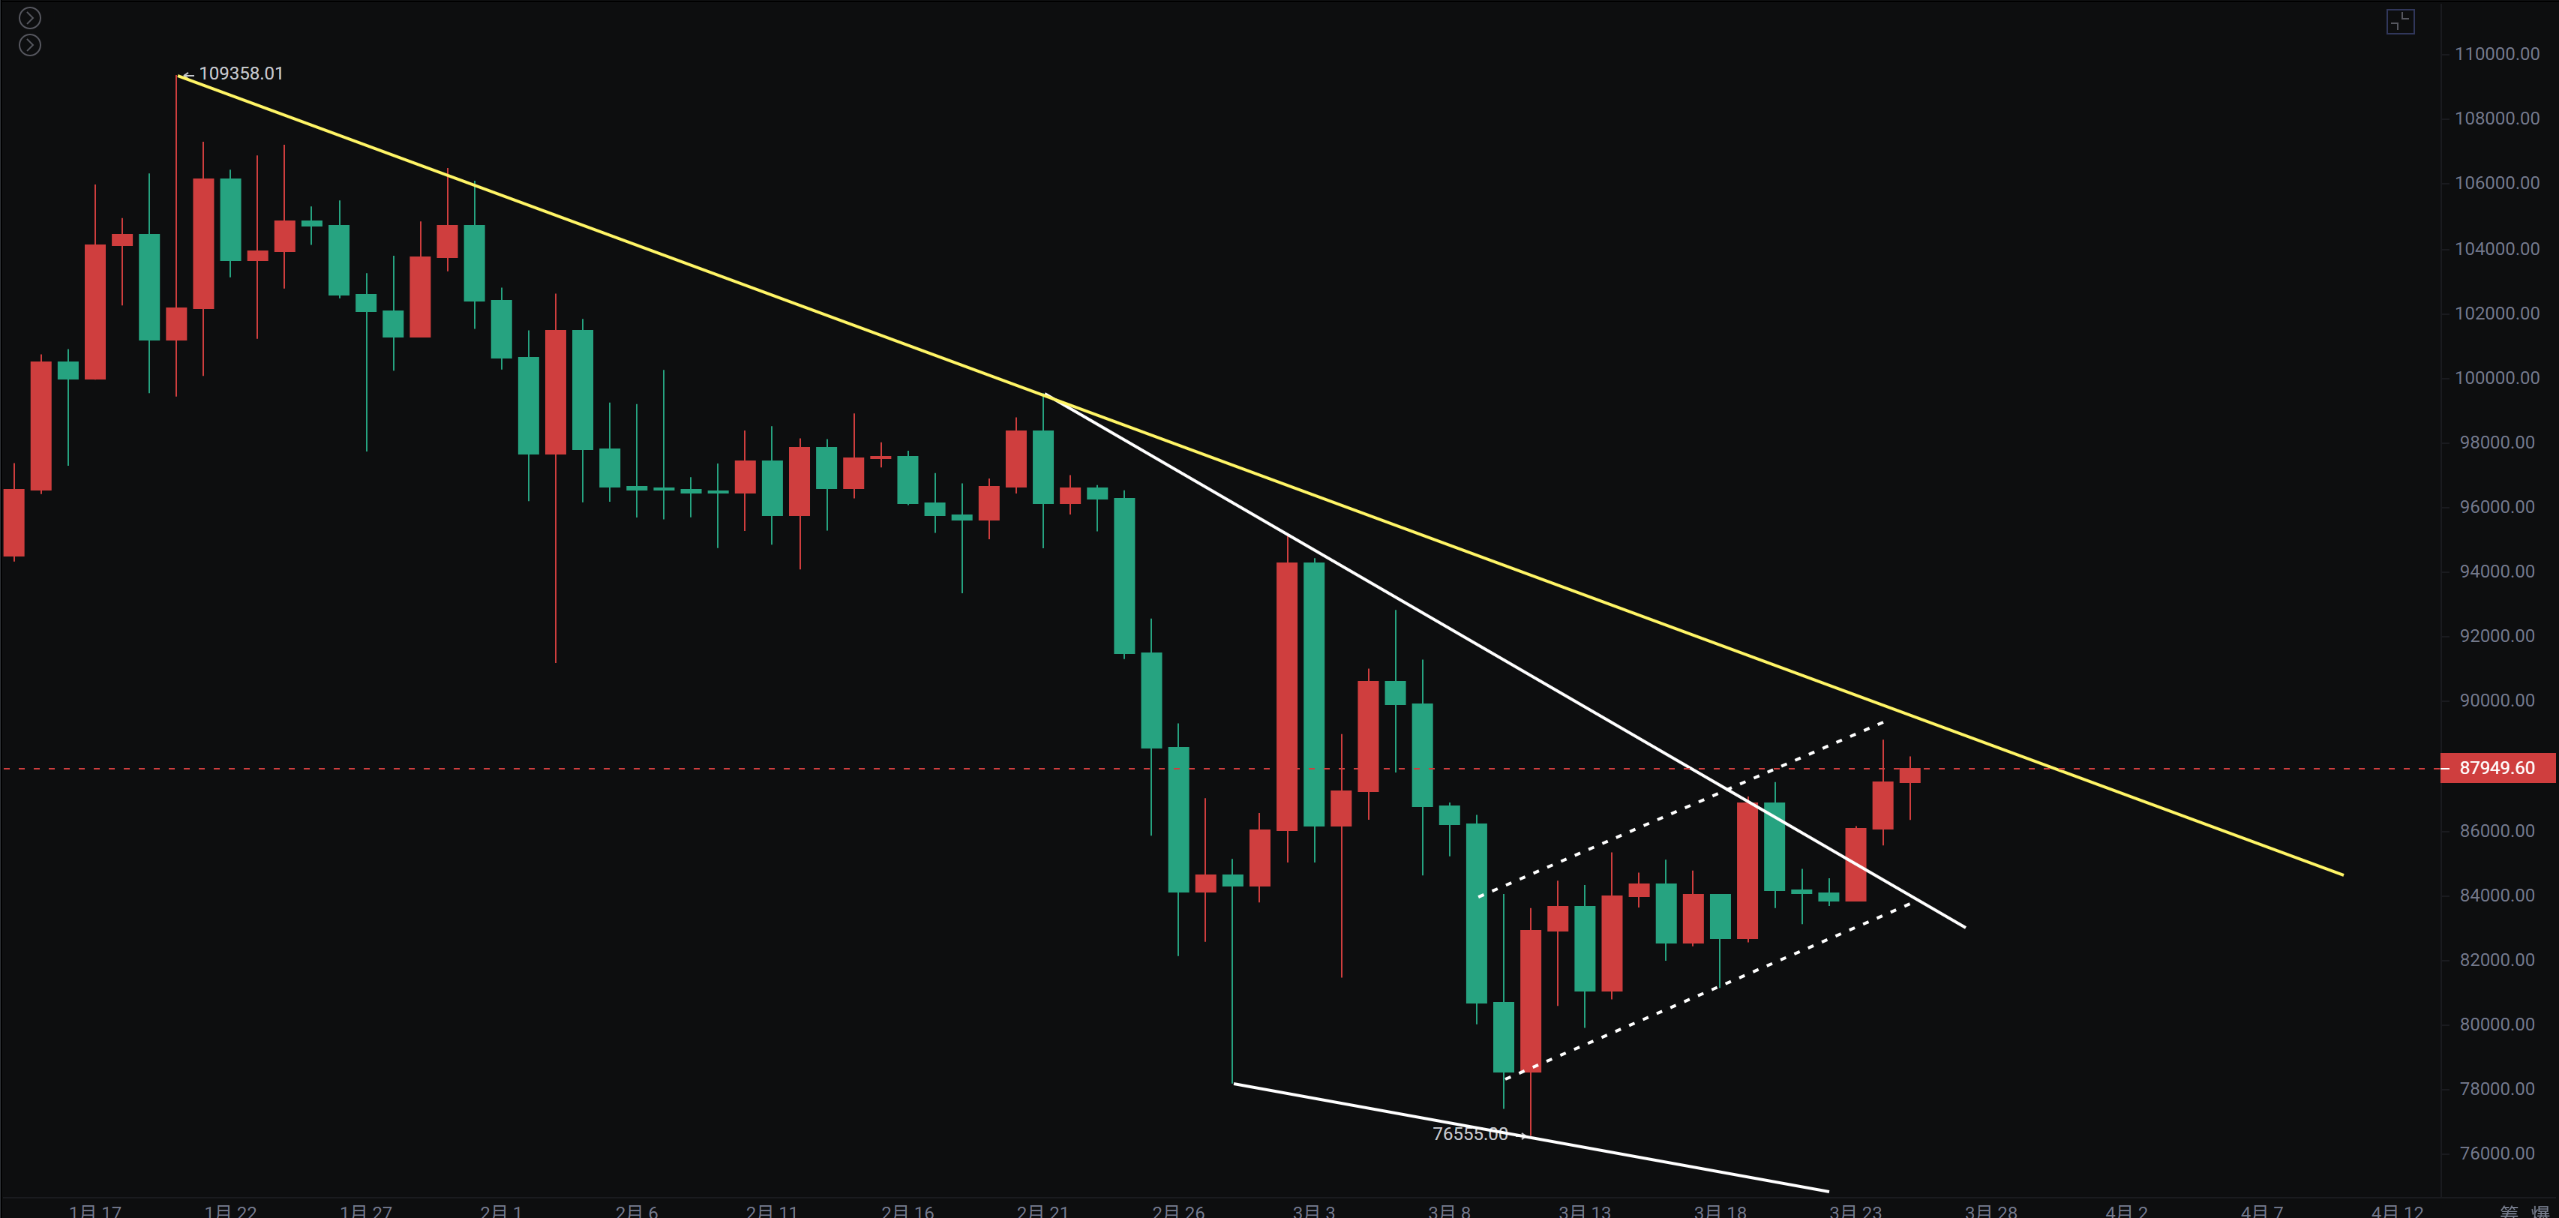
After the second test and break of the weekly Bitcoin price, it has rebounded with two consecutive bullish candles. The current price is around 88,000, which has not changed from our initial thought starting on the 12th. The first target of the descending wedge at 87,500 has been reached, and the next target is the shark pattern pointing to 97,000.
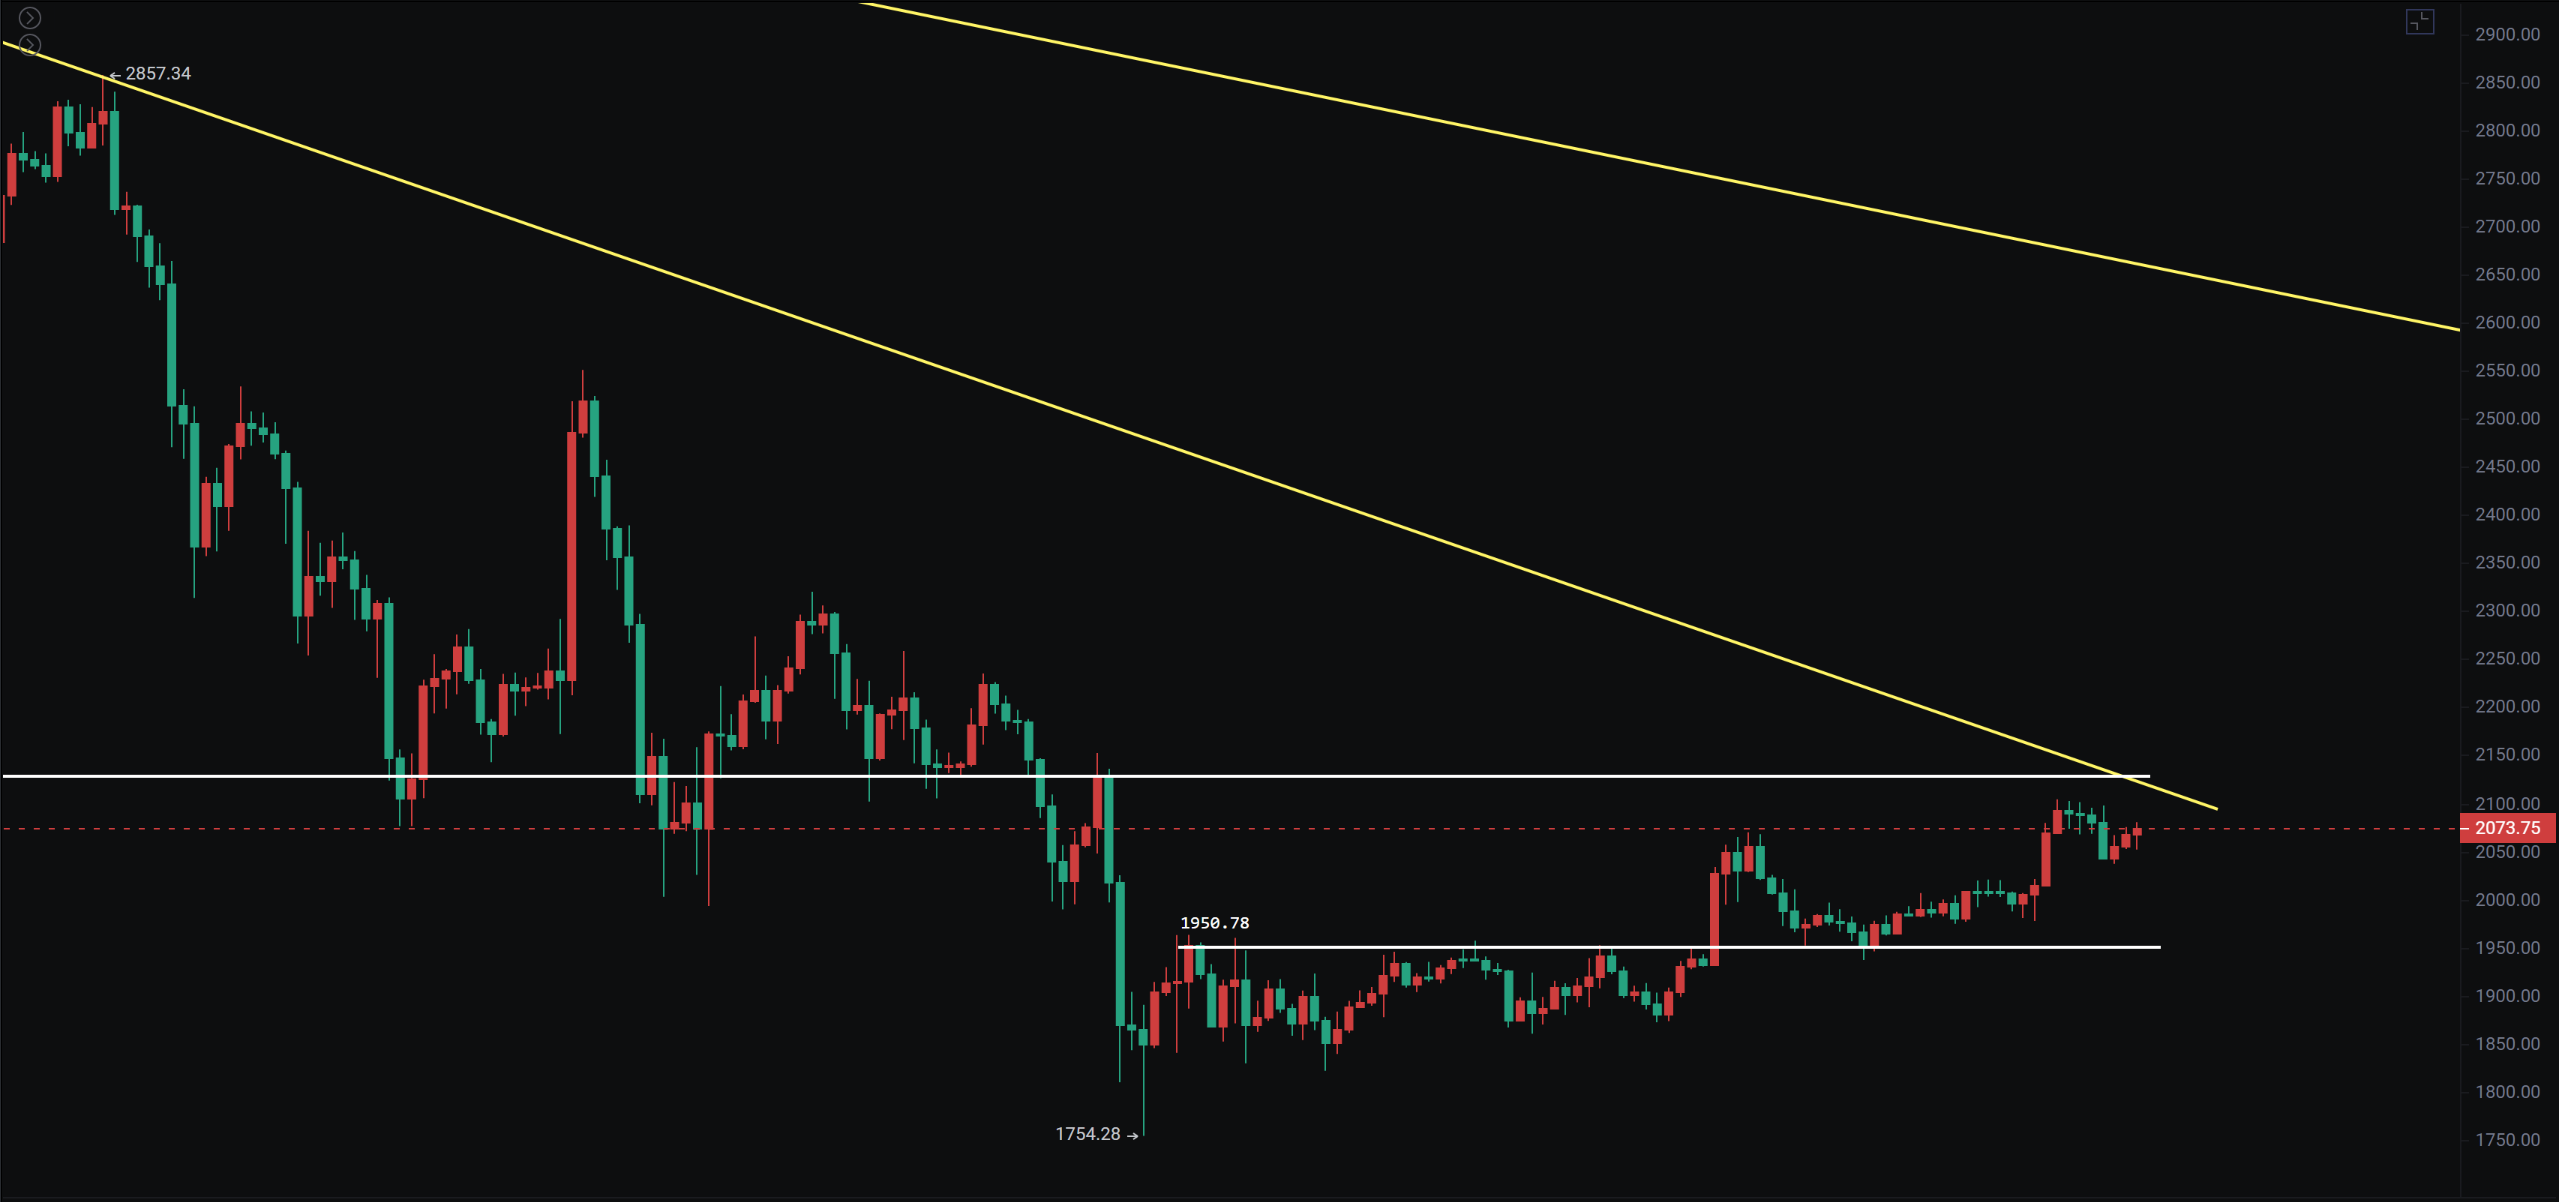
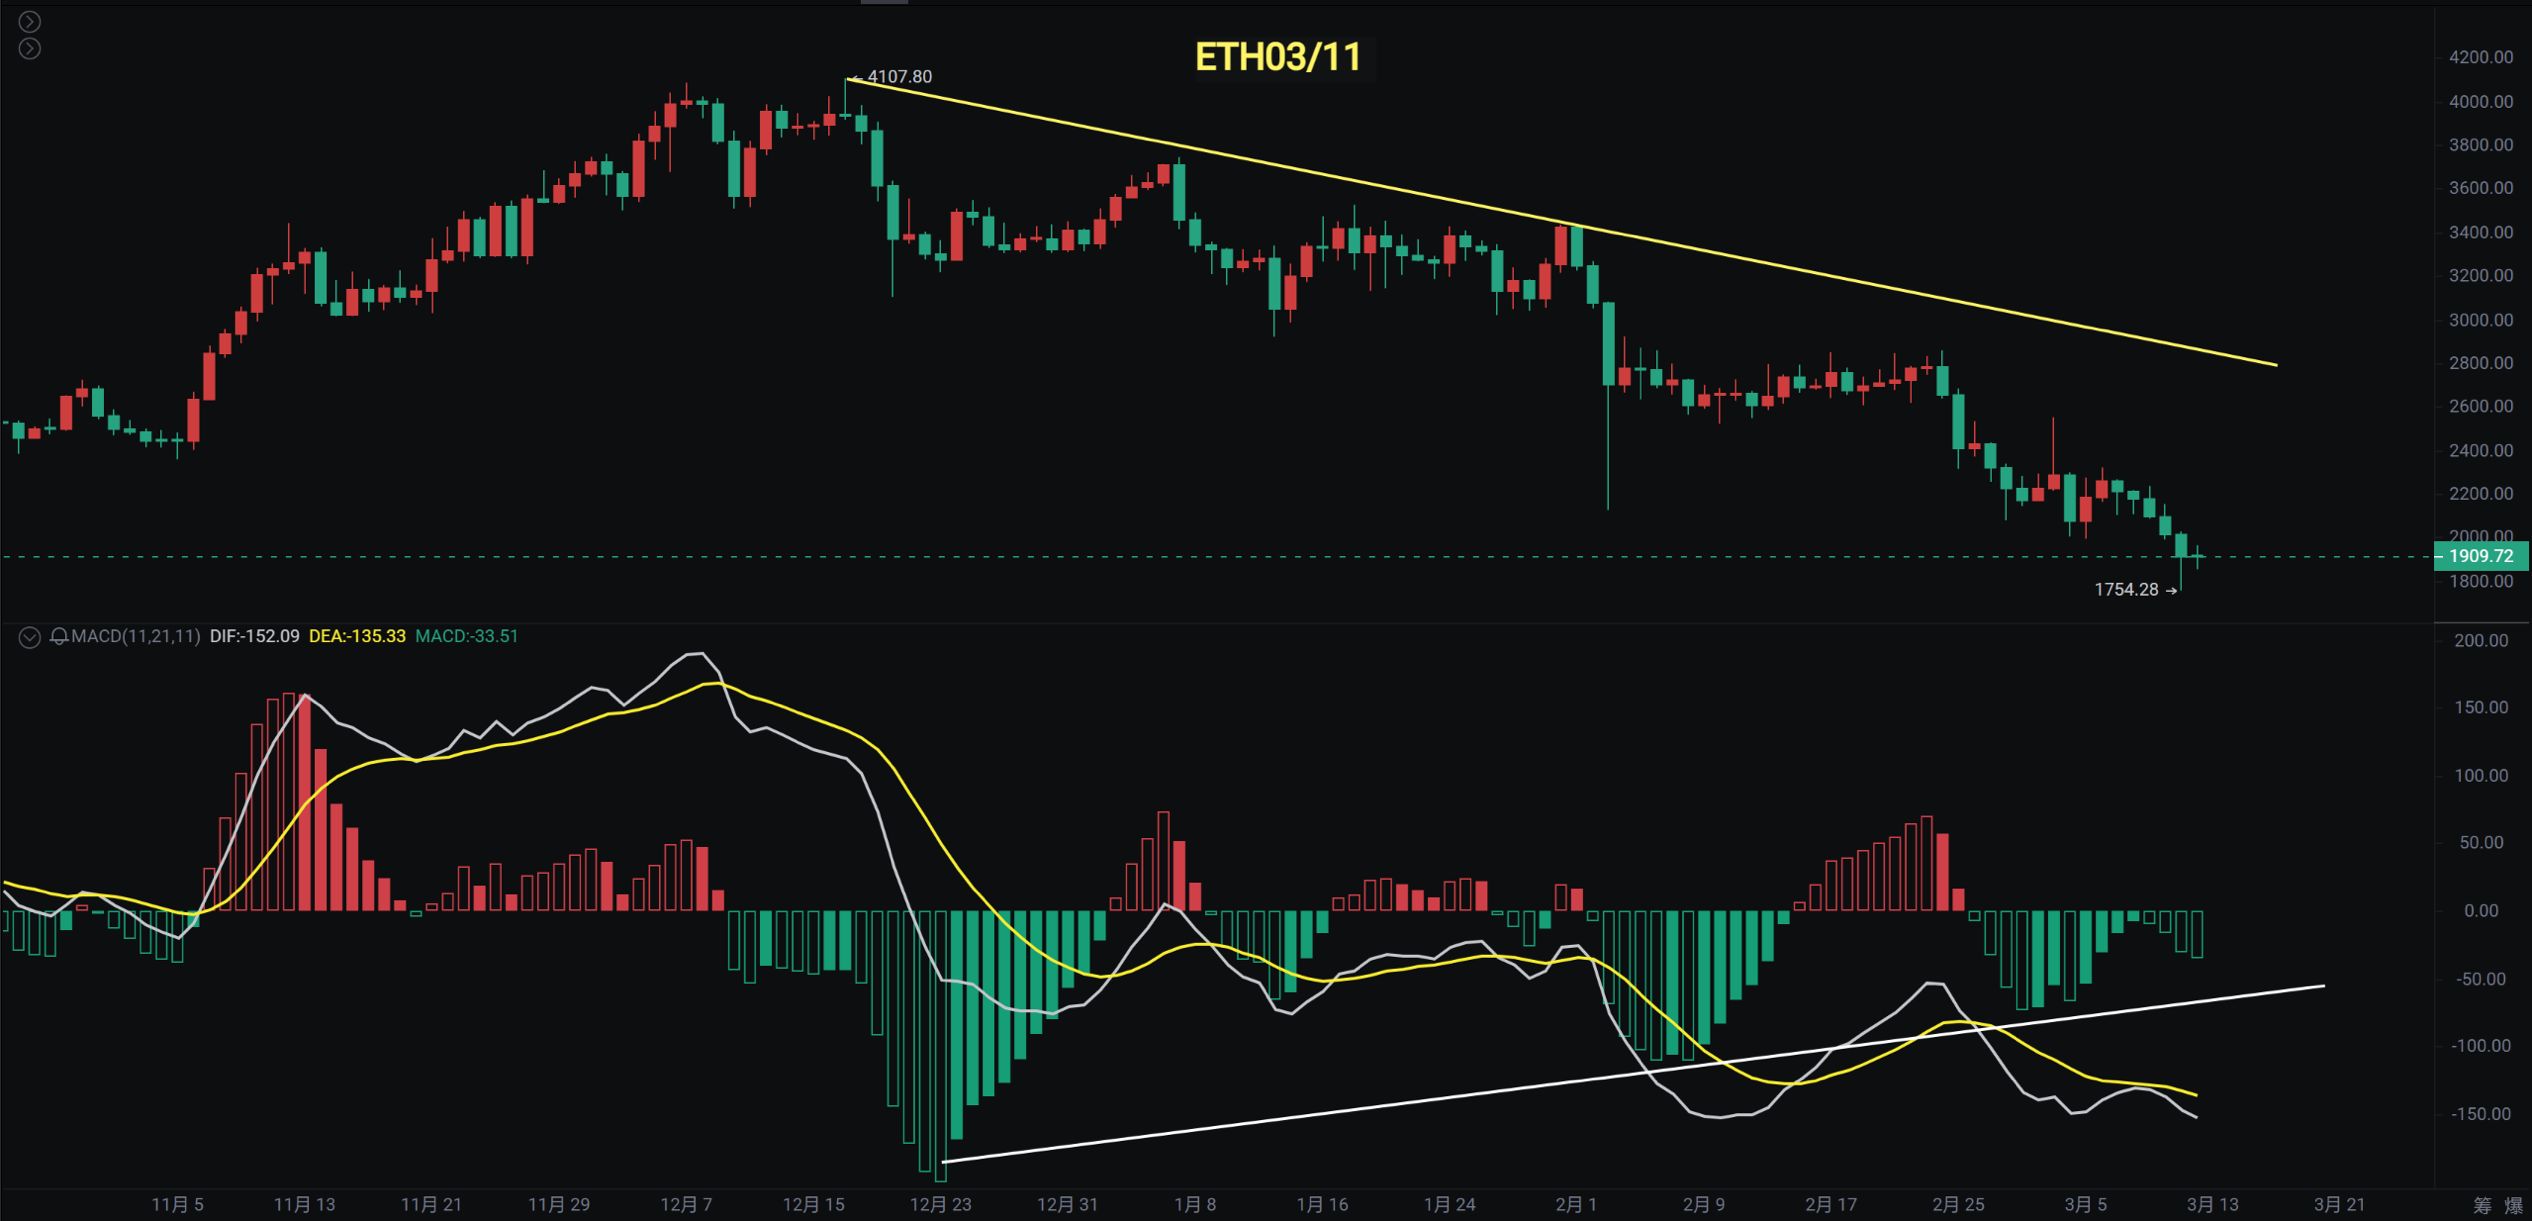
Ethereum's lowest spike was 1,754, and the current price is at 2,079. Although Ethereum has been relatively weak, we expect a rebound in the US stock market and Bitcoin, so we are not continuing to be bearish on Ethereum. After Bitcoin's second test and recovery, Ethereum is also advised to hold the initial position and see if it can recover above 2,100 before considering adding to the position.
We started warning about a potential black swan crash in the US stock market and Bitcoin on February 22-23. After the spike, the weekly MA60 has rebounded, and we mentioned looking for a rebound in wave B. As of the time of writing, the market is still in a rebound.
On February 25, 2021, BTC broke through 99,000 as expected, facing pressure near the daily downtrend. Short-term attention should be paid to the risk of a pullback.
On February 25, 2023, the largest hacking incident in history occurred, causing BTC to drop nearly 5,000 points, with the US stock market crashing, a potential "black swan."
On March 11, 2023, BTC's second test broke and recovered. Will it come back to 312 this year? Short-term focus on the 84K gamble.
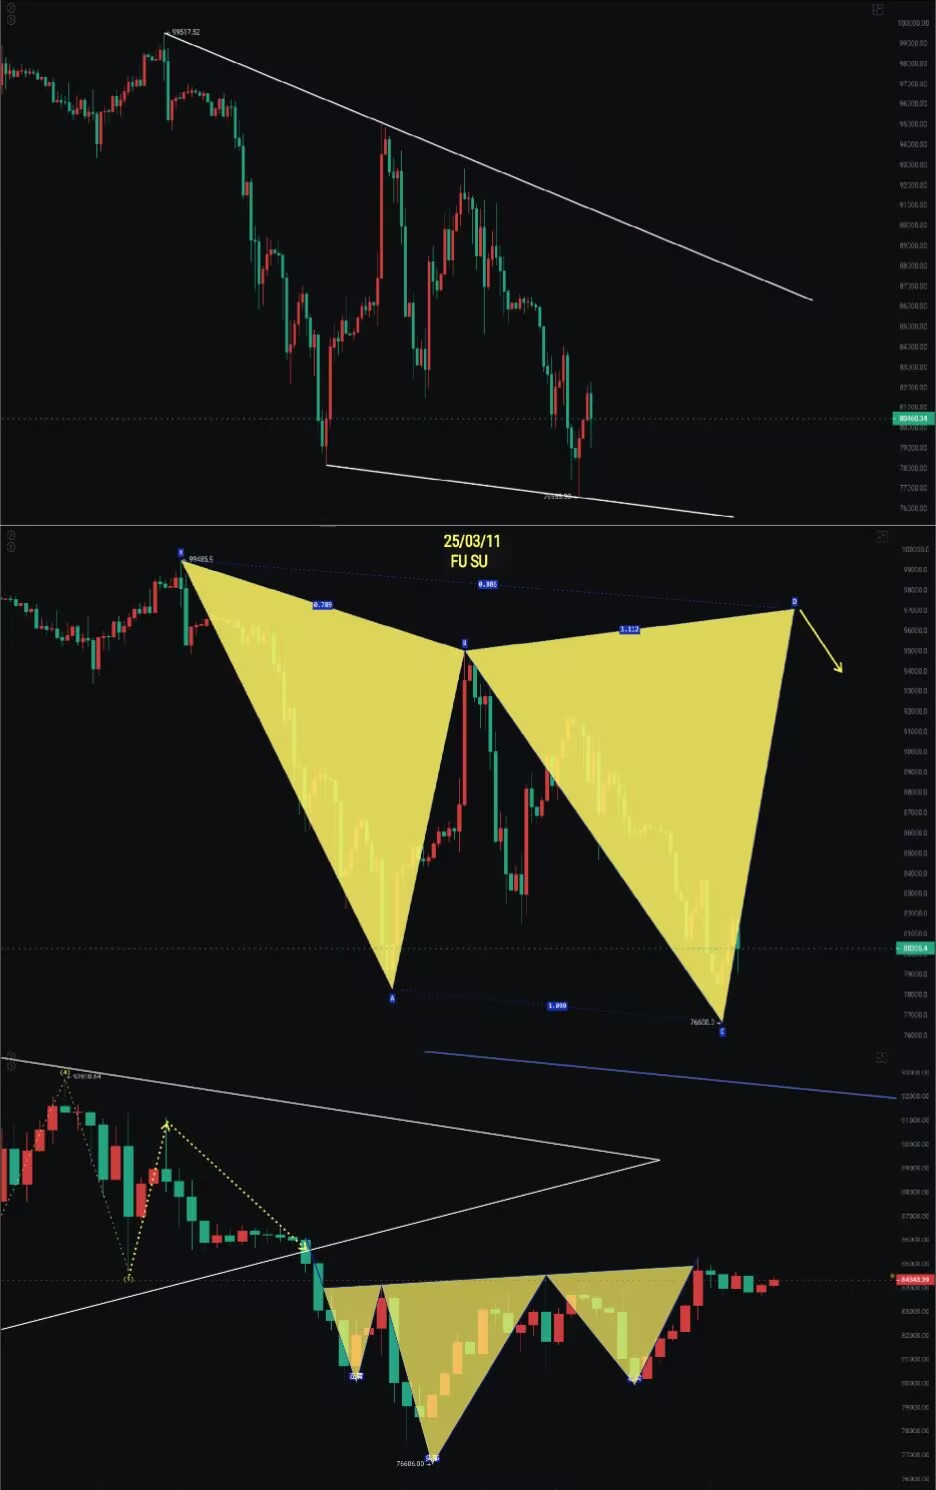
On March 12, 2023, BTC rebounded with a spike to 84,000. Can it withstand external pressure? The shark pattern looks towards 87,500.
On March 14, 2023, BTC continued to oscillate in the short term, with the shark pattern's second target at 97K. The rebound strategy remains unchanged.

Bitcoin's daily descending wedge breakout was warned on March 12, with the first target at 87,500. On March 14, the second target of the shark pattern at 97,000 was also mentioned, which basically aligns with expectations.
The daily MACD has shown a bullish divergence, and there was a slight increase in volume yesterday. The recent two weeks have maintained an oscillating upward channel. This wave of decline has not effectively broken the daily downtrend line even once in over two months from the highest point.
The daily shark pattern points to 97,000, but recent pressure needs to be noted at 91,500 and 95,000.
Support: Pressure:
Ethereum
The weekly rebound closed still below 2,100, but after a short-term pullback to support, it continued to rebound. It was previously mentioned that given the rebound in the US stock market and Bitcoin, although Ethereum is weak, it can only rebound. If it effectively breaks through 2,100 and stabilizes, it will be relatively safe.
After breaking through 1,960 on the 4-hour chart, it confirmed support on the pullback and continued to rebound. The short-term outlook continues to see a rebound, with resistance above at 2,100—2,300—2,500.
Support:
Resistance:
If you like my views, please like, comment, and share. Let's navigate through the bull and bear markets together!!!
The article is time-sensitive and for reference only, updated in real-time.
Focusing on K-line technical research, sharing global investment opportunities. Public account: Trader Gongzi Fusu

免责声明:本文章仅代表作者个人观点,不代表本平台的立场和观点。本文章仅供信息分享,不构成对任何人的任何投资建议。用户与作者之间的任何争议,与本平台无关。如网页中刊载的文章或图片涉及侵权,请提供相关的权利证明和身份证明发送邮件到support@aicoin.com,本平台相关工作人员将会进行核查。


