比特币经过周末以震代跌行情再次反弹情绪,我们周五布局的低多思路也是完美获得不错的空间。
当前周K 更新后比特币依托MA30日均线附近震荡运行,虽然MA5 10日均线小幅下压币价,但是BOLL带下轨持续上收,加上MACD 与K DJ 指标空头情绪出现收缩,一旦本周多头再次发力比特币将会再次试探周K MA10日均线压制 币价参考在92000一线。
日线来看当前比特币再次运行到BOLL带中轨和MA30日均线上方,且MA5 10日均线短期走出小幅上拐情绪,指标方面看短期多头情绪浓厚,结合12小时线判断当前币价依托上轨震荡上行,且MA30日均线开始拐头向上,短期84000一线再次变成底部支撑,短期内回踩无法跌破此支撑那么后续币价将会奔着日线上轨90000关口而去。
4小时线当前K 柱 5连阳,且TD指标来到TD 9后再次滞后,币价当前踩着MA5日均线震荡上行,说明TD指标滞后到TD13概率加大。结合小时线来判断当前指标滞后很严重,短期行情偏向小幅震荡上行走势,不过日线90000关口附近还是存在一定压制,所以短期我们看多不追多,等币价反弹压力附近我们在轻仓布局空单思路,等回调在低多进场。
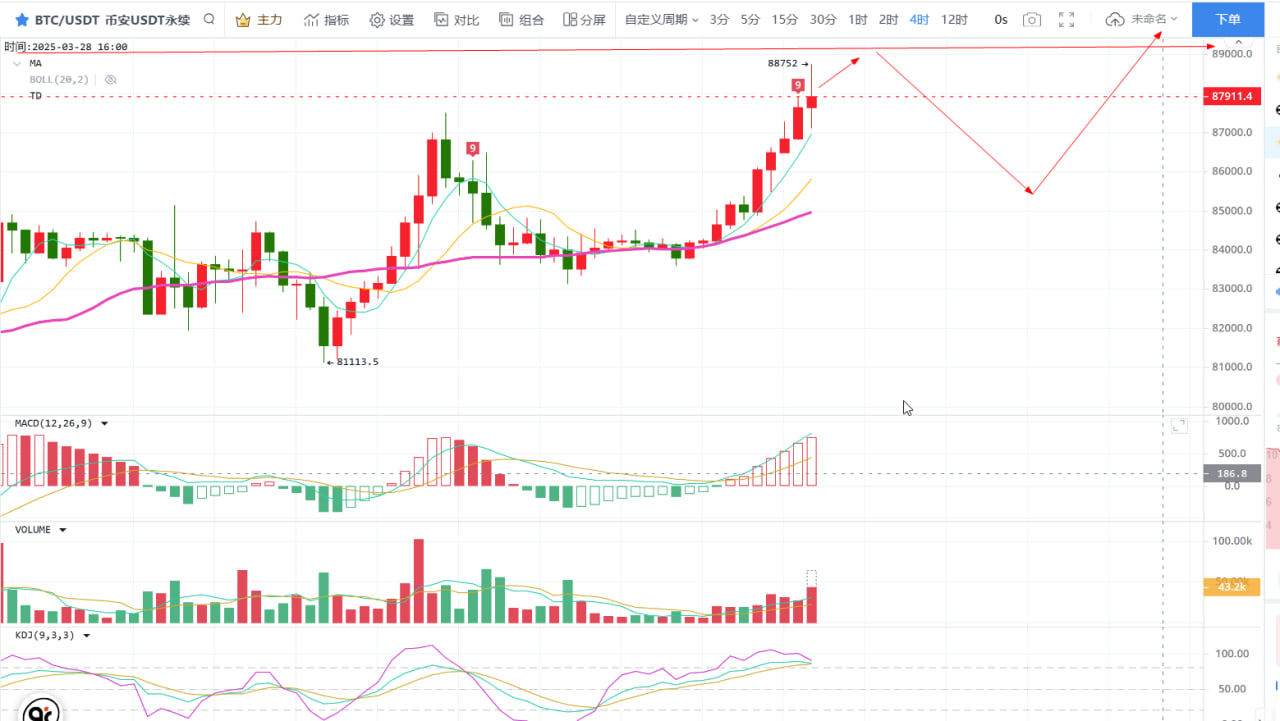
操作思路:比特币:88700-89500空 目标 :87000-85000 即可 止笋:90000
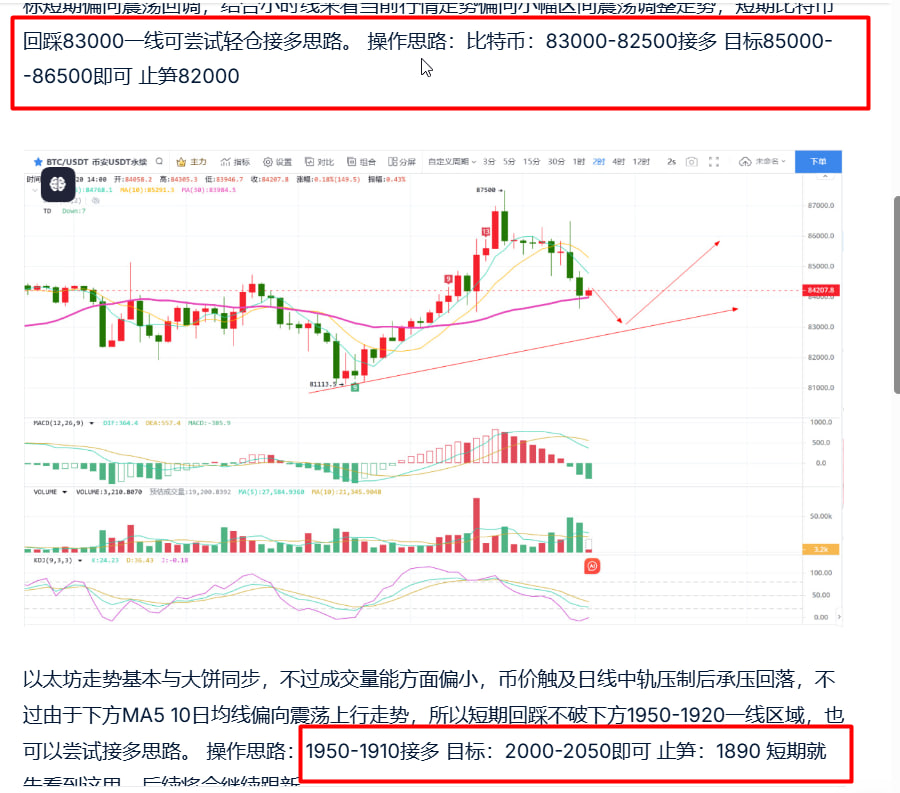
以太坊走势基本与大饼同步,不过成交量能方面偏小,币价即将触及日线MA30日均线压制,加上整体走势弱于大饼,所以短期思路一致反弹高位布局空单思路。 操作思路:2095-2120 空 目标:2060-2010即可 止笋:2135
短期就先看到这里,后续将会继续跟新
个人看法仅供参考,如有跟单者注意把控风险,具体进场离场点位以实时指导为主,入市需谨慎。
在币圈这个市场上,不缺老师,不缺分析,更不缺操作建议。缺的是能够真正帮助大家解决问题的人。投资不要盲目,需要理智的选择,也需要有人指引,如果你还在迷茫。建议找一个专业的老师指引你走的更远,一套科学合理的交易体系,仓位控制风险把控技术体系能让站的更高!带你走出迷茫和黑夜! 正如此刻还在举棋不定的你,赶紧扫描二维码关注有惊喜,行情在线解析
免责声明:本文章仅代表作者个人观点,不代表本平台的立场和观点。本文章仅供信息分享,不构成对任何人的任何投资建议。用户与作者之间的任何争议,与本平台无关。如网页中刊载的文章或图片涉及侵权,请提供相关的权利证明和身份证明发送邮件到support@aicoin.com,本平台相关工作人员将会进行核查。


